

Transcripted Summary
As you know virtually all enterprise apps have charts of some kind.
This may be true for all kinds of apps as long as they have some kind of analytics built into them. So, it’s very important to ensure the charts are displayed correctly and are displaying the data accurately.
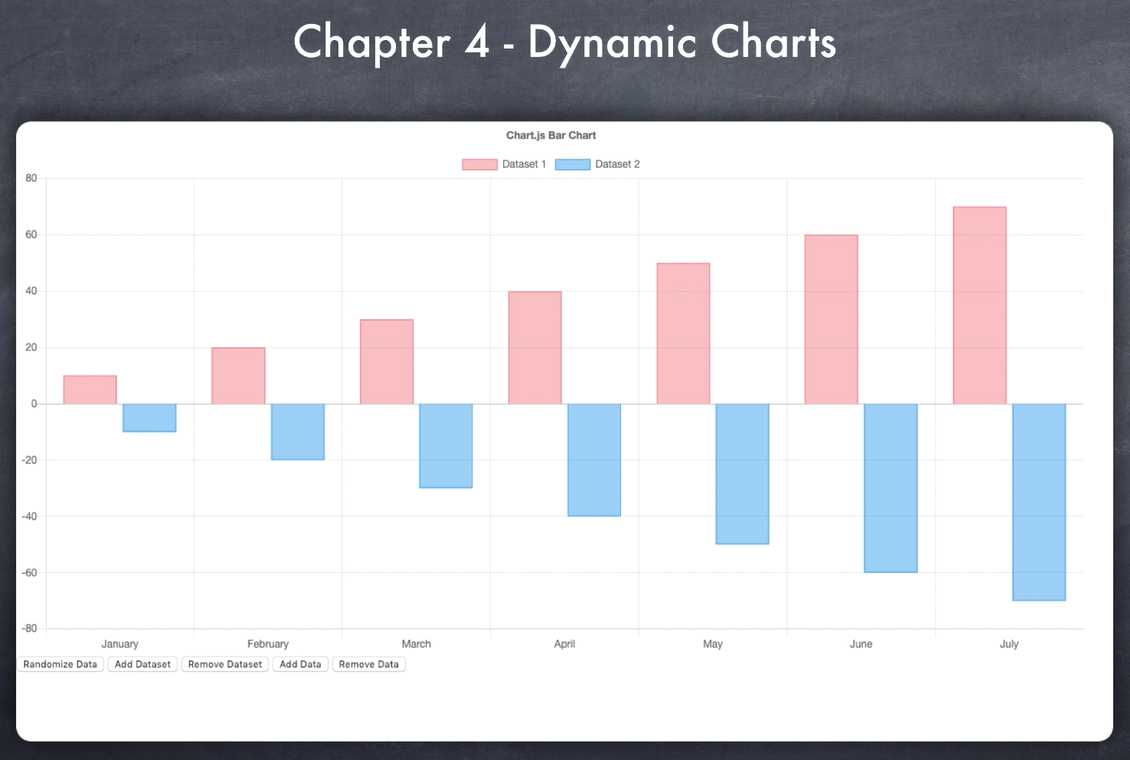
In this example, there are two tests.
Firstly, we need to ensure that this chart is displaying things correctly
And secondly, if we add a “data set”, it needs to resize itself and show the newer dataset properly along with the old ones.
# In the legacy way, you simply can’t even test this because there are too many things going on.
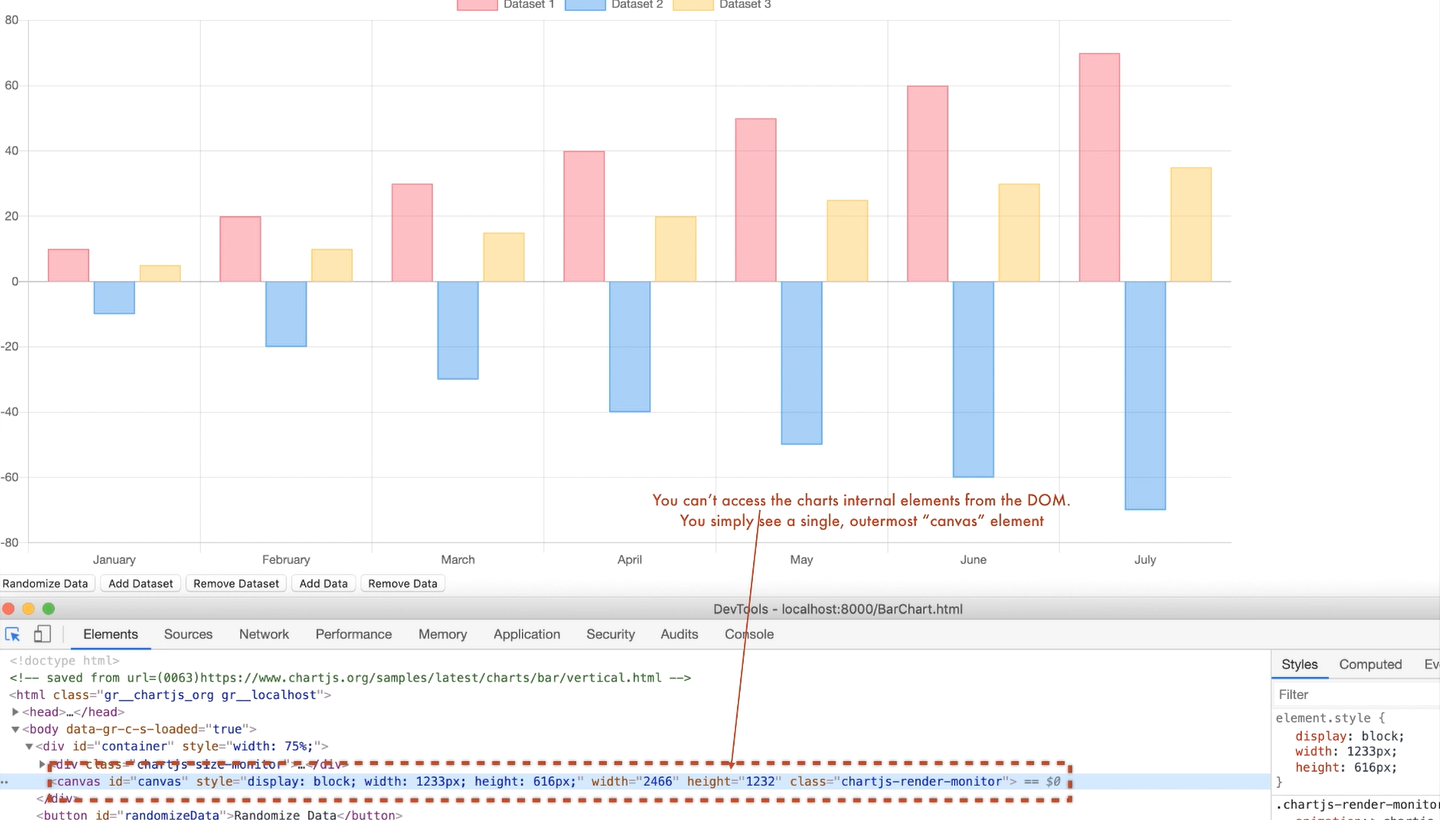
And in most cases, you can’t access the chart’s internal data through the DOM.
For example, in this case, the chart is built using Canvas technology and you just see a single line.
# However, in the modern way, since you are taking screenshots from the top, you can check everything.
- So, all you need to do is to take a screenshot of the chart.
- And then again, take another screenshot after the new data set is added.
Now that you have two screenshots and two baseline images.
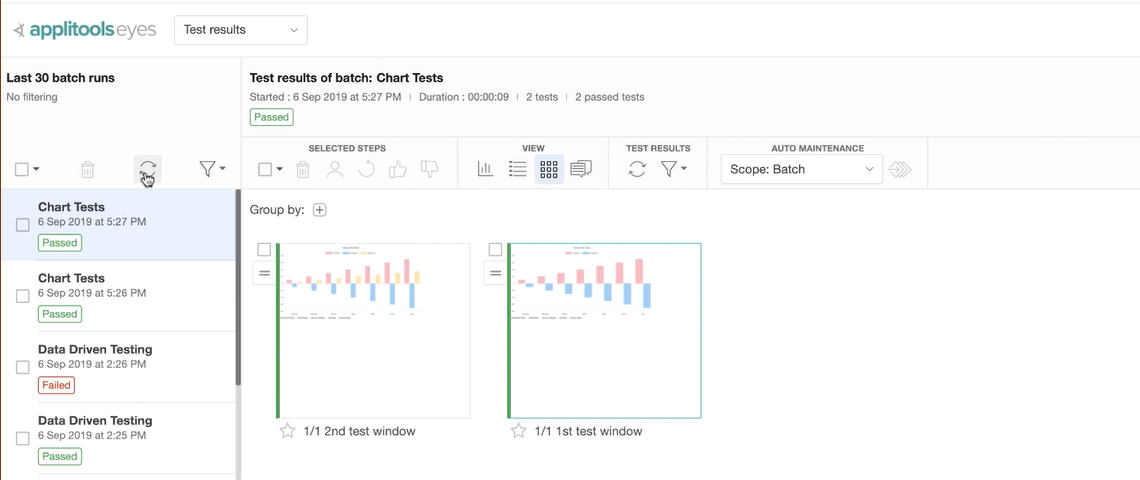
So, in the future if the chart breaks for any reason, you’ll see the difference.
That's how you can very easily test all these dynamic charts.
