Transcripted Summary
Because we're starting to write quite a lot of code now (and I've been actually using an editor to write the code) there is functionality in Chrome that can help us do that.
Let's have a look.
In the Sources view, if I click on Snippets, I've now got a mini IDE.
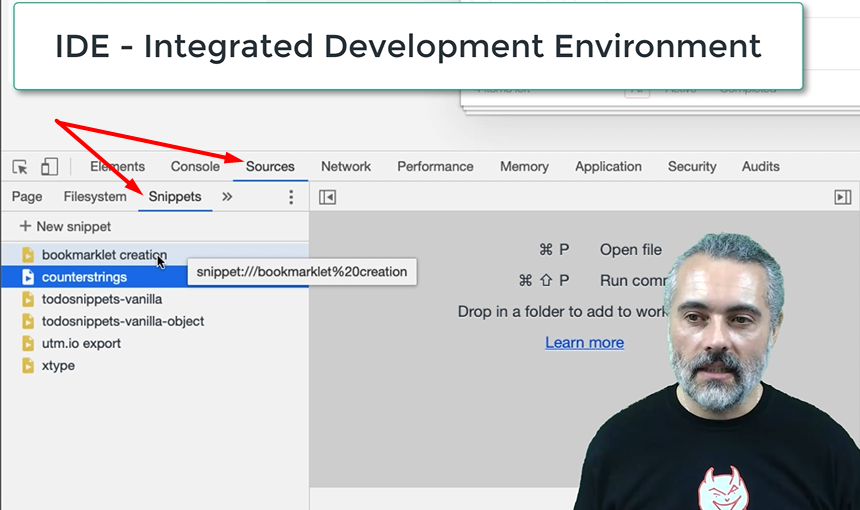
If I create a new snippet here, I can start writing JavaScript in here.
Let me take the toggle every item code that we've written for.
Now you can see I've got syntax highlighting in here.
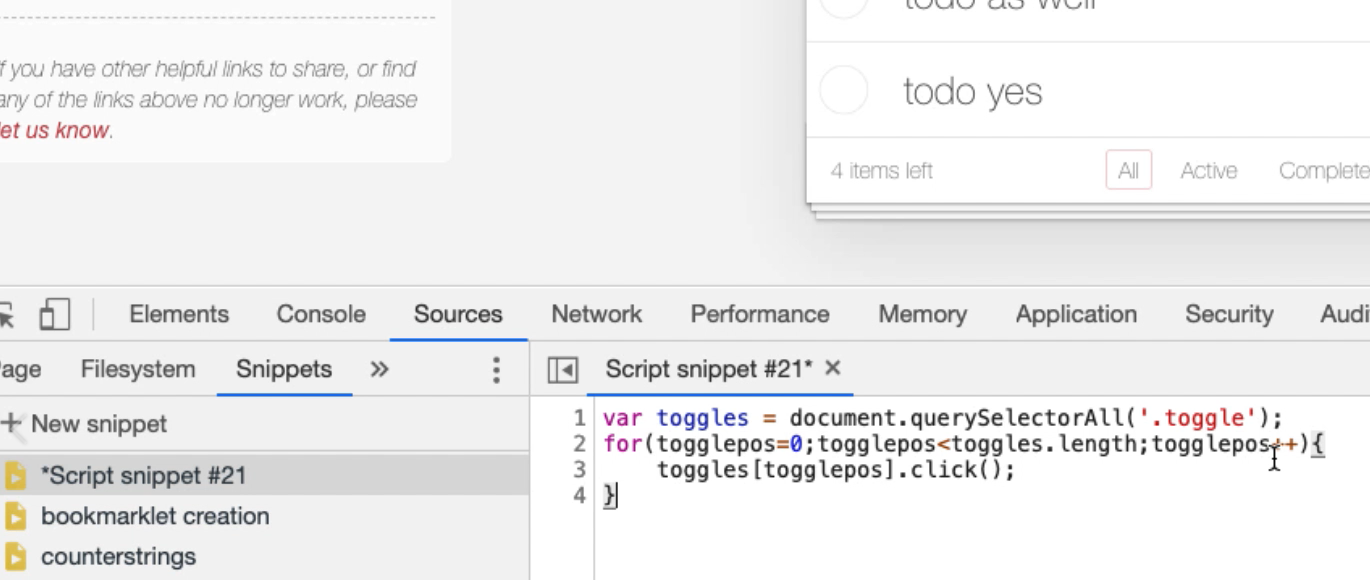
I can actually run this code from within the editor here, and it runs. So, I've got a little IDE. I'm going to rename that snippet and call it “toggle all for todomvc vanilla”.
Note about Snippets
Now, one of the issues we have is that sometimes the snippets go away. So, it's not always guaranteed that they're going to be there. I tend to keep my snippets in Evernote somewhere, or in a text file. But I like using the snippets view to run them. It's just that whilst I can save them as a file, it doesn't necessarily always guarantee to keep them in Chrome itself. So, it's just something to be aware of.
Now, one of the differences between this snippet view and the console, if I do document., I don't have as much code completion here. What I do have are syntax errors. It's showing me what the syntax errors are, but I don't necessarily have the code completion.
Sometimes if I'm writing code and I can't remember exactly what it is, I'll come into here and then I'll do, okay, I'll do code completion in the console, and then just copy and paste it into the editor to then pick up syntax errors and anything else I need to do.
Because this is an editor, one of the things that's useful in here is I can do “pretty printing”.
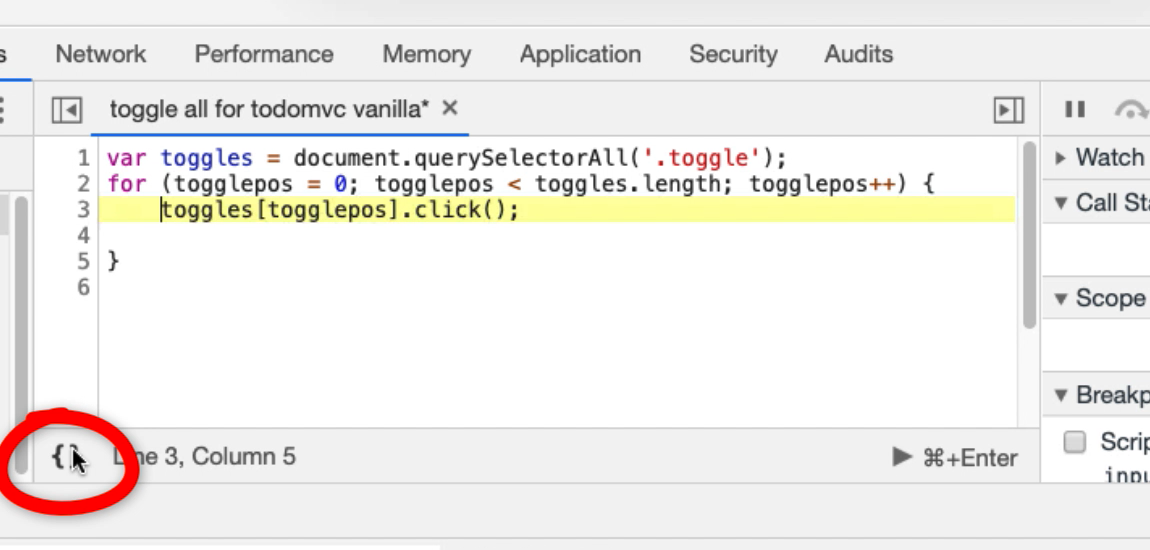
This pretty-prints (formats) my code so I don't have to worry too much about the formatting.
And I can debug my code, which is really important.
To add a breakpoint, I'm going to either right click and do Add breakpoint, or just click on the side here.
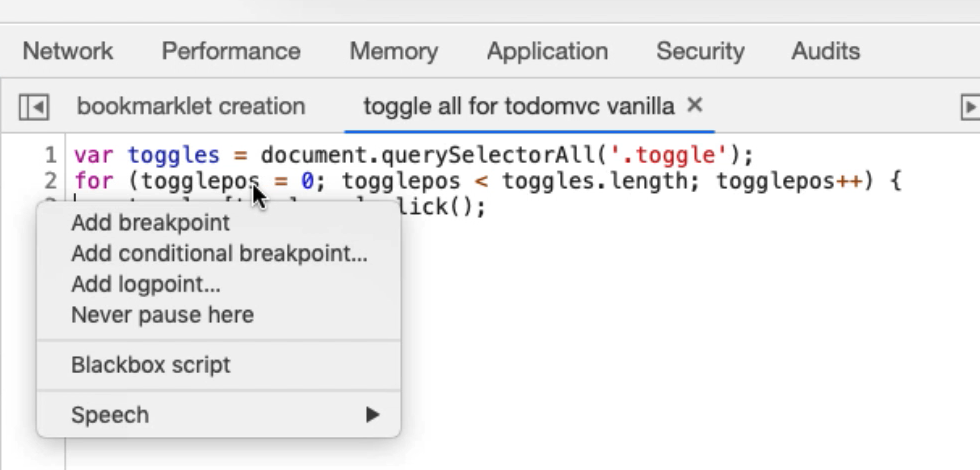
What that basically means is when I run this, it will stop on that code. It's a breakpoint. It's useful for debugging.
Let me do this.
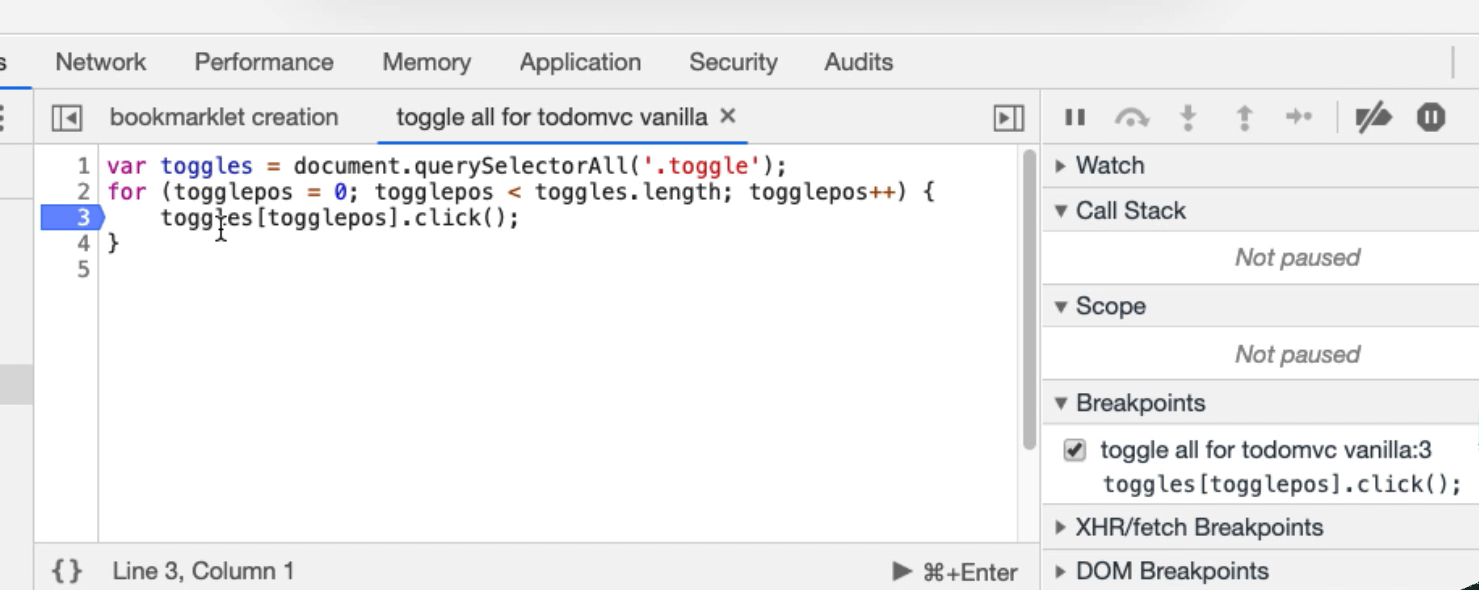
Now, what this means is, I can now watch variables.
- I can hover over the items; I can see how many things are in the “toggles” list there.
- I can see which “togglepos” I'm on.
- I can set watches.
Let me add a watch for “togglepos”.

Now, when “togglepos” changes, I'll see the value in here.
Because I've breakpointed here, I want to _Step Over _the next function call to move to the next line.
Now we're going to increment “togglepos”, check that it's under the length, then enter the loop again, so “togglepos” is now 1.
And so, by doing this, I can actually see the code in action doing what it needs to do, and I can check whether there's any problems. This is incredibly useful.
Another thing I can do.
Going to breakpoint there again... Oops. Pausing debugger. So, I'm going to run through and “togglepos” has changed a few times. I can now, in the console, actually interact with the code that is running. So, I can see “togglepos” here, and I can run it.
Now this is hinting at the fact that, because I have access to all the code of the application, I could set breakpoints on the actual running application and start hacking it and doing breakpoints and debugging the actual application that's in the browser.
Nothing is private once we start loading code in the browser. It's worth remembering that.
But for our purposes of writing bots, this snippets view is a very good in-built IDE that can support us, so I don't have to keep creating scratchpads of code all the time. Although I do that in order to record the code that I'm writing, I'll tend to write it in here and the console, debug it from here, and run it from here, because it's just much easier to work with.
