

Transcripted Summary
In Selenium IDE there are plugins that enable you to enhance or extend the capabilities of what's in Selenium IDE, and that shows up really in one of two different ways.
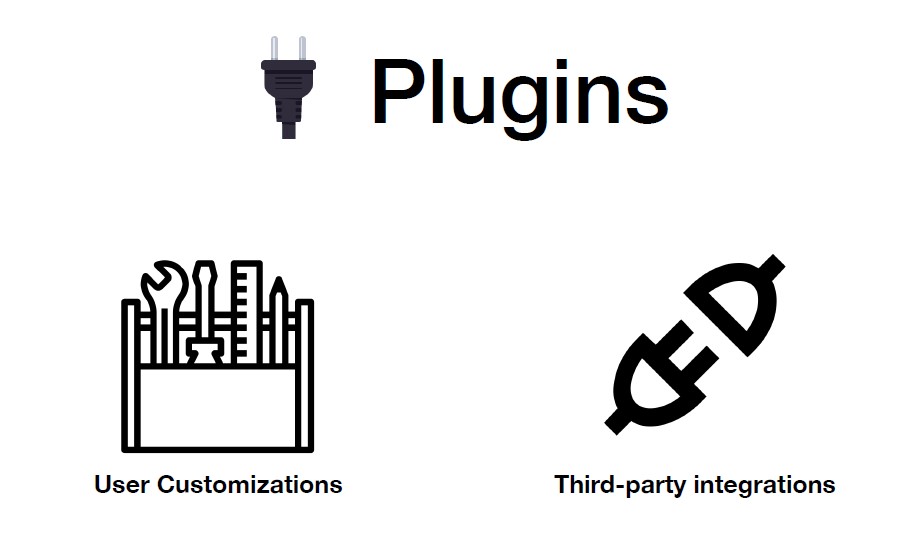
The first way is through user customizations. You have the ability within Selenium IDE and its plugins to enhance the IDE by either adding custom commands, modifying existing commands, adding new locator strategies, and the list goes on. But basically, if Selenium IDE meets your needs but needs customization and tweaking to really fit into your context, there's the option to build a custom plugin to modify the IDE.
Alternatively, there are plugins that enable you to integrate with third party providers. And that's basically it. You could take the IDE and then connect it with a software as a service (SaaS) solution provider and use its service in a fairly turnkey way through plugins.
Plugins work in a fairly straight-forward way.
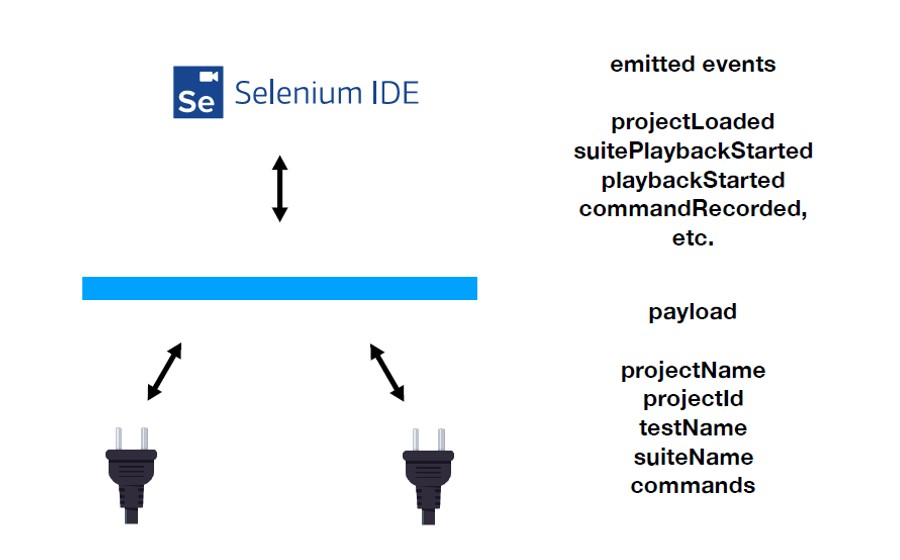
Selenium IDE, what it does when it's being used is it emits a bunch of events. It emits events for when a project is loaded, when a suite has started playback, when a test has started playback, when a command gets recorded and so on. And there's a bunch of them.
Then along with the events there's also a payload that gets emitted, which is all the information having to do with the test via the project that it's part of, its ID, the name of the test, name of the suite, all the commands in it, etc.
And then it's up to plugins to do something with that information or act based upon that information. And it can also send commands to the IDE through the API that's available through plugins, making modifications as needed.
An example of a plugin that I'll show is a third-party integration through Applitools Eyes to add visual testing to our tests in Selenium IDE.
If you're not familiar with automated visual testing, I encourage you to check out the TAU course from Angie Jones on the topic. I also have a series of blog posts I've written which demonstrate a visual testing and talk through some of the fundamentals of it.
Let's go ahead and step through getting the Eyes extension installed for Selenium IDE.
First, we'll go to the Chrome web store and if you search for “Applitools” in the Chrome web store, Applitools for Selenium IDE will pop up.
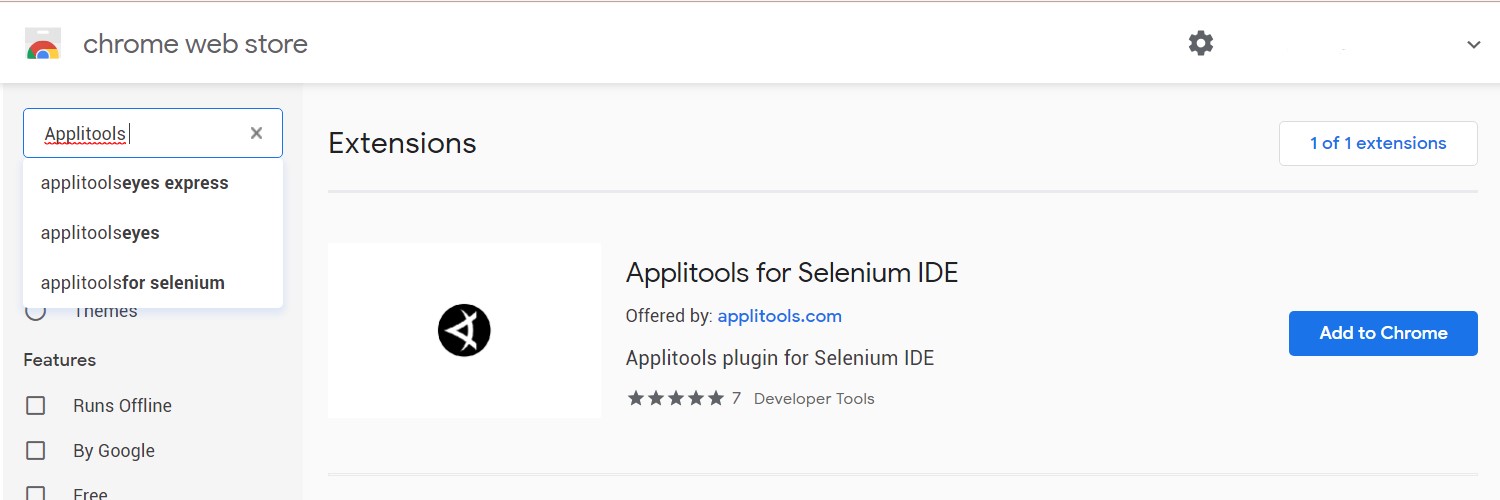
Go ahead and just click “add to Chrome” and then “add extension”.
Once it's done an icon will appear up here next to the icon for Selenium IDE, and then that's it.
And similarly, for Firefox, because the Eyes extension is available there too. In Firefox, go to the add-on store for Mozilla and go search for “Applitools” and you'll see Applitools for Selenium IDE, and the Selenium set up instructions are similar to what I just did for Chrome.
So now we have the Eyes extension installed so let's go ahead and open it.
And when we do, we're prompted for two pieces of information — the API key and the server URL. And there's already a default specified for the server URL, and we'll just go ahead and leave it as is for now.
So, we need an API key and for that we need an account with Applitools Eyes. And assuming that you do, then getting the API key is really straightforward. You just go to your account page, click the top right-hand corner, click “My API Key”, and then copy the information and then go ahead, go back to the extension, paste it in and click “apply”.
And once it's done, you'll see a configuration window.
So, for all intents and purposes we're done with set up right now. There's some customization that we'll do here in just a little bit, but I want to go ahead and demonstrate adding check window commands to our tests.
Let's hop over to Selenium IDE, and there are a couple of ways that we can add Applitools Eyes commands to our existing tests.
We can either add it as part of recording, and I'll show you that really quick. You click “record” and then click on the Eyes extension icon and then the window changed from a configuration pop up to one that has all of the available commands.
Alternatively, you can just come in and type them out by hand.
All of the commands are prefixed with the word “eyes”, so — eyes check window, eyes check element — and there's really two commands that we're going to focus on.
There's
eyes check window. And what that does is it takes an image of the entire page every time whenever we call it and uses that image to check to make sure that there's no visual anomalies on the page.And also, we're going to look at the
eyes set viewport sizecommand. And this will be useful to ensure that we have a consistent viewport size every time we run the test to make sure that we have effectively the same image, or at least the same parameters, that created the initial image when testing.
What we'll first start with is adding check window.
You can come into the reference tab just like with any other command and with it it'll have all the information. And so check window takes an optional name, which is just a semantic name. So, this is going to be used to test that we have successfully logged in.
Command: eyes check window
Target: Logged In
And actually, what we want to do is put this with the assertion, which is in our other tests and this is the reuse test case.
I'm going to go ahead and cut this, and then paste it into one of the test cases.
So, we'll do the valid credentials. Since we are successfully logging in and we assert that we did log in, we want to paste the command here and make sure that we were successfully logged in.
And so also, we want to do one more thing.
We need this where we specify that the eyes set viewport size has to be after we visit the page.
And actually, in Selenium IDE, when the test was recorded, it recorded a set window size command.
And there's a distinct difference between set window size and set viewport size.
Set window size will always resize the entire browser window to this resolution, but the viewport size within that window may differ depending on a number of things — how the toolbars are configured, how your menus are arranged, etc. — those kinds of things can influence the viewport size.
And so, to get a consistent viewport size, there's actually an Eyes command as I mentioned for eyes set viewport size, and we can specify the same value.
Command: eyes set viewport size
Target: 1260x1027
Actually, what's going to happen is this value might be a little too big because the viewport size is less than the browser window size. And so, if the viewport size exceeds this boundary, the Eyes extension will tell us, and I'll show you that.
Let's go ahead and run the test and see what happens.
We should actually get something in the log here saying that as requested we couldn't make the provided value for set viewport size work and it provided a value that will work instead, which we can copy and paste and then go and modify our test to use that instead.
Command: eyes set viewport size
Target: 1260x948
Now we can go ahead and run this test.
The eyes check window command is taking a snapshot of the page, uploading it to Applitools Eyes and then giving us a link to the job with the results and then opening that page as well.
Then we can come in here and see that the test ran, and test passed. Now we have a baseline image of the page for this specific part of the application that will be used as a baseline for future test runs.
So that's just the simple basics of eyes check window.
As I mentioned, there are other commands like the eyes check element command if we want to detect just in a specific element on the page.
And then there are some other commands which I'm not going to go into but if you wanted to dig into what each of these commands are and some additional nuance to the extension, then feel free to visit its documentationlink at the bottom of this lesson.
Also, I mentioned that I was going to demo the configuration options in here at some point.
What you can do is specify execution on what's called the visual grid.
What's really interesting about this is you have the option to specify different browser and operating system combinations, and viewport sizes, as well as different devices and their orientations.
So, say we want to render a page on these different iPhones, and we want to do it in portrait and landscape. And we also don’t just want Chrome 1920 x 1080, but also these other resolutions.
We can go ahead and run the test again, and this time it will run, it will capture everything and beam it up — just once it's going to run — and then in the rendering grid, all of these different combinations will be rendered and visual checks will be performed against all of those rendered combinations that were specified.
And then the results will be given to us in one batch. And it happens just this quickly. I did not speed up the video.
And so here we have all of these different combinations and if there were a visual anomaly, you'd be able to dig in and actually see a failure and dig into what was the root cause of it.
In fact, let's go ahead and update our test to force a failure to demonstrate what that would look like in the Eyes test dashboard.
First, we'll want to go ahead and disable “execution on the visual grid” since we need execution to happen locally in the browser.
Then we'll hop over to our test and let's set a breakpoint on the eyes check window command so that the test will pause right before this command gets executed. That way we can modify the page and then resume execution and then the eyes check window will happen.
So, let's go ahead and run this. And now we can go ahead and modify this to change the color of the notification to red. And then we'll go ahead and resume our test.
And now a difference was found in the visual test and we can go ahead and open up the page and then we can actually not only highlight where the differences were found, but also we can look into what's called root cause analysis to highlight parts of the page that were changed.
So, we can select the parts of the page, the elements specifically that changed, that we care about, and then it will highlight what was changed about it in the markup to spot what exactly the root cause of the problem is in the visual anomaly.
And so that's it, that's a quick overview of plugins and an example of using a third-party plugin integration through Applitools Eyes.
