Transcripted Summary
In this lesson we'll look at various tools and techniques for performance testing on client applications, and websites. We'll start by looking at some tools that you can use in your browser to test both regular and mobile websites.
When we're using these tools, we want to look for:
1. When the page is visible?
When will the user know that something is actually happening on the web page?
2. When is the page itself usable?
When can somebody start entering things into a form? Things like that.
3. How are resources being handled?
Is there a large quantity of images? Or, are there very large images, or scripts that need to be downloaded?
4. How much scripting is there?
Are there a lot of different scripts going on? Are they blocking the main thread, so that the page is not usable while the scripts are running? Are there bugs in the scripts that are perhaps making them slower than they should be? These are all things to look at.
5. Is the network usage being optimized?
Is the site using a content delivery network so that the images are being sourced from a location that's closest to the client? And, if resources aren't immediately available, is the webpage able to handle that situation? Or, is it blocked? Another aspect of network usage is how many background requests are being made. This can include getting resources, API requests, any of that sort of thing.
Now, let's open a browser, and check out some of these tools.
Chrome Developer Tools
When you're working with the Chrome Developer Tools, you want to start with an incognito window. This is so any ad blockers, or any other extensions you have on your regular browser don't interfere with the default workings of the website under test.
In order to get to the developer tools:
You can use the three-dot menu here (in the top right corner), and go to More Tools > Developer Tools; or
View > Developer > Developer Tools
So, two ways to get to the menu.
There's a lot of tabs, but we want the “Performance” tab.
To start with we're going to look at a website that actually is quite speedy, which is etsy.com. So that looked like it loaded pretty fast, but we can run an actual monitoring test by hitting the reload button here, and it's doing its thing.
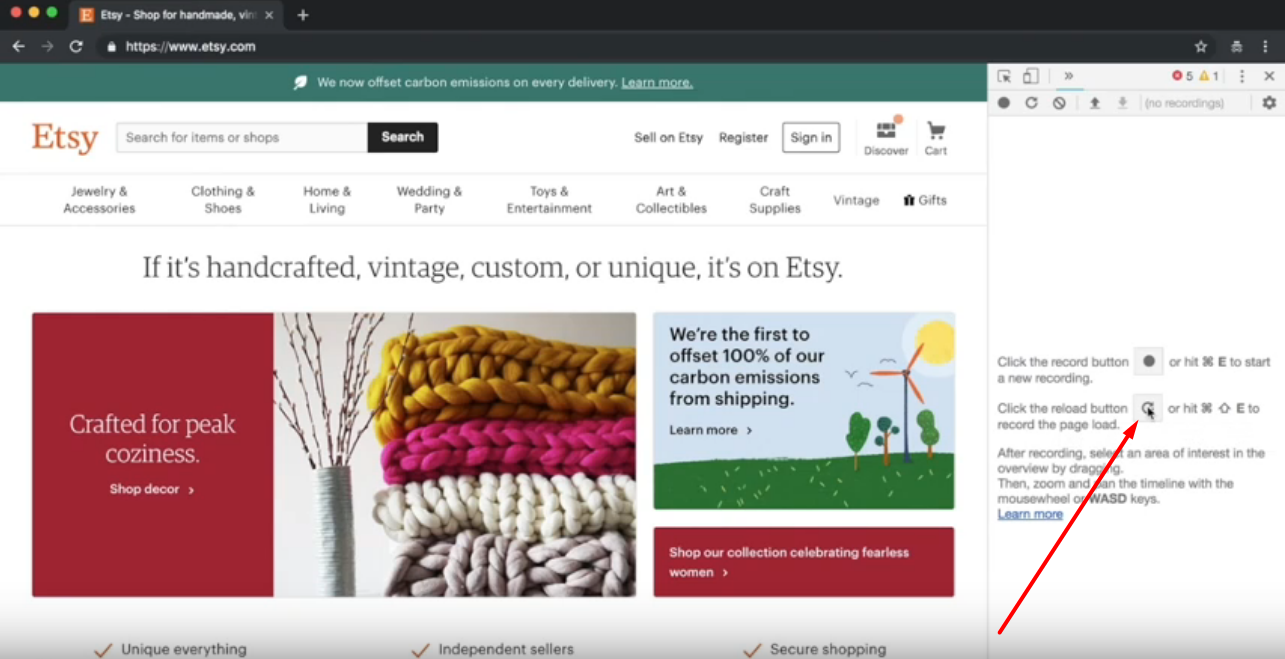
Now, it's done and, we have a wealth of data to look at. In order to get a better look, I'm going to go ahead, and make this window bigger, make it all the way big. All right. The things to look at is, you have sort of a general timeline of what's going on here, and you can see little frames.
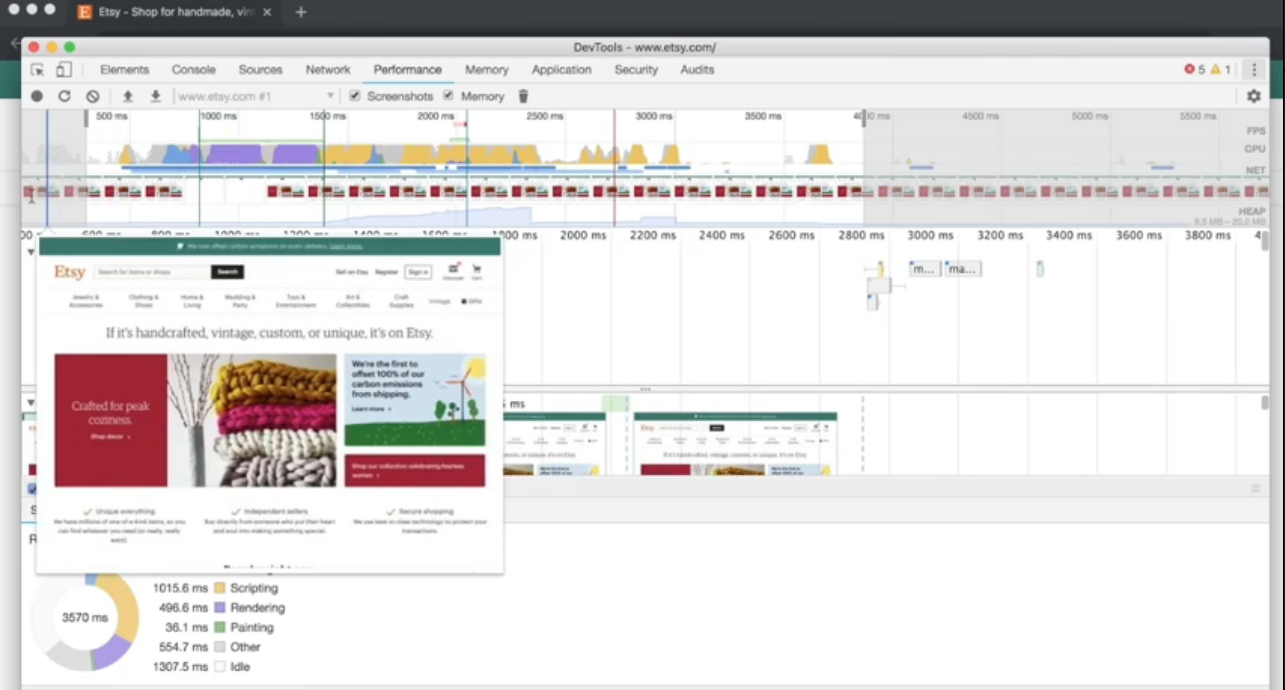
This is where I first hit the refresh button, and then, it was cleared, at this point, and then, it sort of was rebuilding the site again.
We can look here under the Network.
This is where it's loading the main etsy.com page, and there are lines here that show you the interesting events, and if you go to Timings, this timings thing we see this FCP, FMP, DCL and L. These are the terms that Google is using to decide it's benchmarking.
The First Contentful Paint is when the page first looks like something happens, so we can see, and it's cleared, and this is the first this, is the FCP point where there's a bar, and it says Etsy, so the person that's loading the website knows that something is happening.
We can look at, we can actually make this area smaller. You can see the entire load took about three and a half seconds. Most of that being spent scripting, but we can look at just this first part of the whole process.
First, against this website, and then, it's getting all the CSS, and various other static pictures. You can actually click on this and see what it is. It's a picture of yarn. This is really handy to see if you see a picture that's particularly slow. You can click on it and see what it is.
This is the CSS, and more pictures. This is what's happening there. You can see the frames. There's nothing, nothing, and then, here's the First Contentful Paint right here, like we talked about just the Etsy frame, and then, you can move the timing back, and forth.
At this point, it starts rendering a lot of pictures. This is where we get the first, so started here where we have the blank page, and then, at this point we're getting to the timings, the FMP, First Meaningful Paint. This is where the page is going to look complete, and you can see that it looks pretty complete, and you can start looking for stuff at this point.
You could sign in, you could search for terms. There might still be other resources that needs to be loaded, but at this point, as far as the viewer is concerned, the website is ready to go. This is a very important point in the process, and in order to get there it took about, you can look on the main page.
At this point, it's mostly just rendering the pictures onto the screen, and we can see all the other stuff that's happening here. Not a whole lot of extra frames. This is a very fast site.
Then the next part is this Domain Content Loaded, that's when the entire document model has been loaded into the browser, and then, once everything is finally rendered onto the screen, we get the Onload Event. Right here, onload.
And, at that point the website is basically complete. There's a whole bunch of information here, and you can spend a lot of time, hours and hours going through it, but maybe you don't want to do quite that much work.
We have this Audits tab, which is actually really helpful.
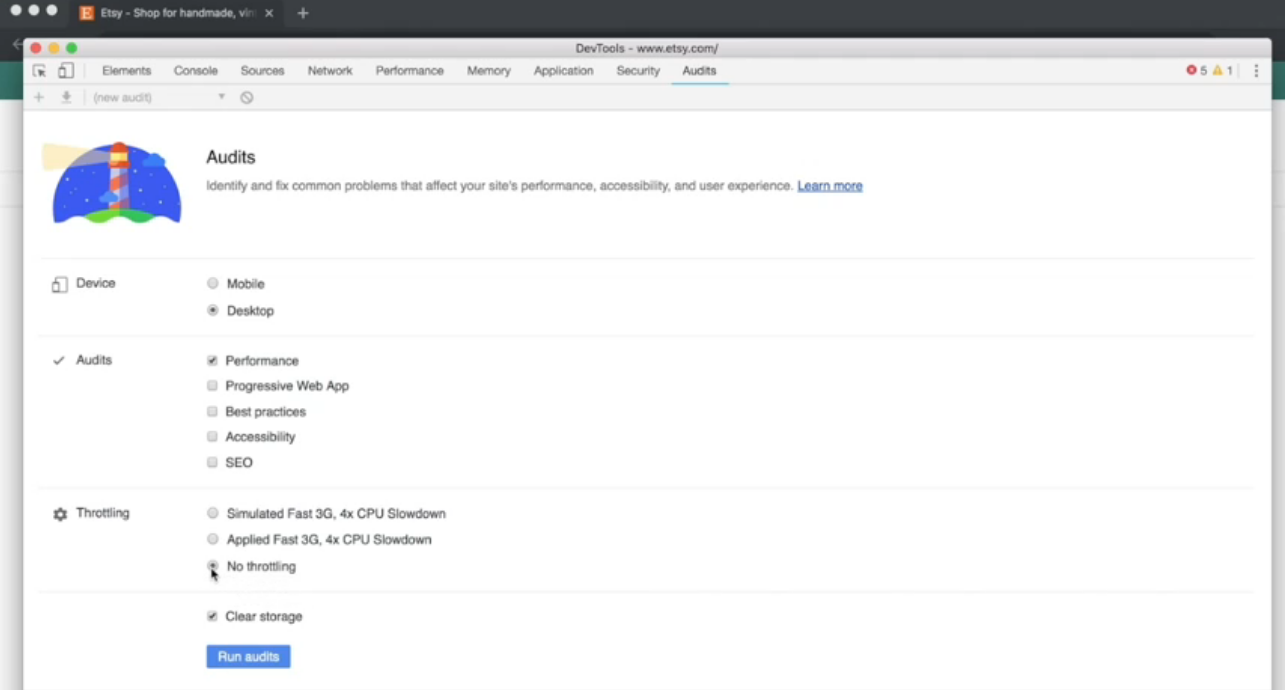
Let's do desktop, and we're just going to uncheck everything except “Performance”, and let's run some audits.
We'll do it with just the regular WiFi here, so we run some audits, and it's going to do it again, except this time the auditor is going to tell us what's going right, and what's potentially going wrong with the website. It's almost done.
This is, as you can see has a very high score 98.
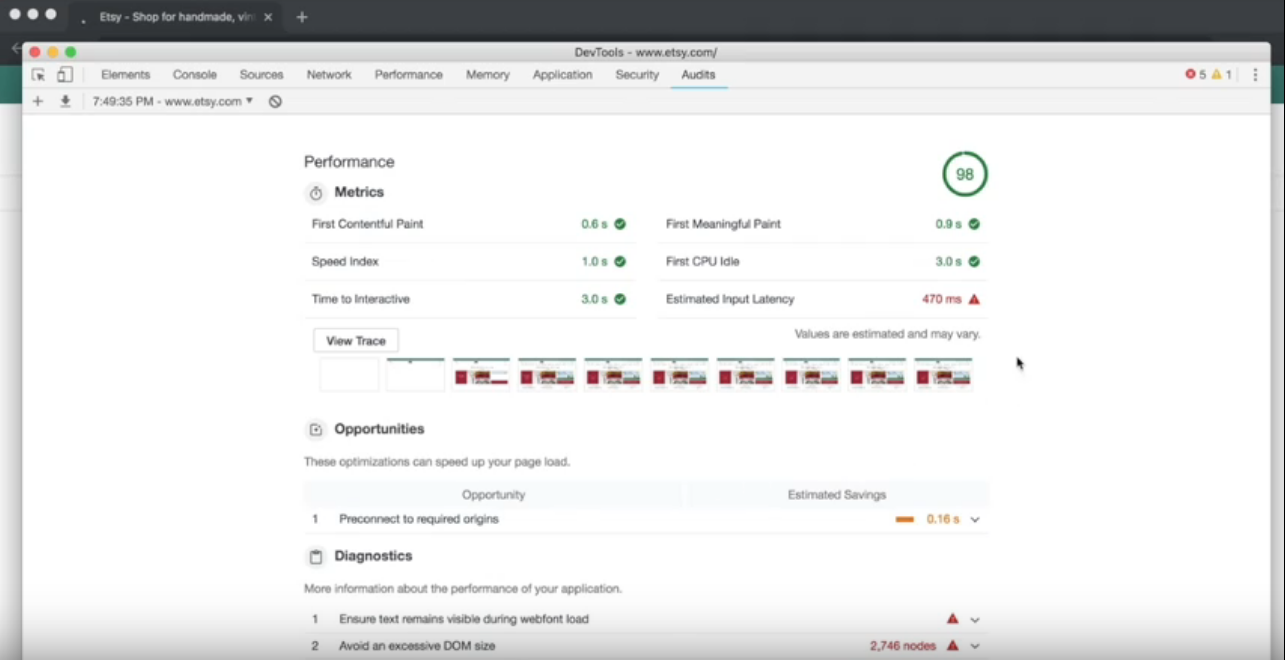
And there's proper opportunity, if there was some kind of pre-fetch, this is where the client makes sort of an initial handshake at the server, so that it can make the connection faster. We could have potentially saved a little bit of time there.
There was some diagnostics, there's a lot of nodes in the website, lots of scripts within scripts, or pictures within pictures. That is pretty common for modern websites I'm going to say. Some of the smaller pictures aren't cached, but these are so small that it really doesn't seem to make a difference in the overall website.
That is a basic look at the Performance tab, and also the Audits, which is really helpful.
The next site I want to look at is lingscars.com, which is basically the opposite of the Etsy website.
This is a car leasing site, based out of the UK, and I frankly love this site. It is bananas. It has so much stuff going on.
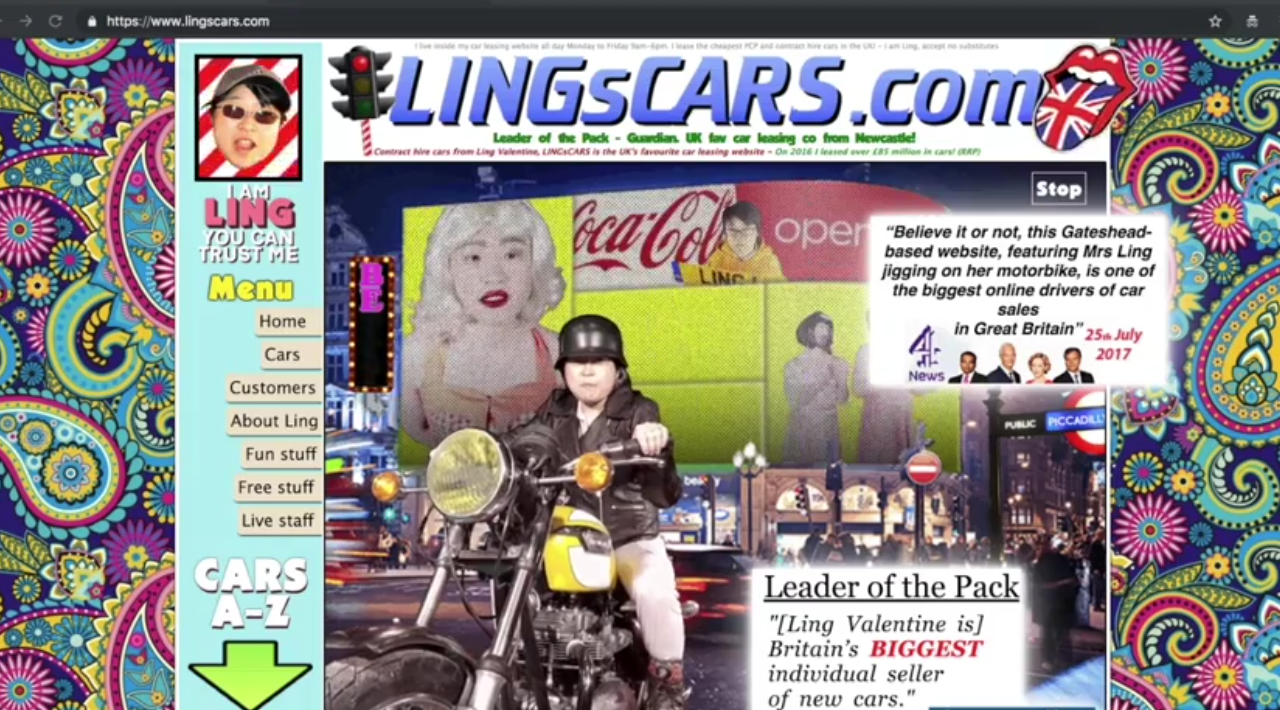
It's the personal creation of Ling, and she's added the personal touch everywhere. But it's not a particularly well performing website for people that aren't in the UK, like myself.
And because of that, running the Performance tab in the Chrome Developer Tools is really going to take a long time, and if I want to find out what I can use to improve the site, maybe I want to do something else.
Page Speed Insights
The auditor that was in the tab is also available on its own web page called Page Speed Insights and this is actually running out of Google's Labs, and it will run the test on its own machines. It's a more consistent test than something that's subject to the vagaries of your own wireless network.
Let's go ahead and put in “lingcars” and see what Page Speed Insights comes up with.
Okay, the test is done, and it actually is not as terrible as we might have thought. I think this is probably based out of the East Coast, out of Virginia, so that's going to make it faster compared to Seattle. Etsy was in 98, and this is at 56.
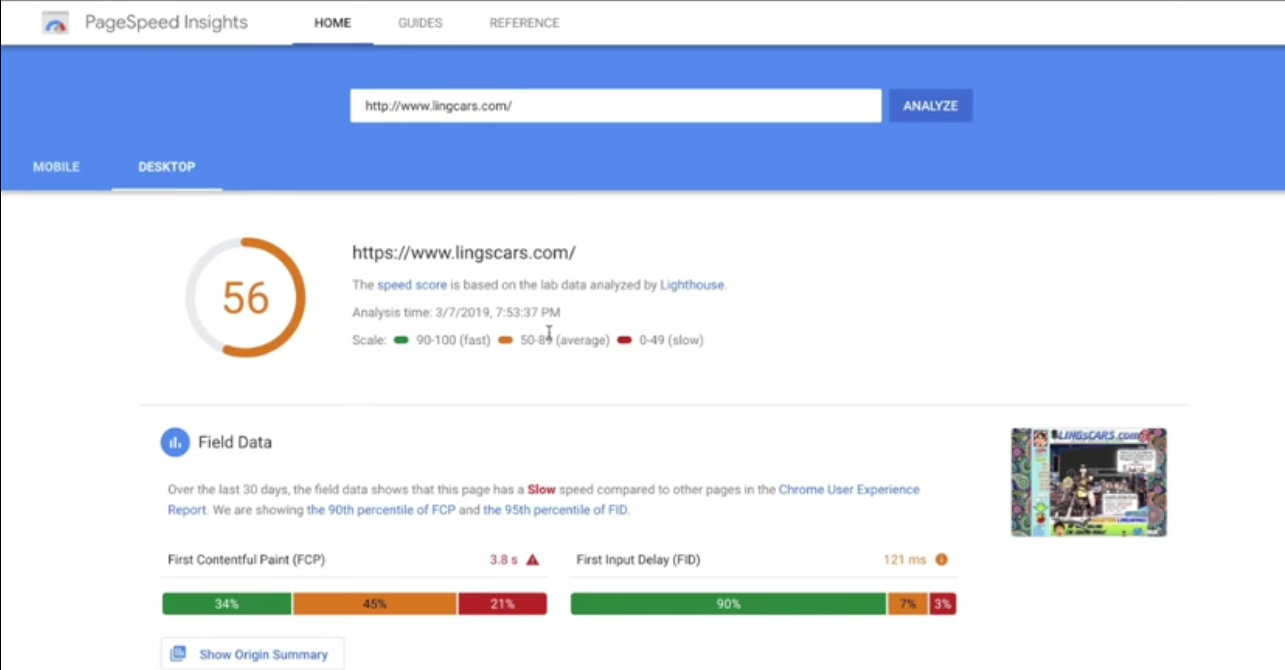
This is the score. The Field Data, this is based on Google is basically collecting the Page Speed for all the times that people are accessing the website.
You can see that it's not so bad, and this I think, is because it's a very local business, and most of the people that are accessing it are in the UK, so they're not going to have the distance issues that I'm having here in Seattle.
We have the same information here, we have the First Contentful Paint, the First Meaningful Paint. All of these things, and lots of suggestions, which I'm sure Ling will completely ignore, because she has her own aesthetic, and it's working very well for her. But lots of gigantic images coming in, there's a mug that's five megabytes, and all these sorts of things.
This is a great way to look at a website, sort of a more neutral viewpoint than just maybe your own machine to get an idea of what's going on with it.
But, what if we want to say, “Hey, the customers are actually in the UK, so we should be testing it for the UK.”
WebPage Test
There's one final place you can go, and that is WebPageTest, webpagetest.org.
This is an open source site, and there's quite a lot you can do with this. We put in lingscars, and we can select our location. Instead of North America, we could actually select a location in Europe.
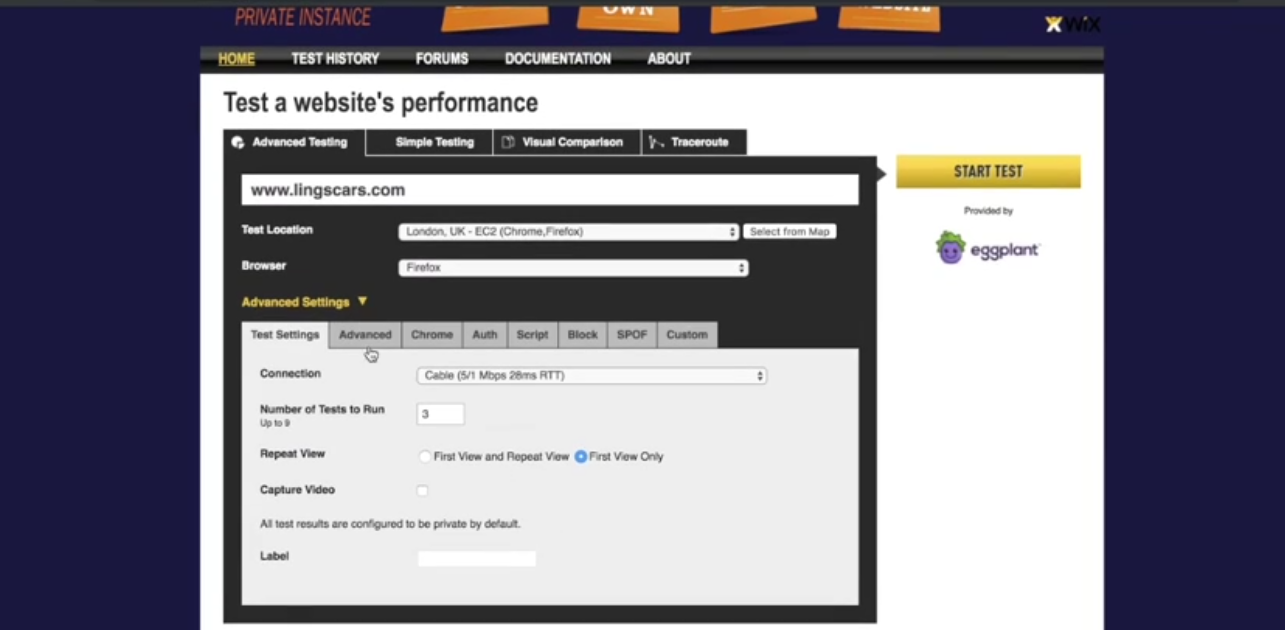
We'll say, London, and we can test it on Chrome, or let's do Firefox for a change since everything has been Chrome. You can test all of these sorts of, we want to do the best possible connection, and the number of tests, and there's a lot of different tabs here.
You can do a very detailed sort of test for a lot of different situations that maybe you wouldn't be able to do just sitting at your desk. This is a free website, and sometimes you have to wait your turn, and, of course, we have to do the captcha. Nothing's free in this world. Now it's testing, we have to wait.
Okay, so the test is finished. It took a few minutes, I think something might actually be going on with the lingcars site, because it wasn't this slow before, but let's take a look at what's going on.
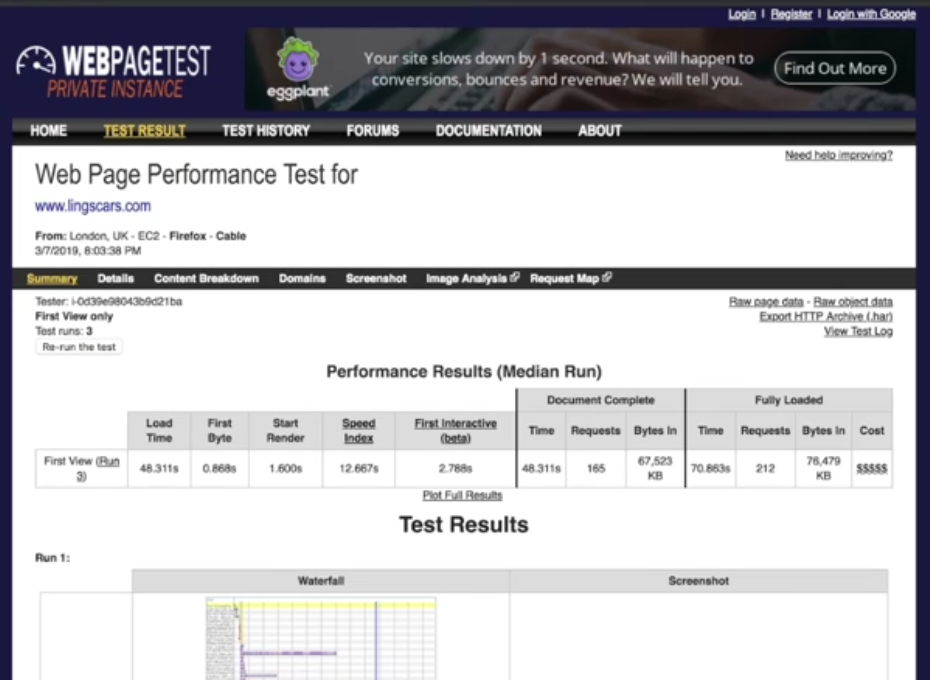
This is similar to what you see with the Chrome Developer Tools. They're using the First Byte as the First Contentful, whatever Google said, I think first byte is a little easier to think, visually complete, and so forth.
54 seconds to be visually complete, and we can see that the problem is some of these giant images are just taking a long time to load. Yeah, so there's just a lot going on, on this site, which makes it an interesting test case.
Let's summarize the tools that we've looked at.
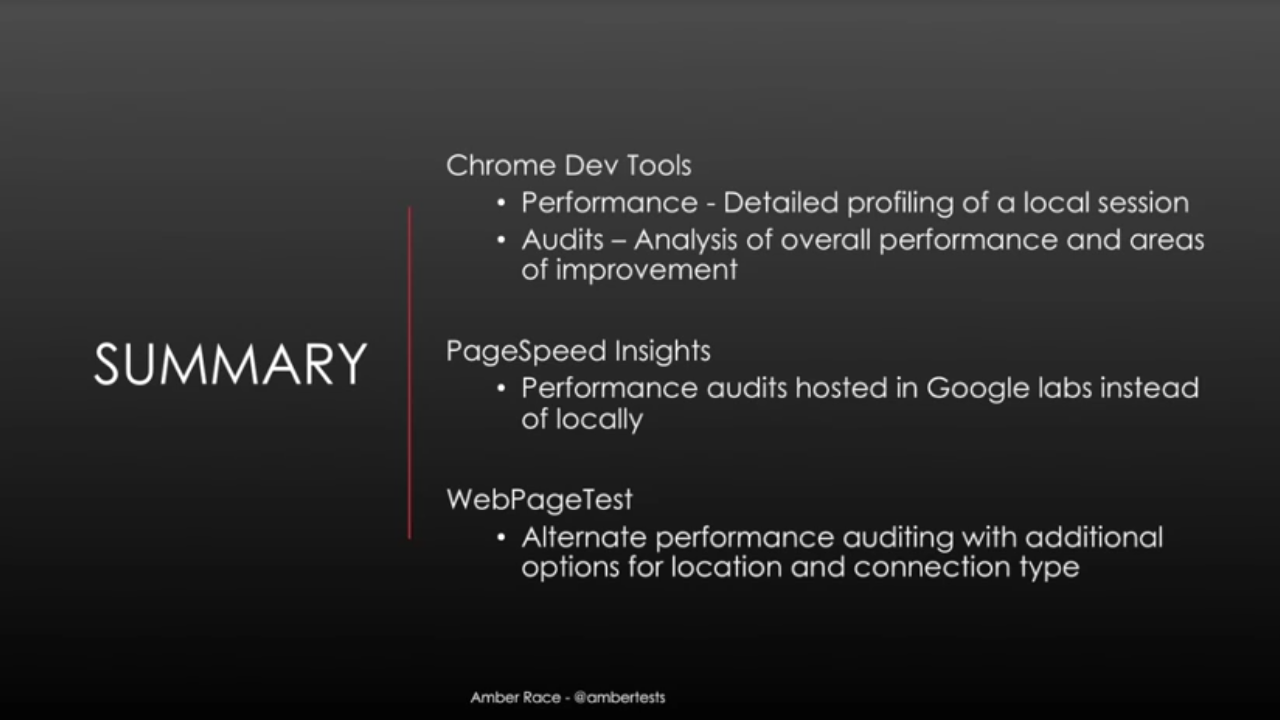
We started with Chrome Developer Tools, which provide a very detailed profile of a local session, and also Audits for analysis of overall performance, and areas of improvement.
Next, we looked at Page Speed Insights, which is essentially the Audit tab on its own web page hosted in Google Labs instead of locally.
And finally, we looked at webpagetest.org, which is an ultimate performance auditing system, has additional options for location, and connection type.
Now let's see how these same tools can be used for testing mobile devices.
