
Transcripted Summary
In this final chapter, we'll go over load testing strategy, how to decide what to test, how to test it and how to present the results.
# Understand the System
The first and most important thing is to understand the system under test.
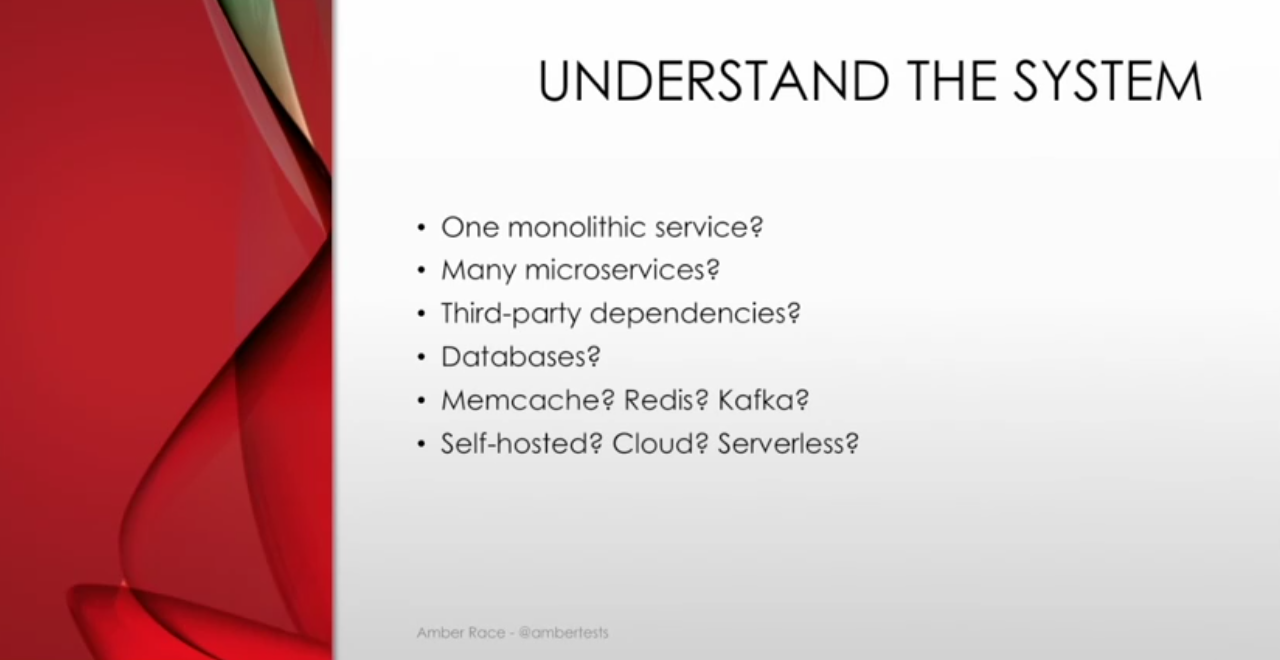
Is it one monolithic service where everything is put together in one place?
Or is it a bunch of microservices talking to each other?
Are there third-party dependencies maybe to an authentication service or a store or lots of other things that could potentially cause slowdowns in your own service?
Are there databases that you need to worry about and having the right number of connections to the database and caching the data?
As far as caching solutions, are you using Redis, Kafka? Lots of options there that you need to know about.
Are you hosting the service in-house or is it out in the cloud or maybe it's even serverless?
All of these are going to affect how you load test your system.
# What to Look For
Once you understand the system, you need to figure out where to pinpoint your tests.
What are the APIs that are used the most?
What are the APIs that take up the most energy or memory or time in your system and what APIs are the most critical?
Which are the ones that you really can't afford to have go down?
If you want more information about how you can dig out the APIs that your client is using, I highly recommend my other course with Test Automation U, Exploring Service APIs Through Test Automation.
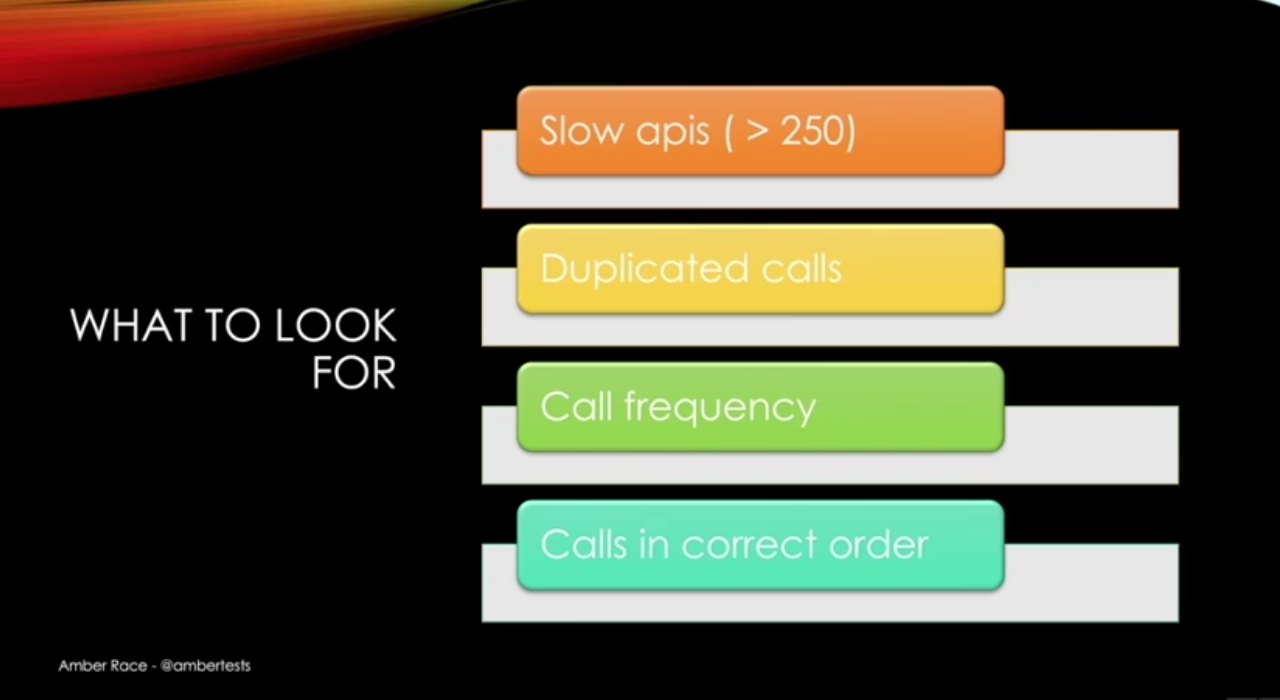
So, when you're looking at APIs, you want to look for APIs that are slow, like more than 250 milliseconds.
You want to make sure there's no duplicated calls. These are very easy wins as far as performance and load testing go. If you are making redundant calls, you take them out. Everything is better.
Call frequency is important, and also if the calls are in the correct order.
So, these are the things you can look at right away to maybe get some quick wins on both client performance and server load.
If your service is already running in production, and if you have monitoring set up either yourself or maybe the ops team, observing what's happening in production is the best way to determine how your applications and services are really being used, and that will allow you to construct the most realistic tests.
# What kinds of tests are there?
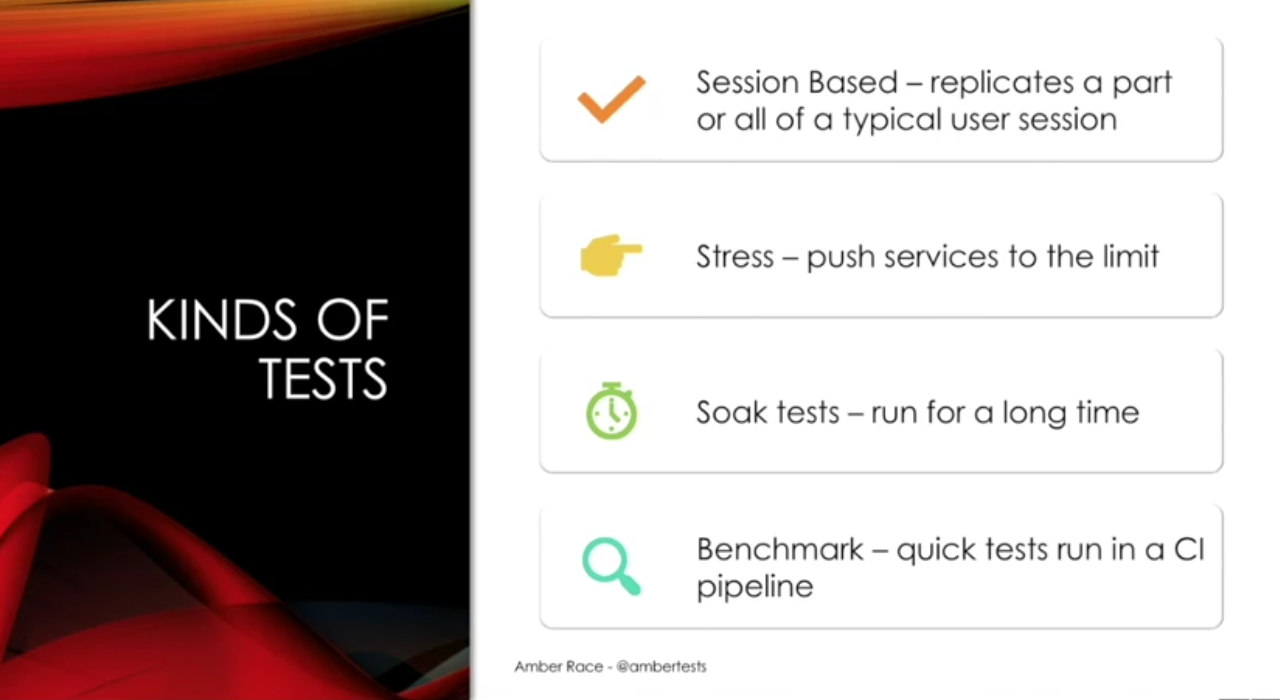
You can have a session-based test, which tries to replicate the actions of an actual user. For example, the user logs in. The user clicks this page and calls that API, et cetera, et cetera.
You could do a stress test where you're trying to push the very limit of a service. This might just be on a single API endpoint, so maybe the authentication service. You see how much you can possibly push it until it no longer is working properly.
There are soak tests where you just run the test for a long time. This is especially important for data-centric APIs where perhaps you're saving data or retrieving data because the more data you have, the more likely it is that performance issues will show up in your load tests.
And finally, a benchmark test. This would just be a quick run that you could put in a continuous integration pipeline.
The important thing to keep in mind with all of these tests is that load issues in a service show as performance failures.
So, this is again the intertwining of performance and load testing. When you're doing a load test, what you're really looking for is a performance failure on the server.
# Calculating Load
Once you've decided what you're going to test, you need to decide_ how much _load you need to make your test work the way you want it to. What is the load that's going to give you confidence that when you release to production, your server will be ready to go?
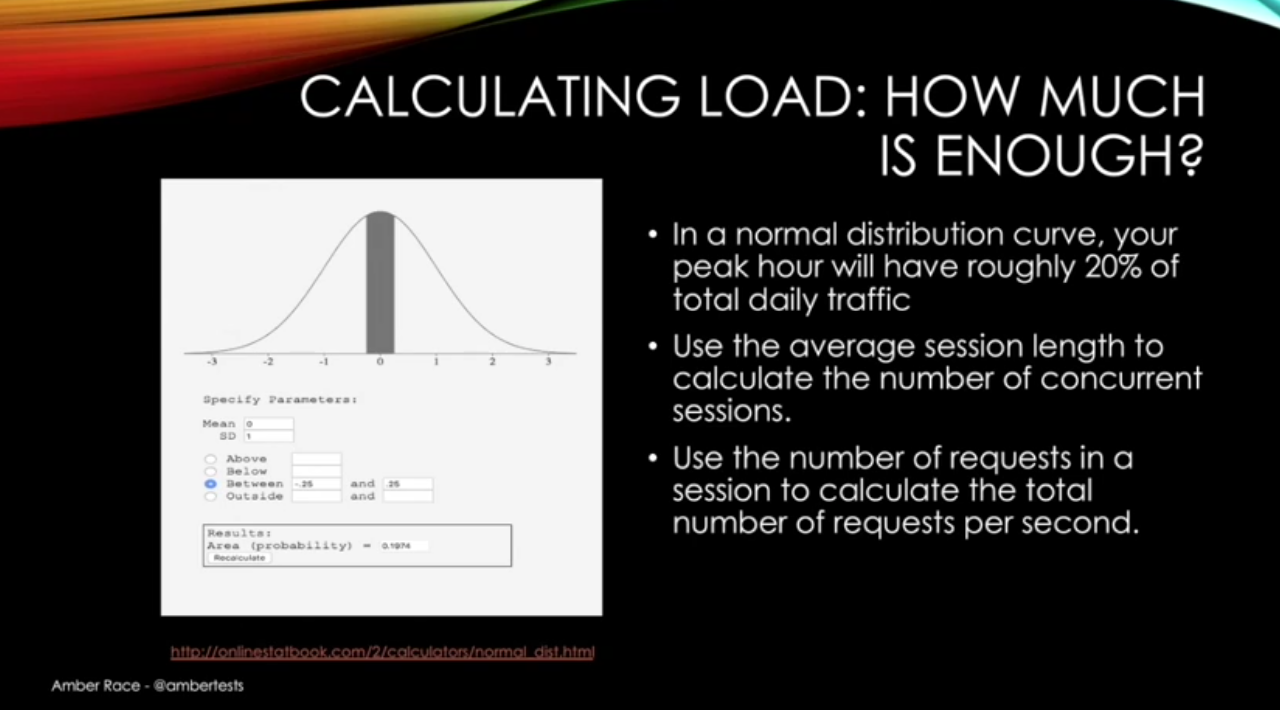
The thing about performance and load testing, and load testing especially, is that it involves a lot of math and statistics. Well, not a lot of math, but some basic math and statistics. This can be very useful for determining how much load you need.
If you have a normal distribution curve right here, the peak hour will have 20% of the daily traffic roughly.
So, using that 20% and knowing the average session length, you can calculate how many sessions are going to be happening at the same time. When you know how many sessions are happening at the same time and the kind of requests that are in its session, then you can get that down to how many requests per second.
I have an example here, and as I said, this will be available as a resource, this spreadsheet.
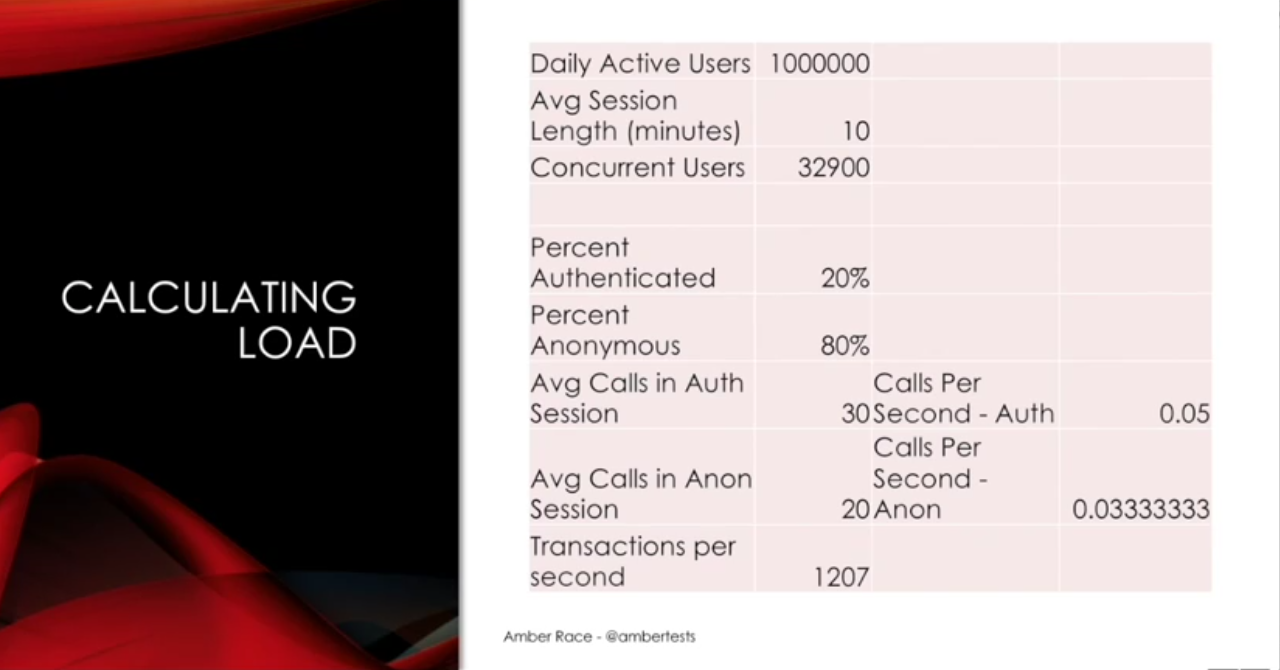
If my daily goal is a million active users, and each user has an average session length of about 10 minutes, that means at the peak, I'll have 32,900 concurrent users.
When I break down the kinds of sessions they're doing, how many calls are in the session and what that turns out to be per second, basically it comes out to 1,207 requests per second. So, then you always want to round up. So, if I can get 1,300 requests a second, 1,400 requests a second, then I can be confident that if we have a million daily active users, we will be able to handle that load.
# Cloud Considerations
If you're running your service in the cloud, there's extra things that you want to keep in mind for your testing.
**Location. **For example, is your cloud instance happening on the East Coast of the United States, the West Coast of the United States, Europe, all of those places? How close is it to where your users actually are? Because that's going to make a big in how your users are experiencing the server performance.
What is the** VM type **that you're using for your service? This is another thing that you can test with your load testing. Can you reach the load you want using micros, or do you need to have a larger machine?
And then **scaling. **People like to use the cloud because they think it's auto-scaling, but you want to make sure it's really auto-scaling.
So, doing a high load test in the cloud before you release to the public can give you confidence.
# Serverless Considerations
If you're using serverless, there's yet more things to keep in mind. The most important thing is that serverless really is servers. It's just somebody else's server, and you're paying for the amount of time you're using that server.
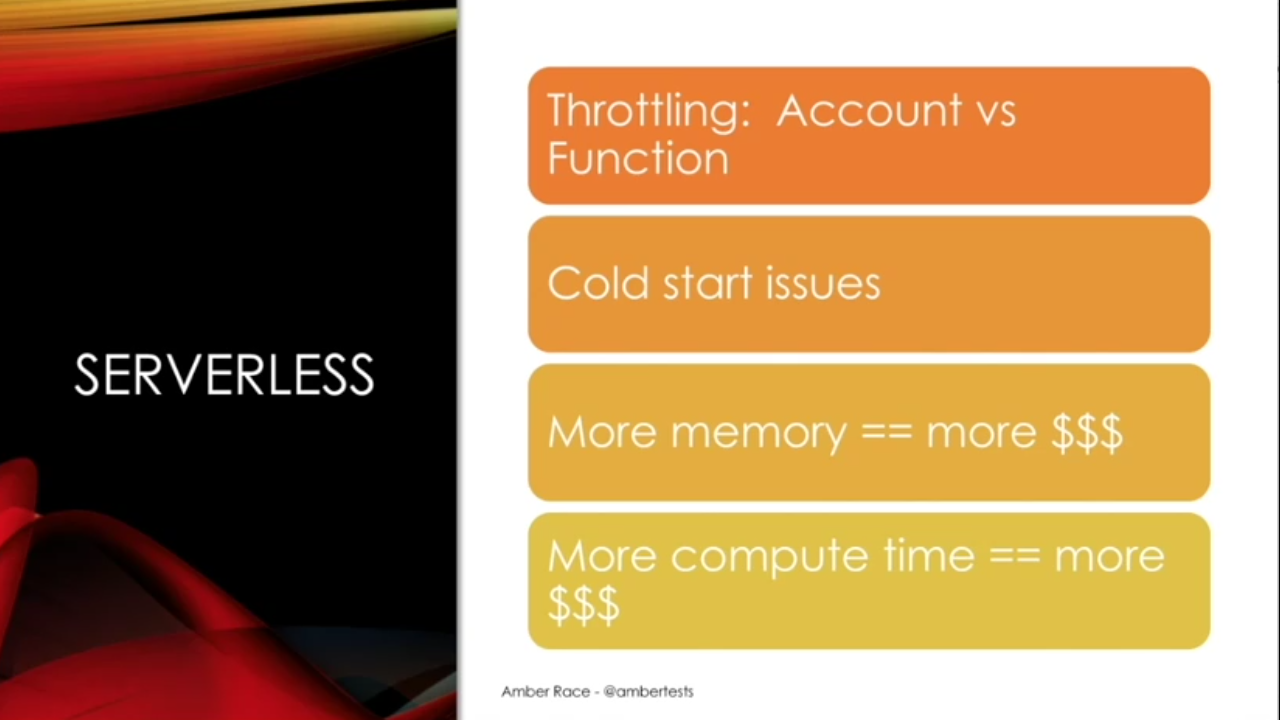
So, because people are paying for the amount of time they're using a function, sometimes those functions will be throttled so that during development, you don't end up spending too much money. But if those throttles remain in place when you go to production, that can be a problem.
Another thing is cold start issues. Serverless functions are meant to be run on a continuous basis. If there's a long gap between when a function is called, the VM will shut down, and it will need to be restarted again. So that's another thing to analyze.
And of course, the more memory you're using, the more money you have to spend. The more compute time, the more money you have to spend.
So, the typical solutions to increasing performance, like adding memory. Those are going to actually cost money. Now, it might still work out, but it's something that you need to keep in mind for your testing.
# Running Tests in Production
If what you're testing is a service that's already running in production, if you're adding functionality to something that already exists, I highly, highly recommend that you run load tests in production because then you're using the actual production hardware.
The actual production base load of all the activity that's already happening is there. If you have monitoring in place, you can monitor and make sure that you can shut down the test if things are starting to get wonky. Just be sure to tell your ops team once you're doing.
But don't be afraid to run a load test in production as long as it's short term and everybody is informed.
# Interpreting Results
Once you run your test, you're going to get a lot of results, and being able to interpret those results and communicate the issues to your team or to management is really key to having a successful load testing strategy.
You want to have multiple metrics so you get a clear idea of the behavior. Then when you're using the metrics, when you're looking at a chart, you need to be aware of coordinated omission problems, which basically means when you are using an aggregate value, it flattens out the actual values. So, if you have an aggregate, you could be missing outliers that are above the mean or average.
Finally, you need to be clear about whether you're most concerned about peak performance or higher load.
You could have a service where everything — the database, the cache, and the service — are all co-located on the very same machine, and that's going to be extremely speedy when you have a small load. But if you have a higher load, it's going to fall over more quickly. So, this is where you need to balance the speed versus being able to handle a higher load.
JMeter Report – Coordinated Omission
So, to demonstrate what I mean by the coordinated omission, I have our JMeter test backup here, and this is the responses, times over time. I have sampled every 10 seconds out of the results. So this chart is showing every 10 seconds, and it is getting worse, but it looks pretty smooth here.
But what happens if I change this? What if instead of every 10 seconds, I decide I'm going to do every second? So, let's clear that and reload it.
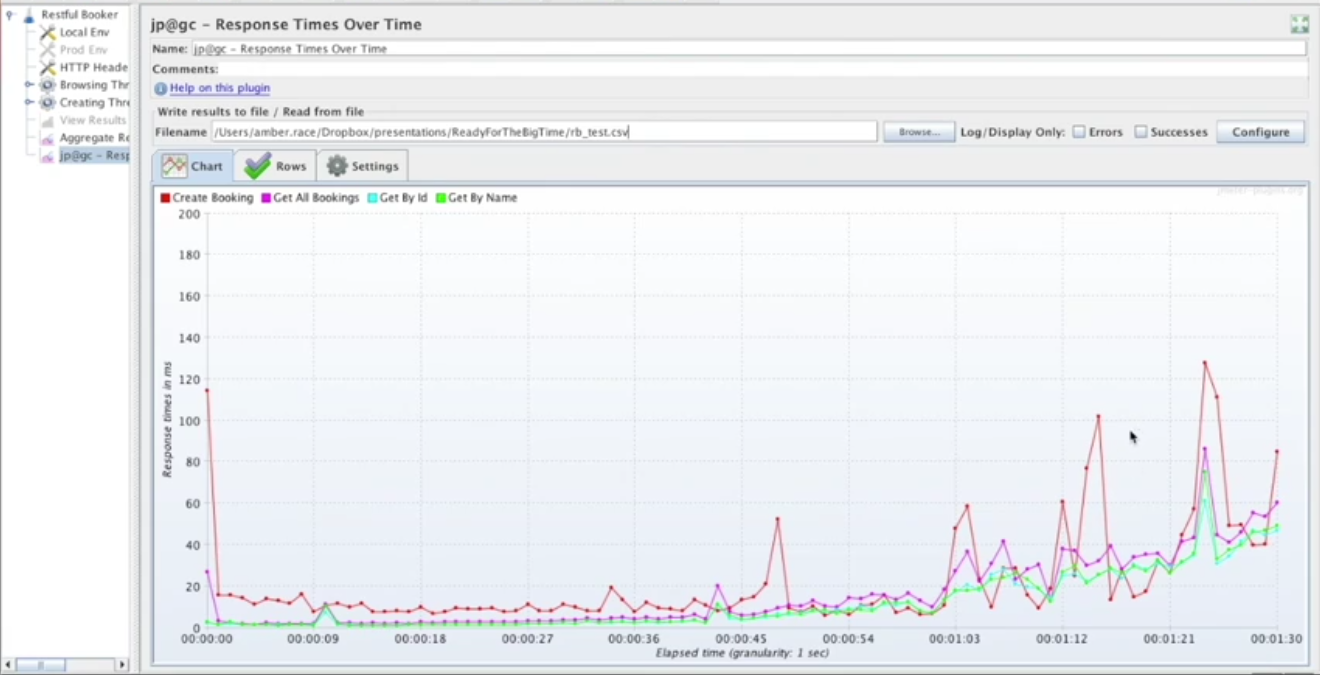
Now, we have a more interesting picture. All of these peaks were missing in the previous. But now that we're looking at every second, we see even more of them.
If we change this to 100 milliseconds, it's even more obvious that there's a lot going on.
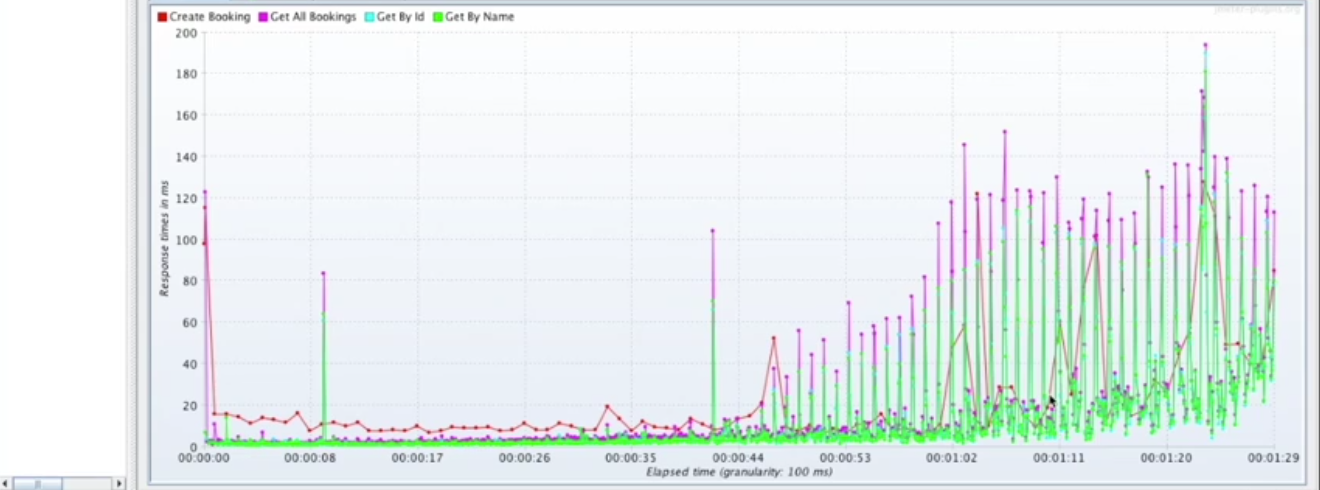
All of this is happening. We couldn't even see it when we had the 10-second intervals. So, this is what coordinated omission is. When you're looking at a graph, make sure that you are getting all the important information and not just having it smoothed over by having your aggregates be too large.
Gatling Reports
So here I have the Gatling result that we looked at before. This has a lot of very common metrics on here. Just to quickly go over what some of them mean.
This 50th, 75th, 95th percentile.
This is extremely common in any kind of performance chart, and what exactly does it mean?
It means that 50% of all the calls were nine milliseconds in this case, nine milliseconds or less. So, this is essentially the median value is nine, nine milliseconds.
75% of the values were 17 milliseconds or less. So that means by 25%, we're in between 9 and 17, okay.
95th percentile here is 40.
99th percentile is 56.
And then the max is 145.
So, you can see there's actually a pretty big gap here between the 99th percentile and the max, and this is where five nines come in. So, you have 99.9. It's going to be even higher. 99.999 is going to be even higher approaching the max of 145.
If you have a million users, the 99.9% represents 1,000 people. So, it's not a small number of people. If 1,000 people are experiencing your very worst load every second, that could be a considerable impact.
Once again, we have our percentiles, the minimum, the maximum, and the mean.
The mean is an average, where you add up all the values and divide by the number of values. So that means if you have a really high outlier, that's going to affect your mean.
# Wrapping It Up
So that is a quick look at some of the factors involved in crafting a strategy and understanding the results of your test. Performance and load testing is a huge area, with a lot of details, and this is just the very tip of the iceberg when it comes to the information that's available about performance and load testing.
I want to leave you with just a few simple things to remember.
First of all, for both the client and server, it's really important to test performance early and often. Get on top of any problems before it's too late to fix them.
On the client's side, making sure that your client is adaptable to varying network and server conditions is going to go a long way towards ensuring that your customers and the people on your website have a smooth experience.
On your services, the key is to find the performance limits and either expand them or make sure you can work within them.
Once you do that, you can be confident that your application will be ready for the masses.
So, I hope you enjoyed this course, and if you have any questions, you're free to contact me.

You can email me. or reach out on Twitter, or on the Test Automation U Slack.
Thank you to Applitools and Test Automation U for hosting me, and happy testing.
