

Transcripted Summary
In this lesson, we'll look at the tools we used before and see how we can use them to test mobile clients. We'll also look at some additional tools for testing on mobile.
We've looked at how these browser-based tools can help with profiling the performance of regular websites, but what about on a mobile device? There's extra considerations there.
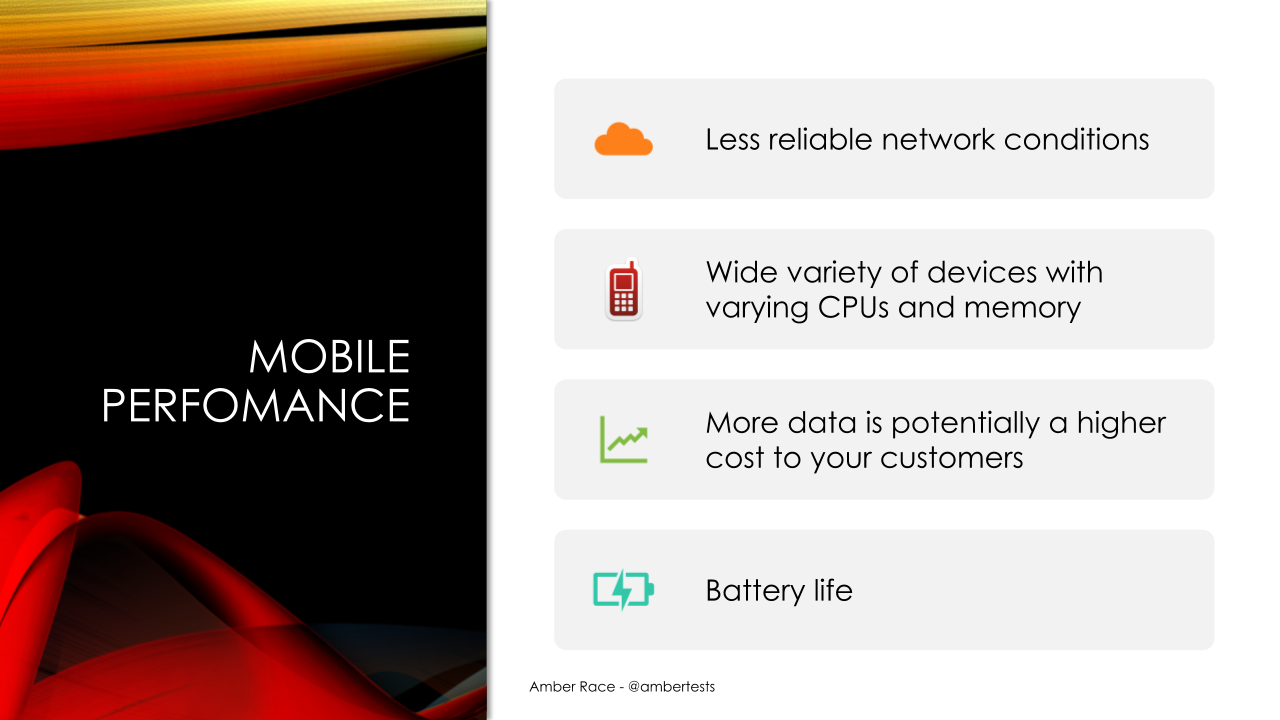
First of all, the network conditions are even less reliable than with regular Wi-Fi and you have a variety of CPUs and memory and whether it's Android or iOS. There's a lot of different performance variables within the devices themselves.
Also, the more data you're downloading, your customers might actually be paying for that data. So, you have to be more cognizant of the quantity of images and scripts, etc, that you're downloading to each customer's device.
Finally, the battery life is very important. If you have very complicated images that are rendering, that costs a lot of battery for the devices.
Chrome Developer Tools - Mobile
If we come back over here to the browser and we open our tools again ... More Tools > Developer Tools
So, if we go back to the Performance page, you can see there's a button here and I can actually toggle this into mobile.
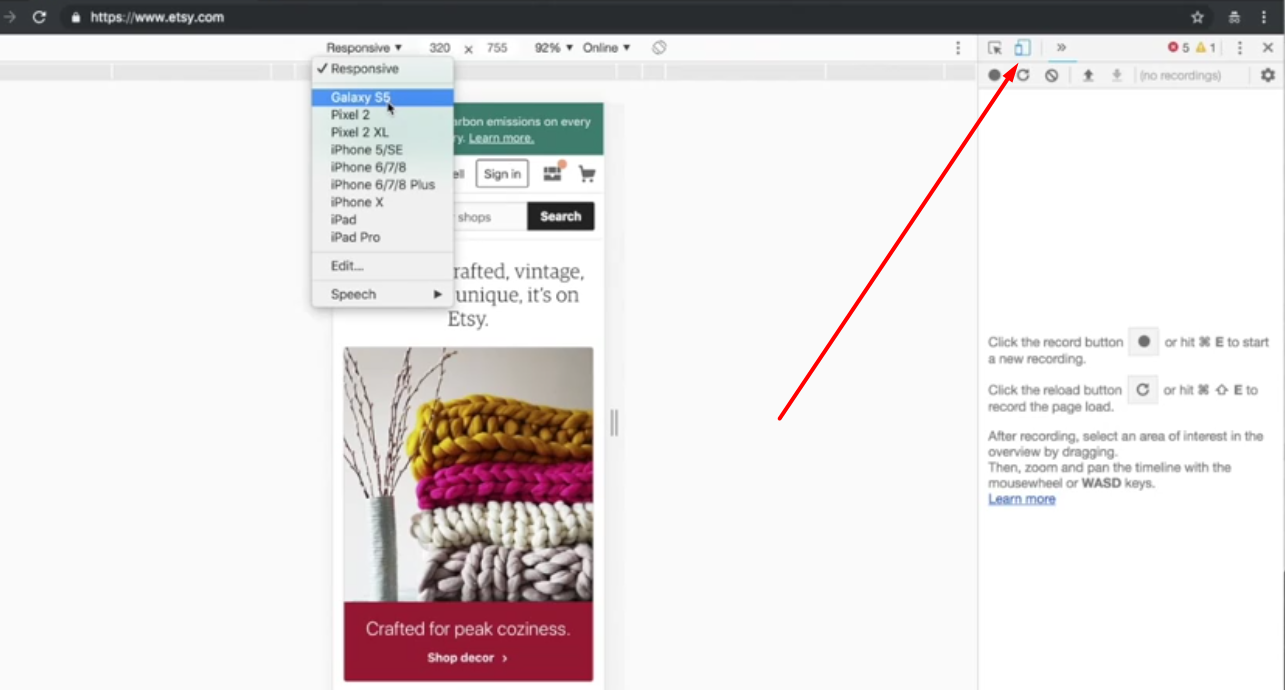
Now, it will emulate a mobile device and I can even choose what kind of device I want to do. Let's say Galaxy S5 and we can choose if it's mid-tier or whatever. So, there's lots of things we can do here.
Now that we're in mobile mode, we can do another audit, this time selecting mobile. Let's see what happens.
We're going to have it be a 3G network instead of the regular network. So, it's running, pretending that it's on the device. Here we go.
We can get the same kind of report that we had for the regular webpage except for the mobile emulation.
Page Speed Insights - Mobile
Page Speed Insights also has a similar feature. In fact, when you run a site, it will automatically do both mobile and desktop. So, we can look at the mobile site for lingscars.com and you can see it's actually quite different.
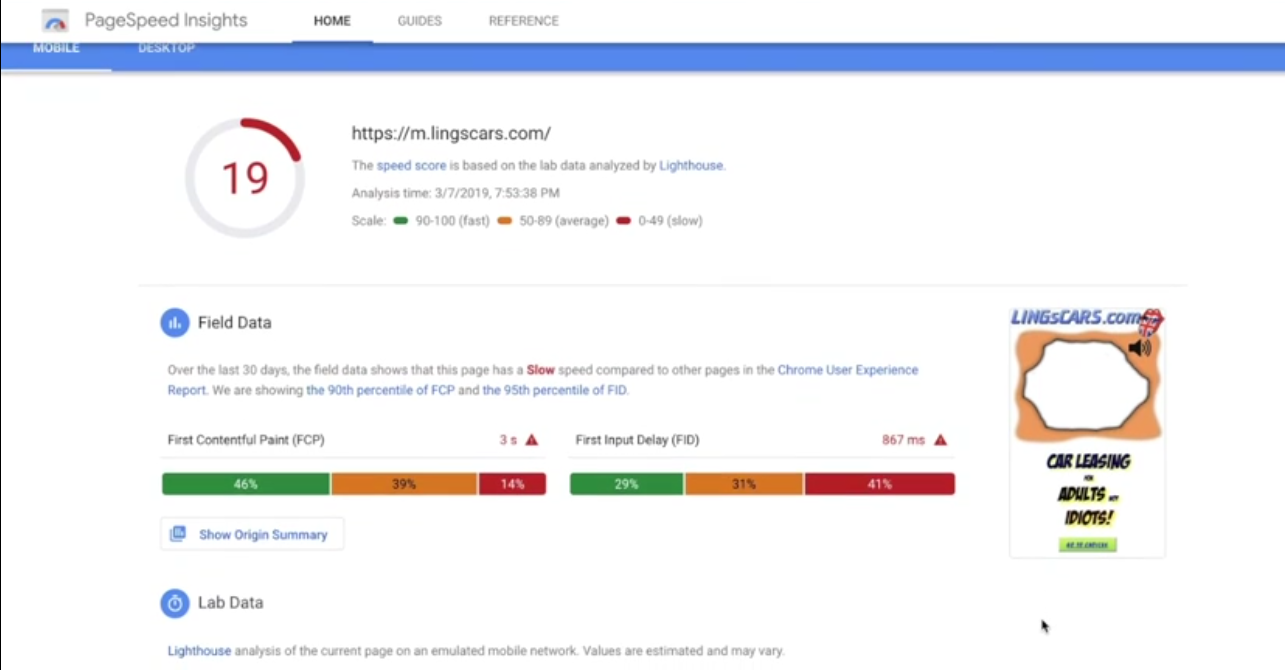
She has done some optimization for mobile. It's still pretty slow, but there it is.
Multiple page redirects. So, this is a redirect where it started at lingscars and then it went to m.lingscars.com. So, these are common things that take a lot of time for mobile.
Here, the payload ... they're calling an enormous payload. 4,510 KB, so about four and a half megs. If you compare that to the desktop site for lingscars, it was 10 MB. So, there is definitely some optimization happening for mobile, although it's still a pretty slow site.
WebPage Test - Mobile
The best is on webpagetest.org.
We'll do Etsy.com for this because it's faster.
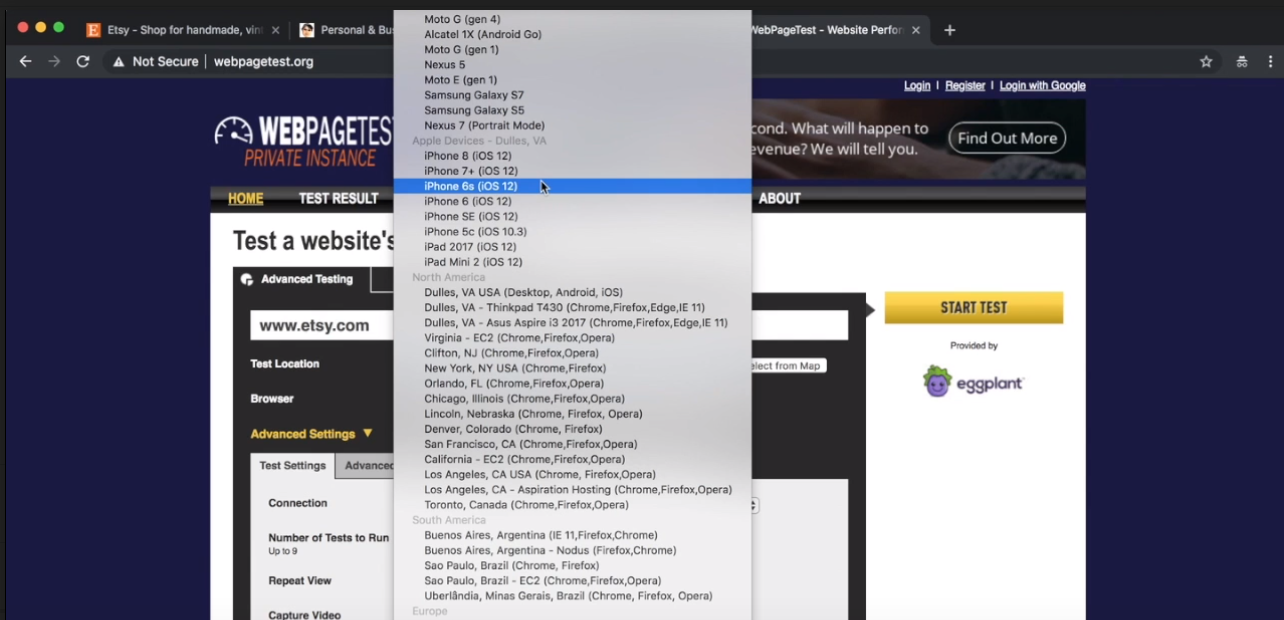
These are real devices that are hosted in Dulles, Virginia. So, East coast. Let's pick Samsung Galaxy S7 and we'll pick a 4G network.
Now, we'll run this test. You can see because this is a public resource, we have to wait for somebody else to finish. It's actually possible to host webpagetest on your own services so you can run it whenever you like and not have to wait in line.
Our first test is done. It actually runs it three times.
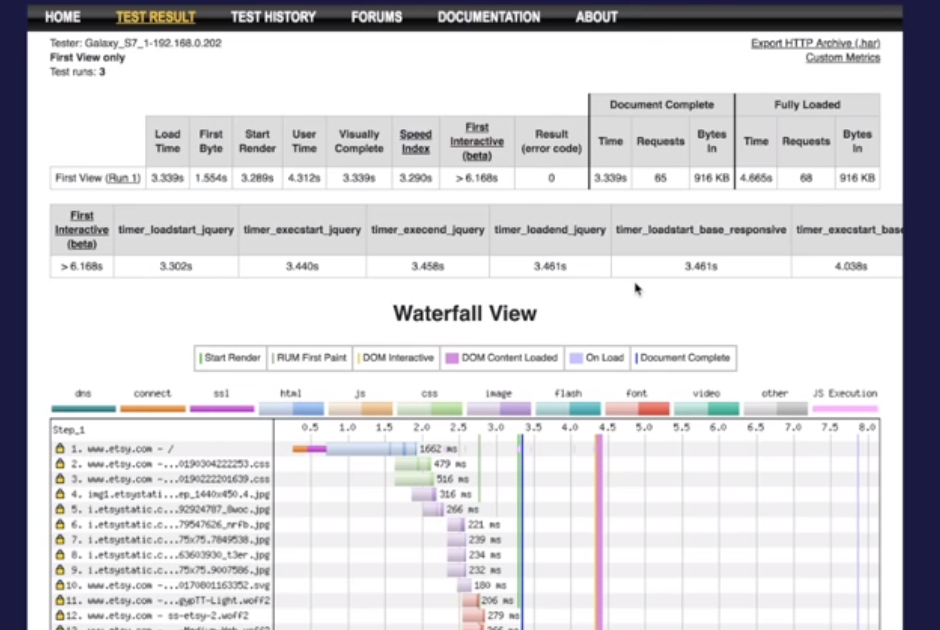
You can see here a similar breakdown of the various bits and pieces. So, document complete in under four seconds. That's pretty fast for a 3G network.
So, we've looked at how we can do performance profiling for websites and mobile websites, but what about mobile applications that aren't necessarily running on HCP?
I want to take a quick look at some profiler tools that you can use to do that, especially Android Studio Profiler. There's also Xcode Instruments for iOS and also just looking at the device statistics.
Android Studio Profiler
To set up for Android, you need to first install Android Studio on your laptop, then get a test APK file.
The most important thing is, on your phone, to enable the developer options. It's going to look something like this (and you need to look up for each specific device how to get it turned on).
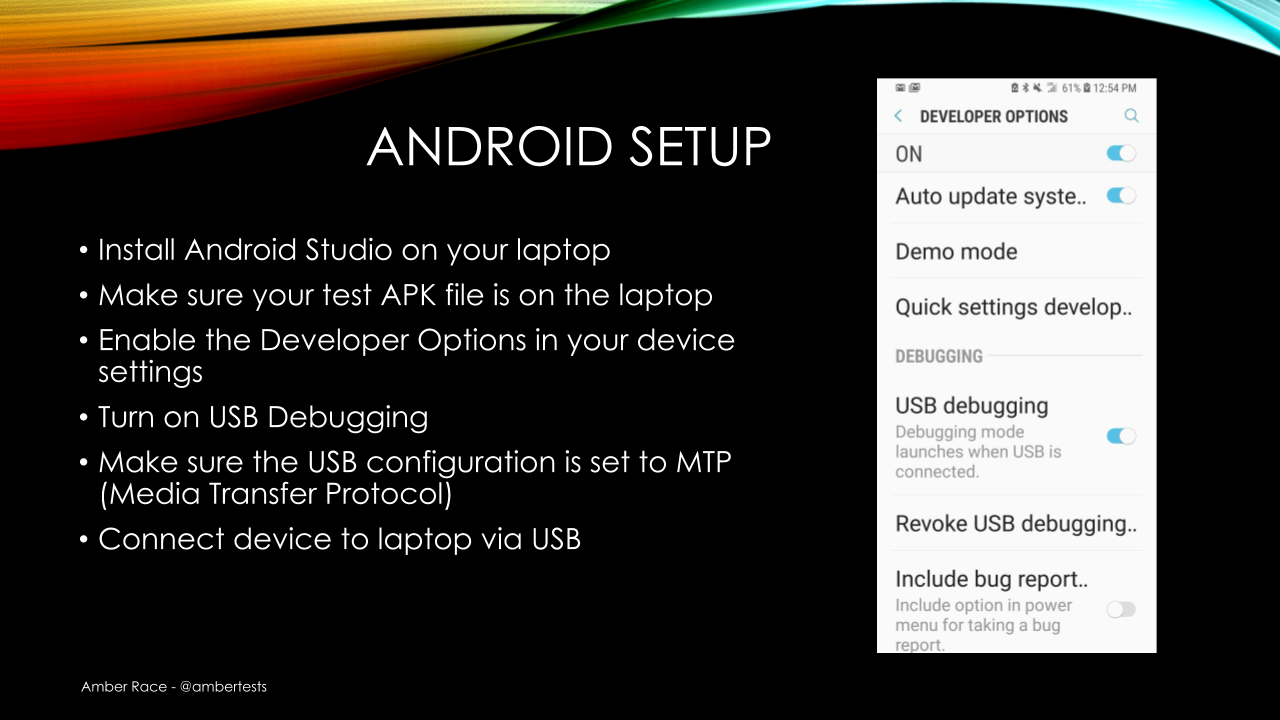
It's usually something like you go to settings and then you click the version seven times or something like that. Just look it up on Google. For each device, it's going to be a little bit different.
Then once the developer options are enabled, you can turn on USB debugging for the media transfer protocol and then connect your device to the laptop.
So, I have done all of that and let's see what happens next.
Here, I'm ready to open Android Studio. I'm going to Profile or Debug the APK, so, I click that. I select my test APK (TestApp.apk).
We'll just Create a New Folder.
The first thing that Android Profiler is going to do is look at the size of the files on your APK.
This is very important for download times and Google actually has rules about how big APKs can be and also how much space you're taking up on the phone itself.
Now that everything is here, I just push the Profiler button and I select my device, which is connected. Now, it's going to install the APK on my device.
The installation is finished and it's starting things up on my phone. Now, we can make this a little bigger and see what's going on. You can see that we have CPU, memory, network, and energy. That's how much battery it's using.
Now, I'm going to go ahead and play a little bit. If you look at these dots here, these dots represent every time I touch the device.
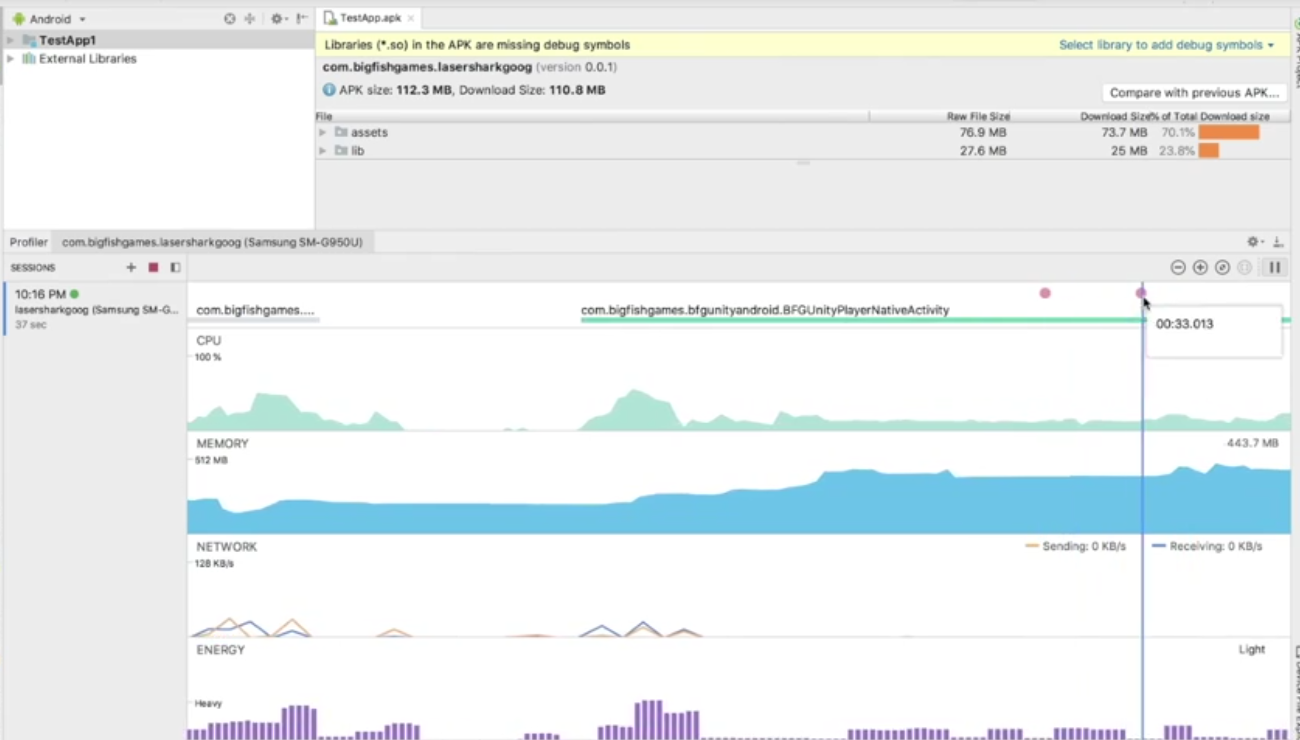
Every time something happens, you can see this red dot here.
So, that's the basic idea. You can watch this for certain spikes when things happen, if it's using too much CPU, too much energy, all that sort of thing, all available here.
Xcode Instruments
Apple provides similar tooling for iOS devices, except it's a little more complicated, of course, because it's iOS.
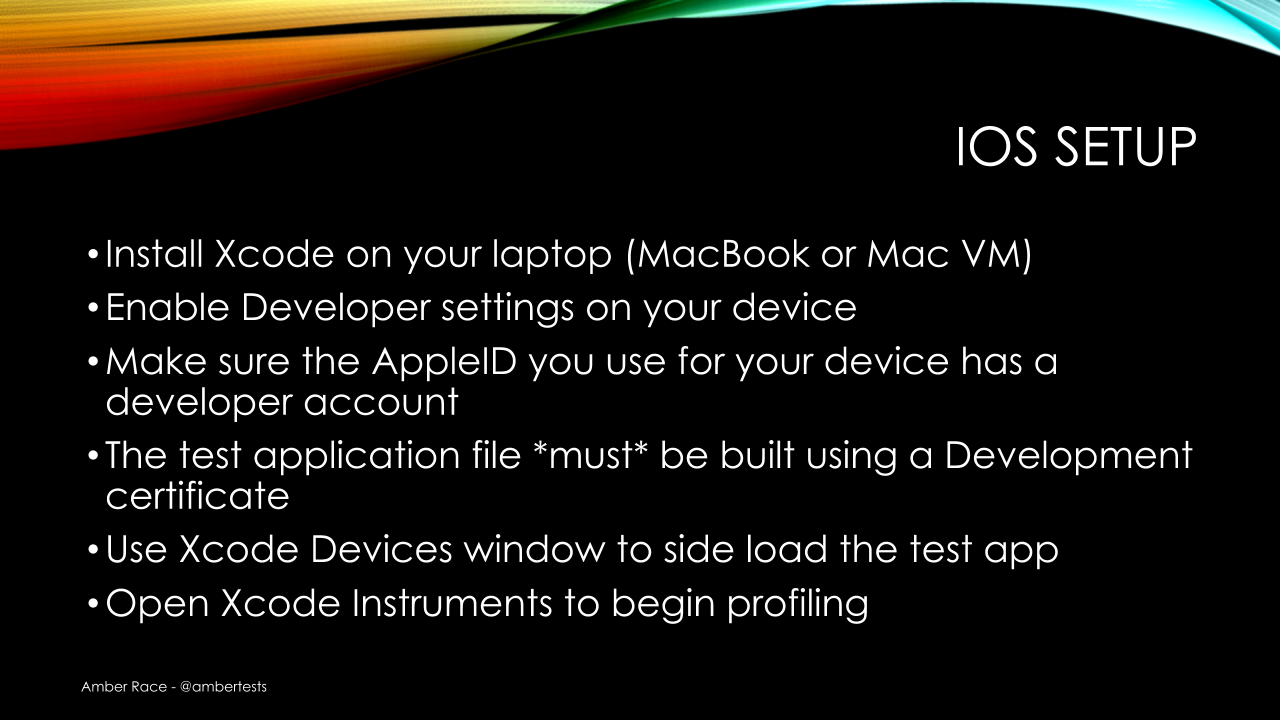
You need to have an account that is a developer account with Apple and then you have to have a test application that's built using the development certificate.
Once you have those two things which, unfortunately, I don't have so I can't demonstrate, but then you can use Xcode Devices window to load the test application and Xcode Instruments to begin profiling and it'll be very similar to the Android profiler.
Device Statistics
Finally, you can actually just check your device while you're using application to monitor the resources that it's using.
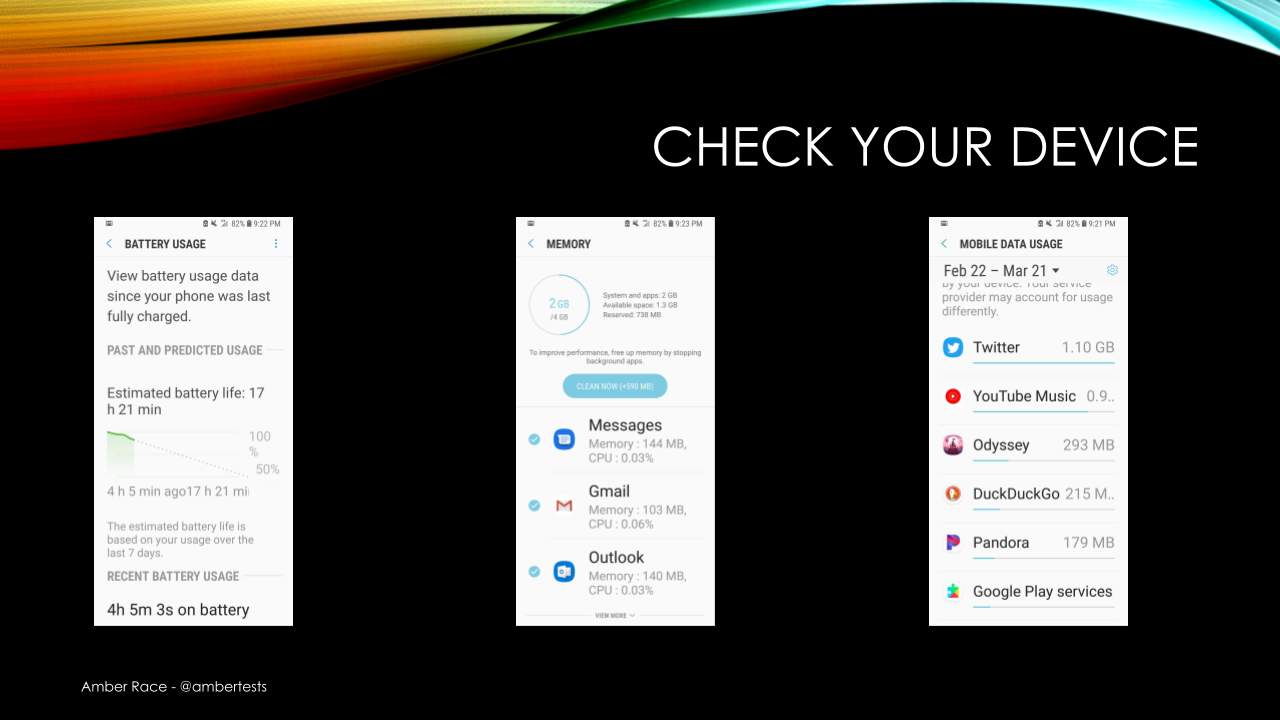
The battery usage, memory, mobile data usage, all of these things are available on either an Android or an iOS phone and they can be very useful for determining how an application is behaving.
Hopefully this has given you some ideas of how you can begin to test the of your client applications. Next, we'll move on to the server.
