

Transcripted Summary
In this chapter, we're going to take a break from our code and focus primarily on the Applitools dashboard. In the first course, we covered just the basics of reviewing your test results and how to handle differences found by the Applitools Match Levels.
In this chapter, we're going to take this a few steps further and go over some advanced tips for navigating your test results.
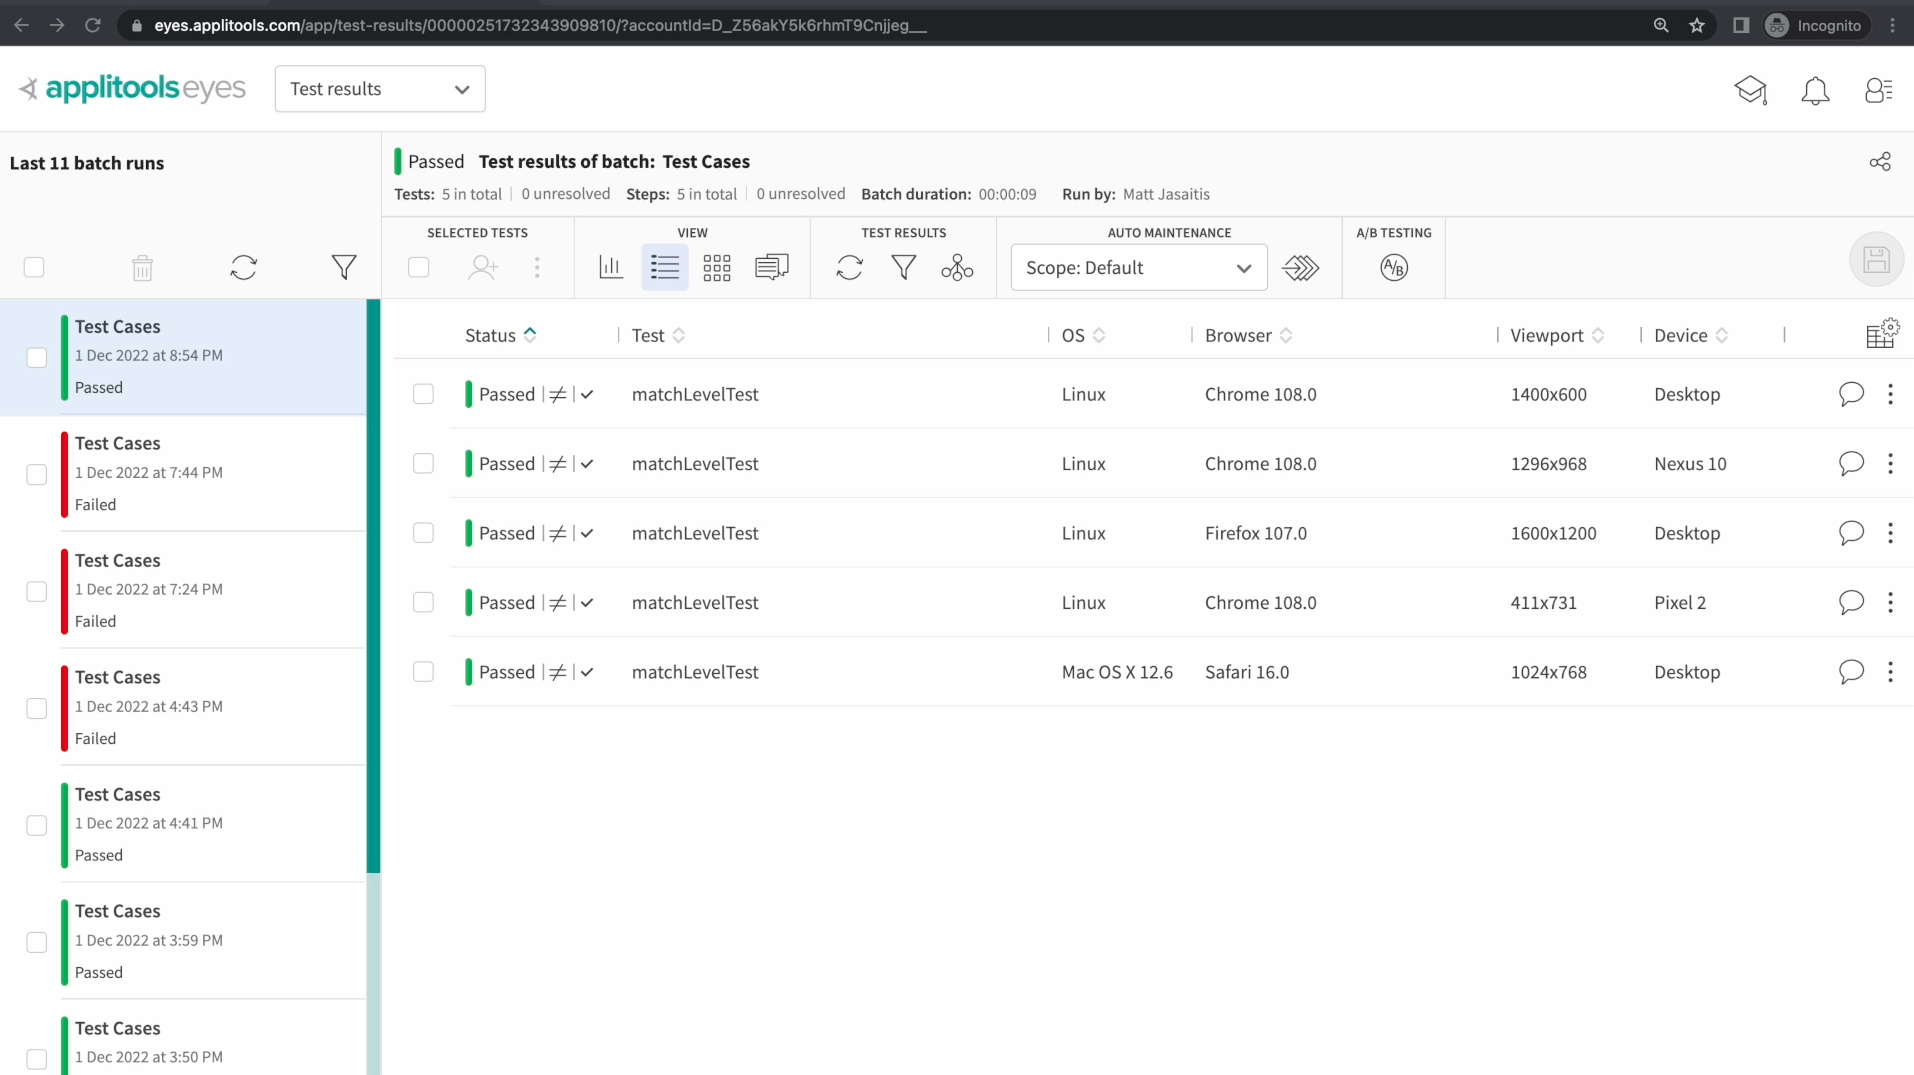
At this point in the course, I'm sure that we're all familiar with the list of batches on the left side of the dashboard. It's been fairly easy for us to review our test results since we've been following the basic format of running our test once and then reviewing the latest entry in this list.
But, in practice, you'll probably be working on a team with other people and they'll probably all be running their own tests. This can make it hard to locate your test runs and focus on the results that you need to review.
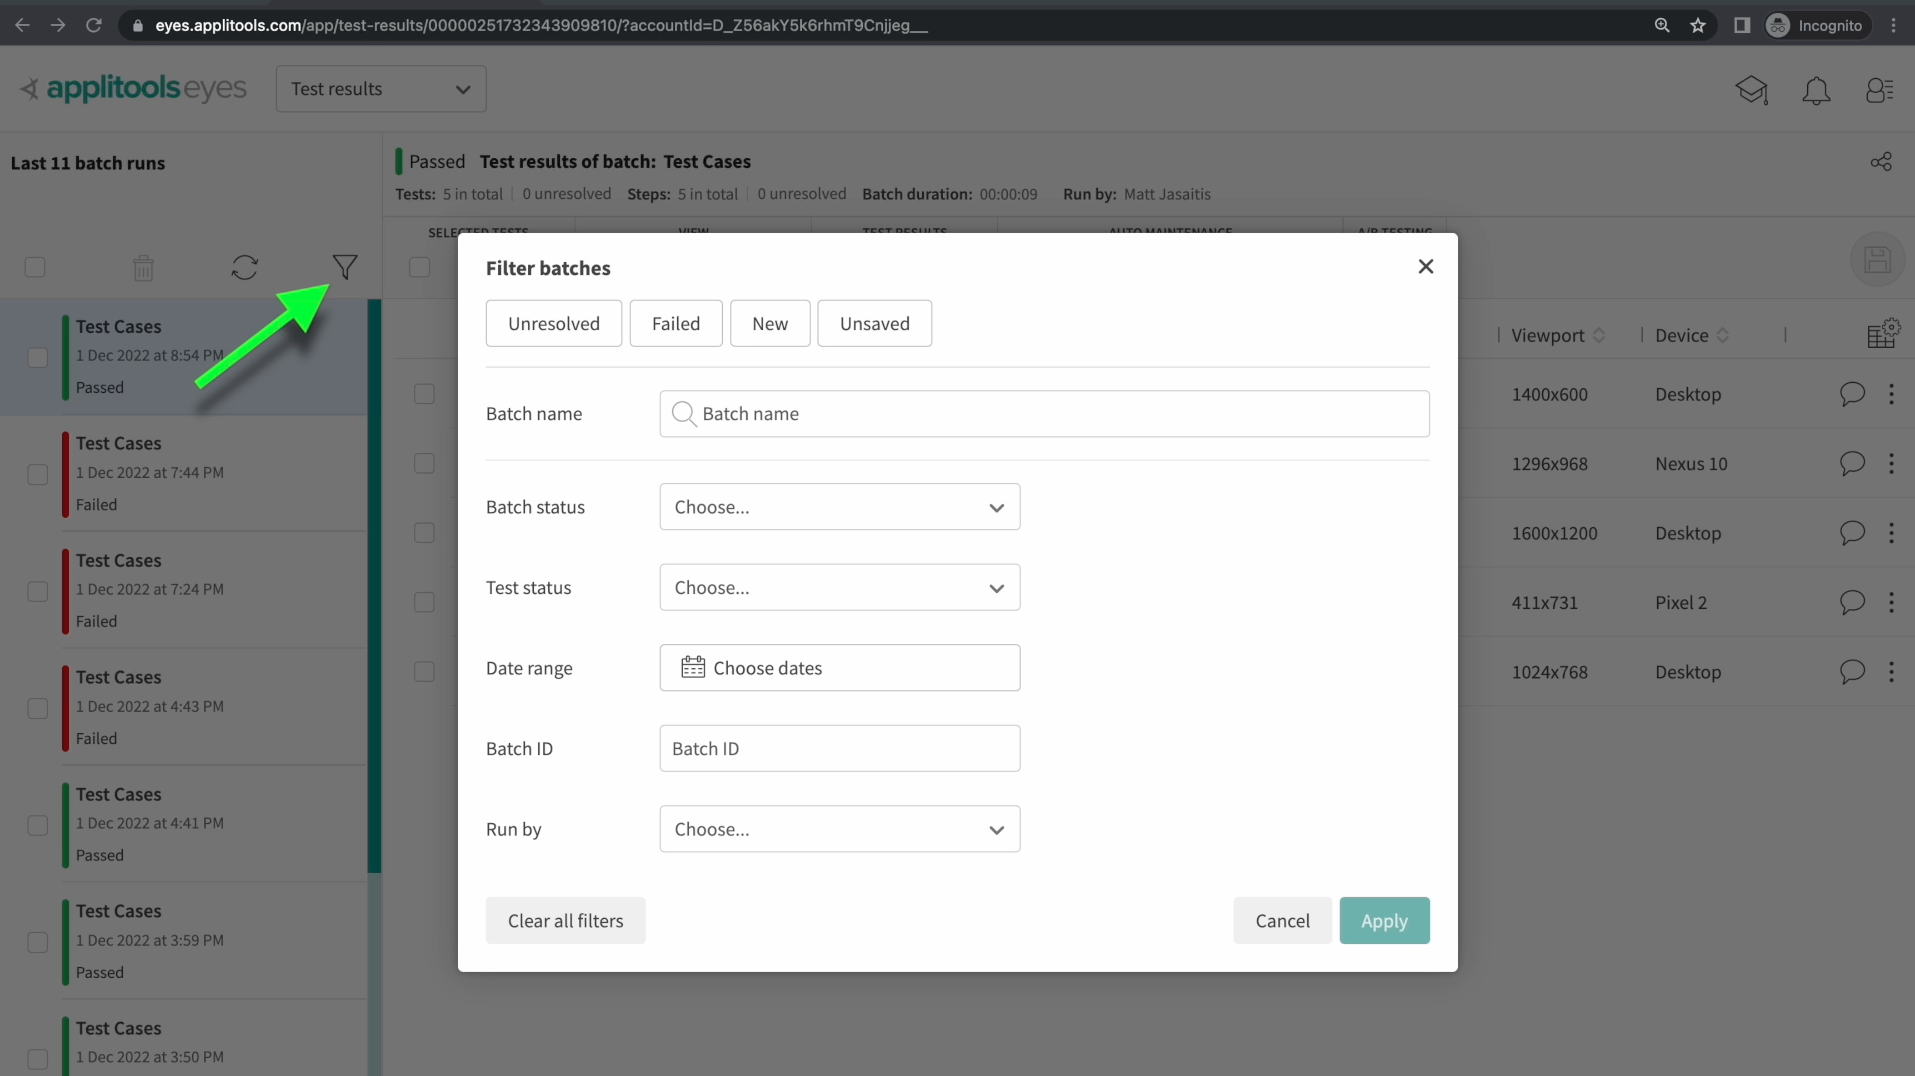
If we click on the filter button above the batch list, we're presented with a number of options that can help us locate the batches that we're interested in. We can search by batch name, status, date and more.
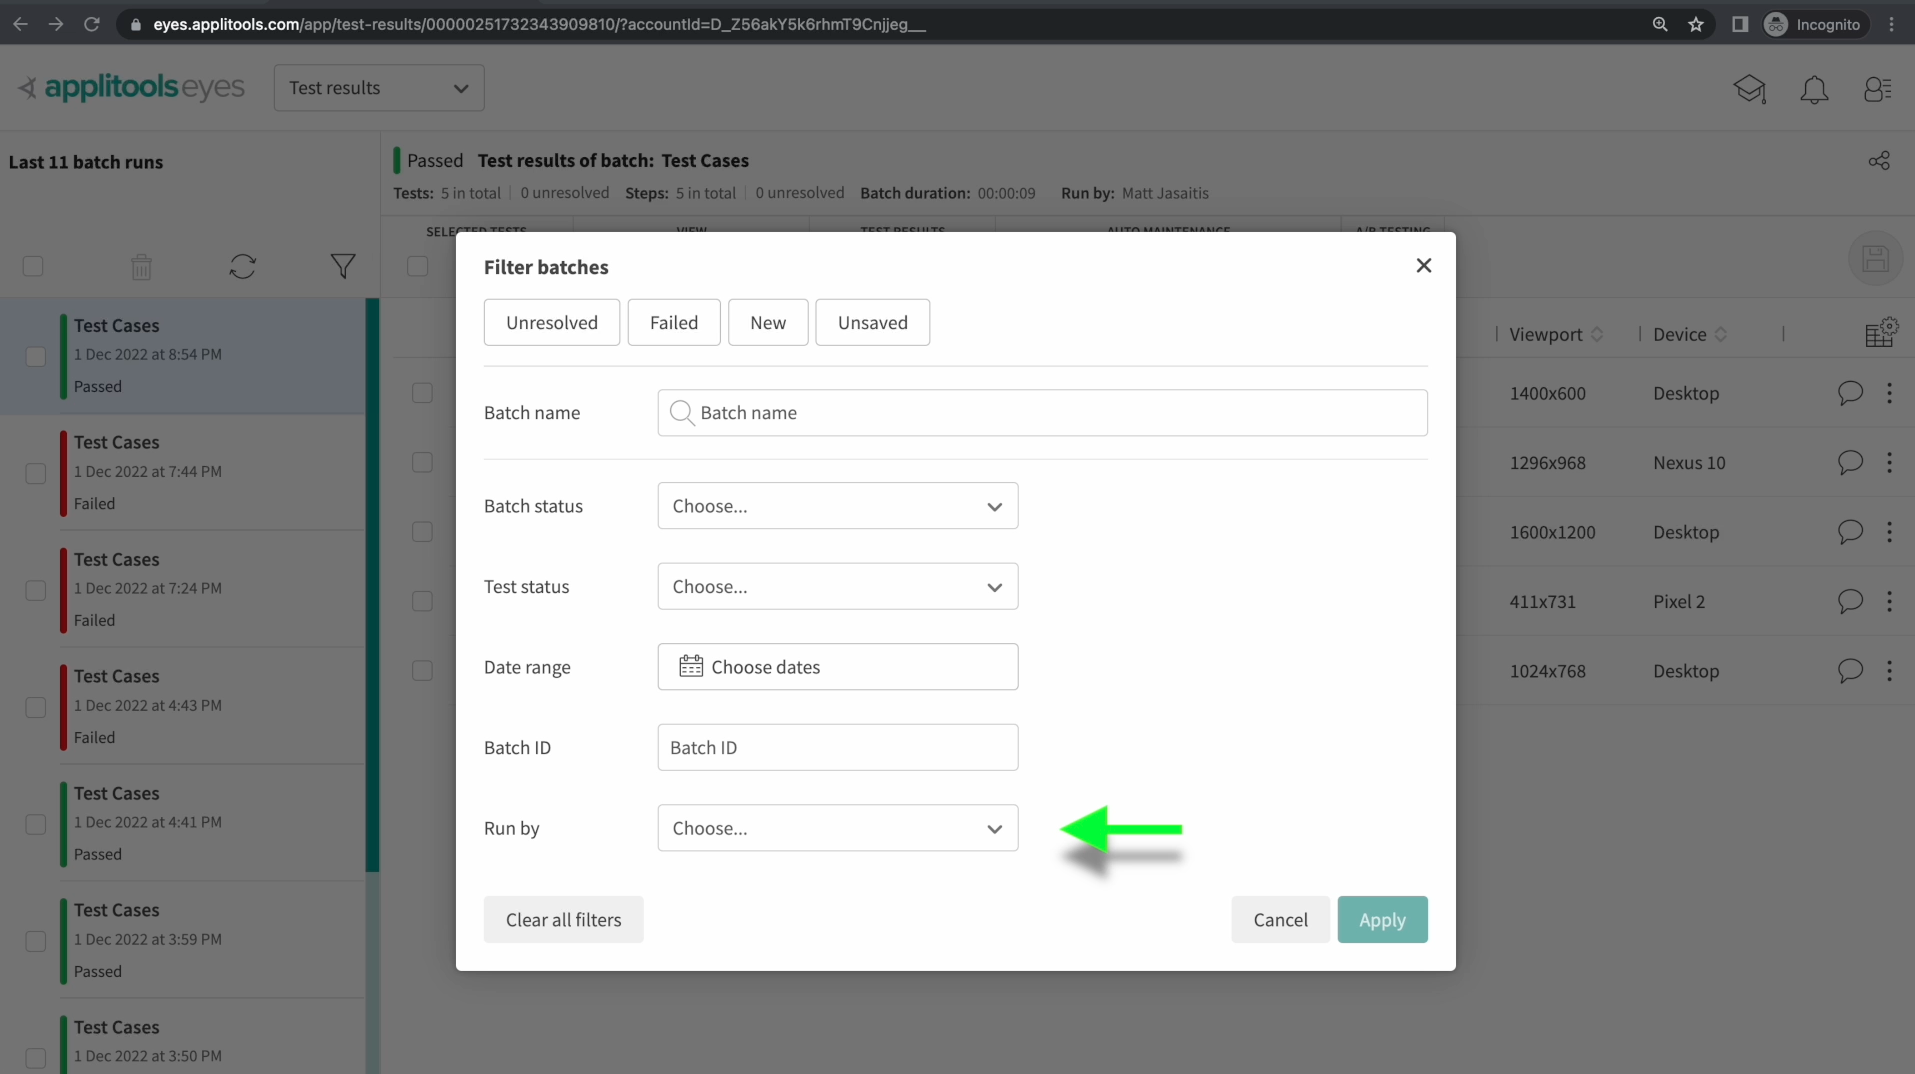
The bottom option is especially interesting as that allows us to search for batches run by a specific user. Applying this filter could allow us to quickly find test results that we ran. Feel free to play around with these filter options and then select a batch that you want to review.
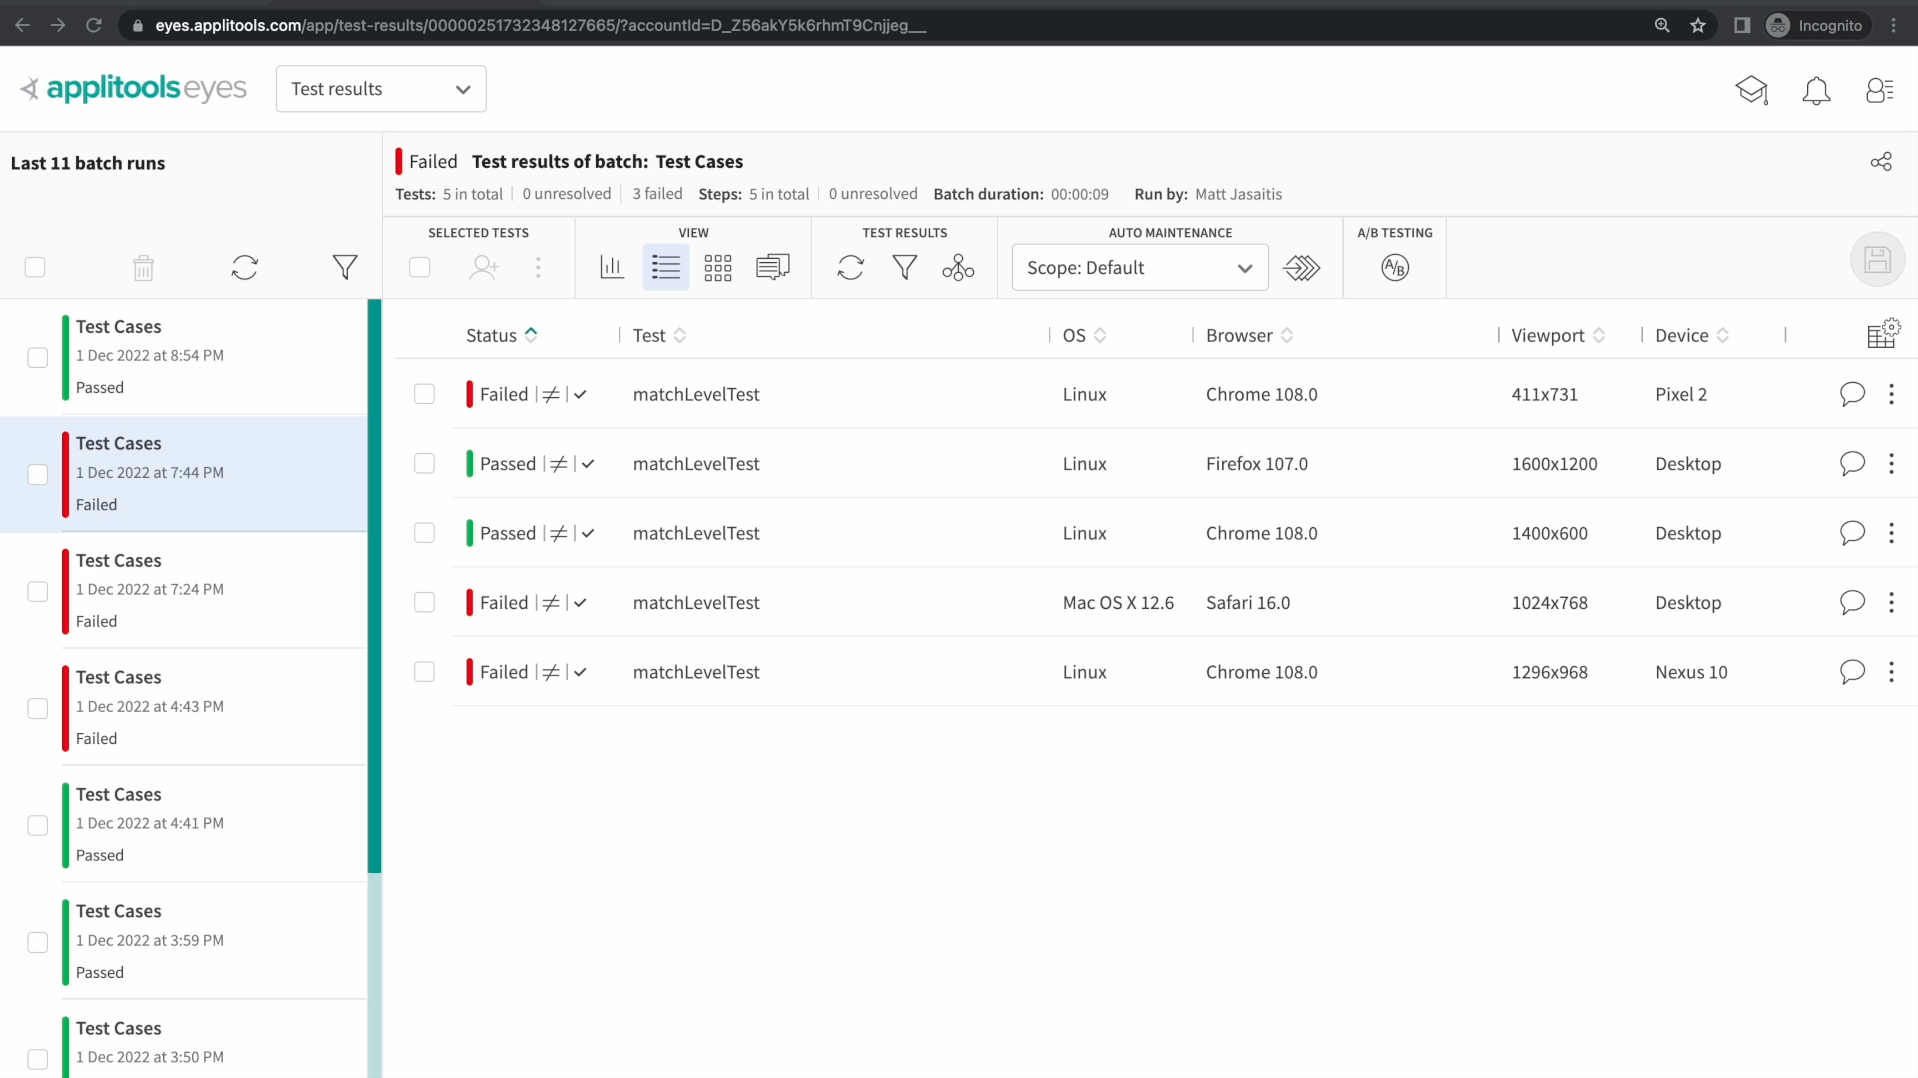
Once we've located the batch that we want to review, clicking on it will show us all the tests within that batch. This is the view we've been working with throughout this course and I now want to highlight some more features within this view.
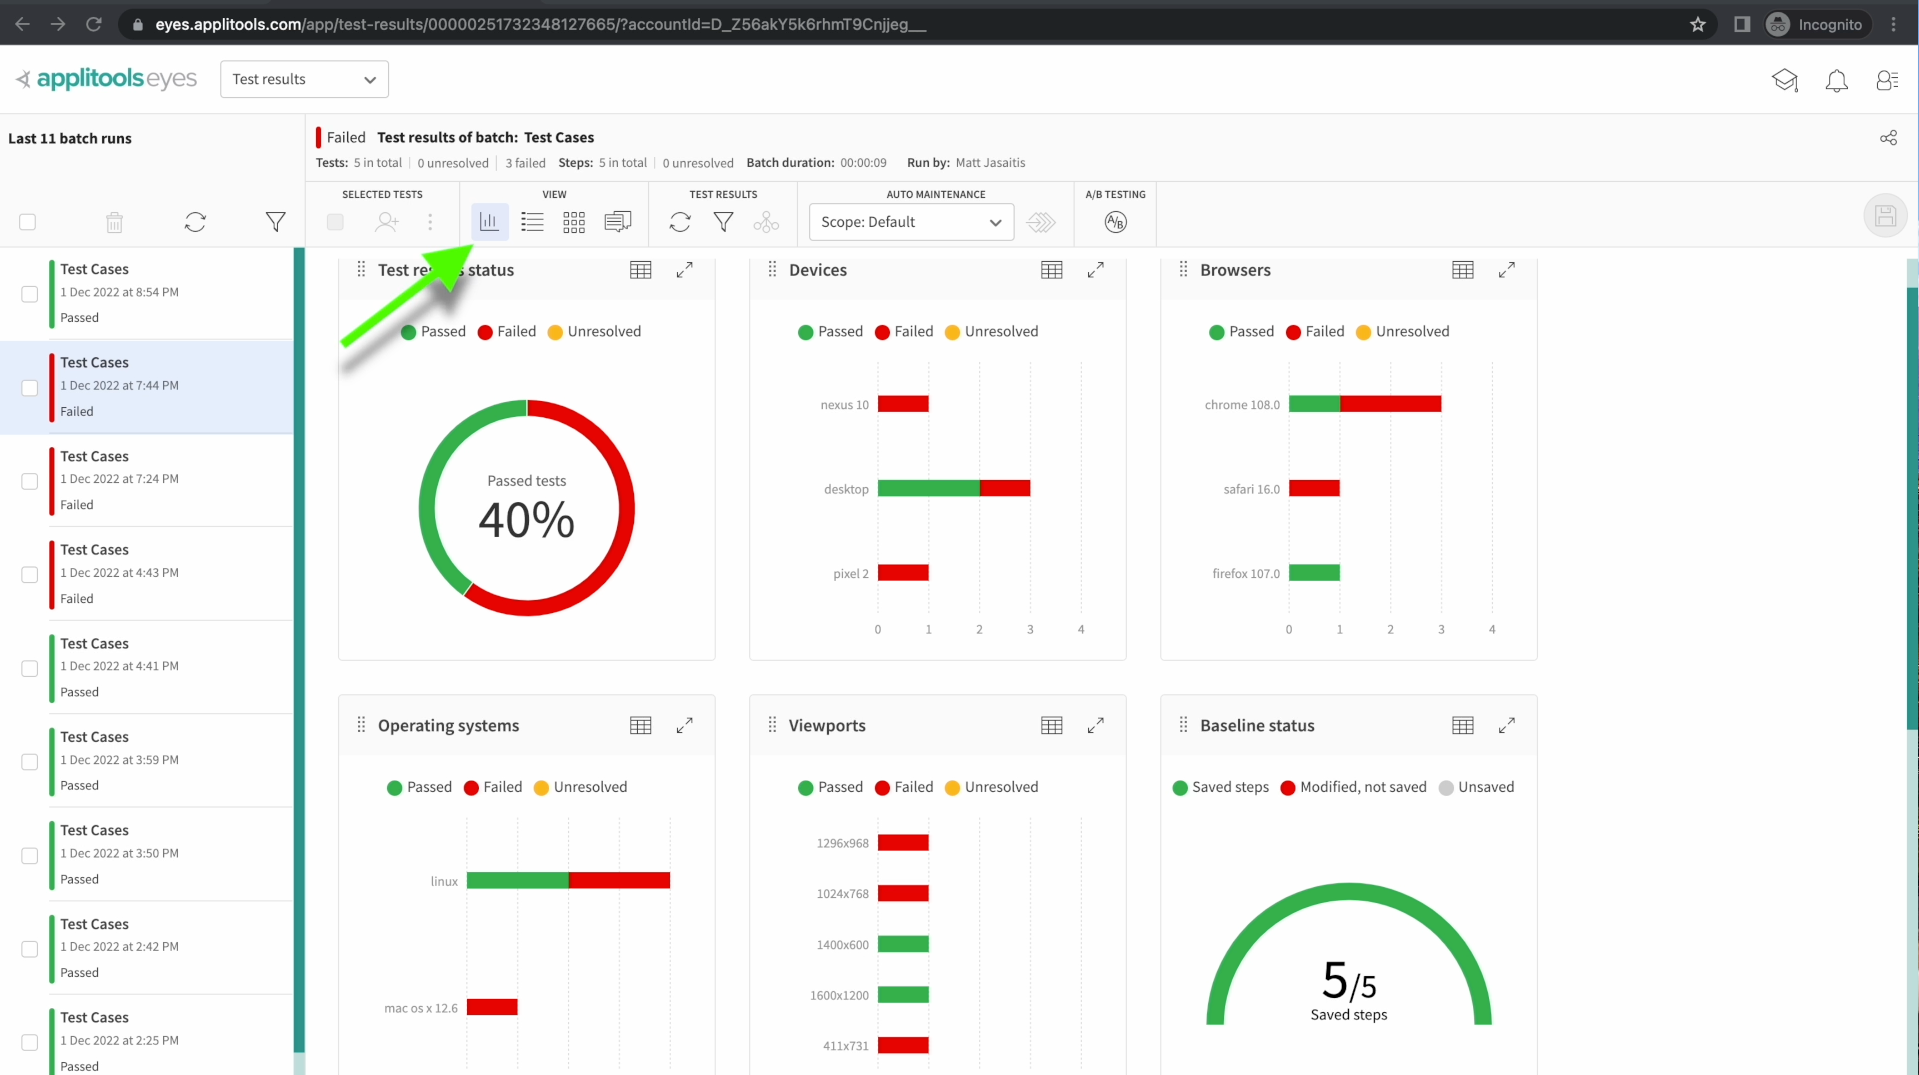
Selecting this icon will take us to the batch Summary view. This shows aggregate data about our batch. We can see how many tests passed and how many failed.
This pass rate is also broken down per environment. We can see all of our browsers, devices and operating systems as well as how they performed. This screen is particularly helpful when running a large quantity of tests as you can easily tell which environments were problematic without having to click through all of your test results.
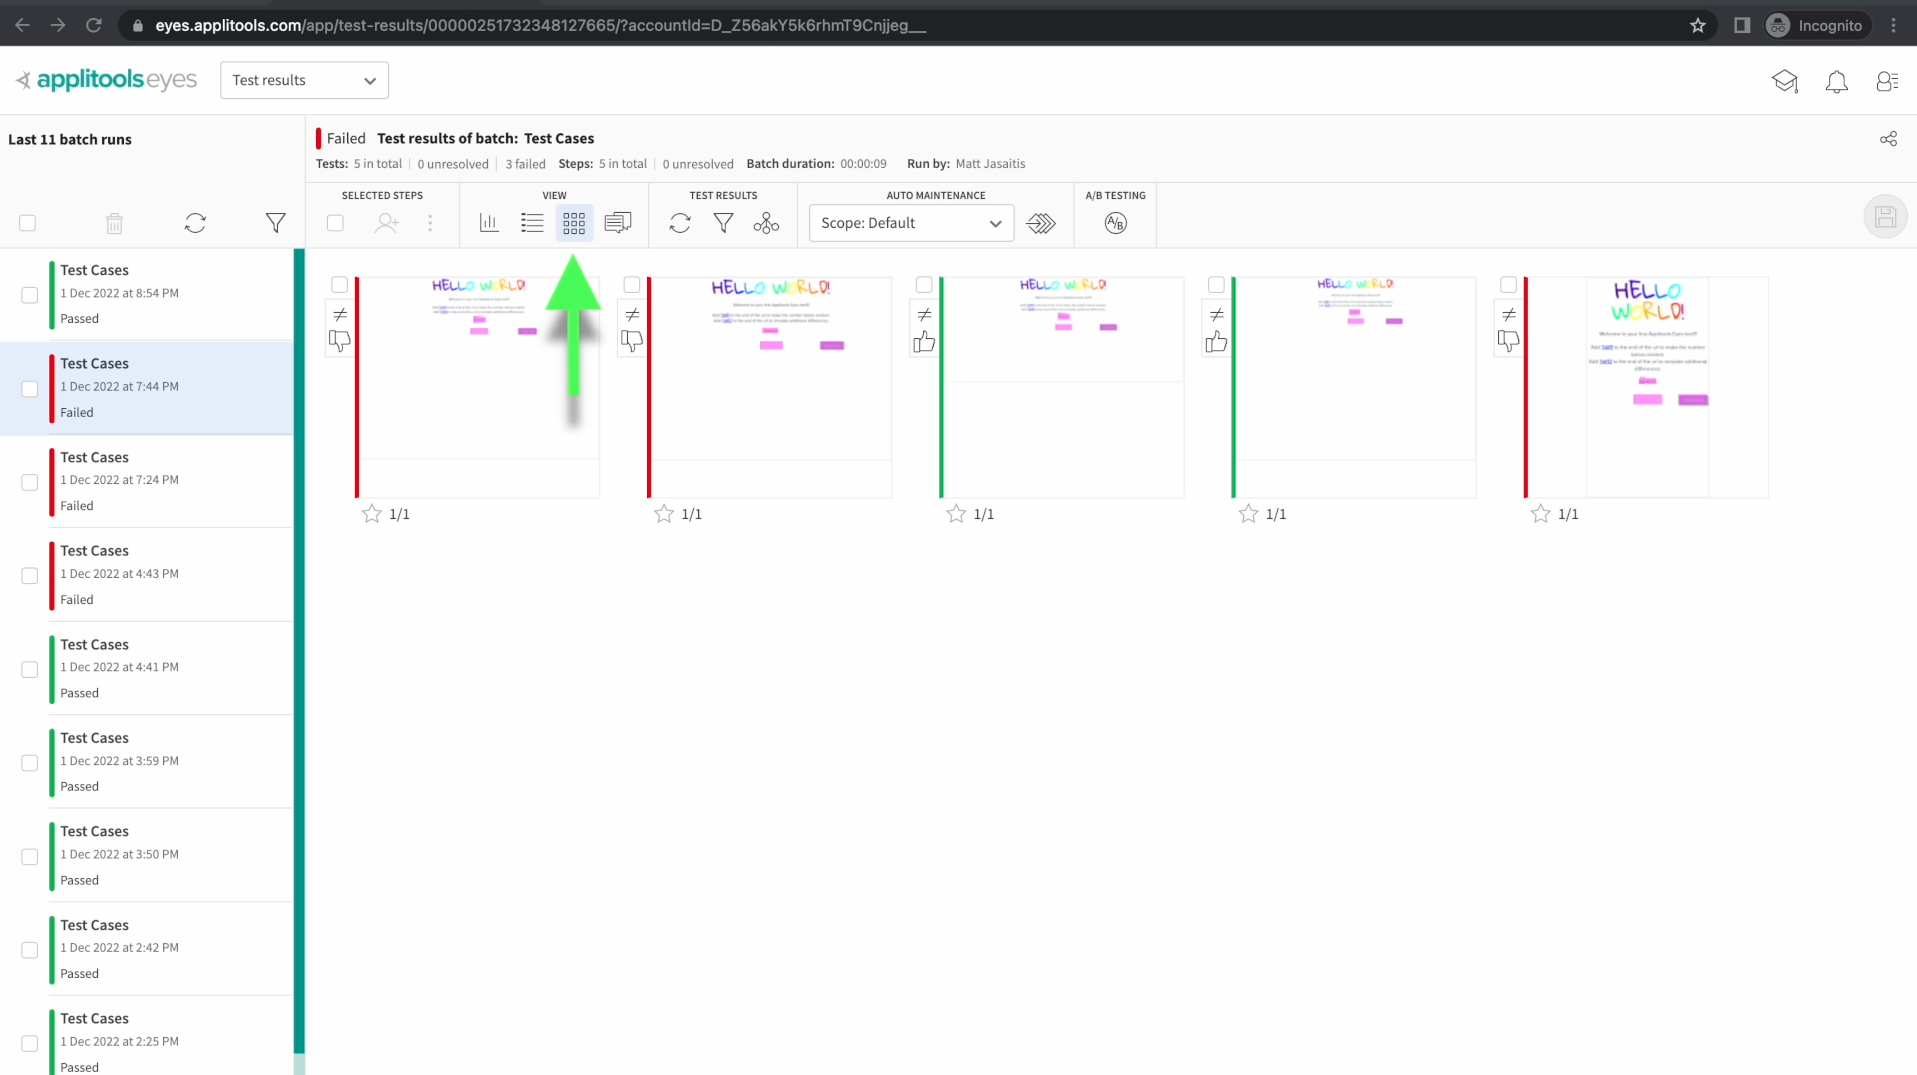
This next screen can be accessed by clicking the button to the right of the List View icon. This screen is called the Grid View and it focuses more on the screenshots themselves rather than the other metadata associated with the tests like the test name or the browser. Use this view when you just want to see the screenshots with minimal clicks.
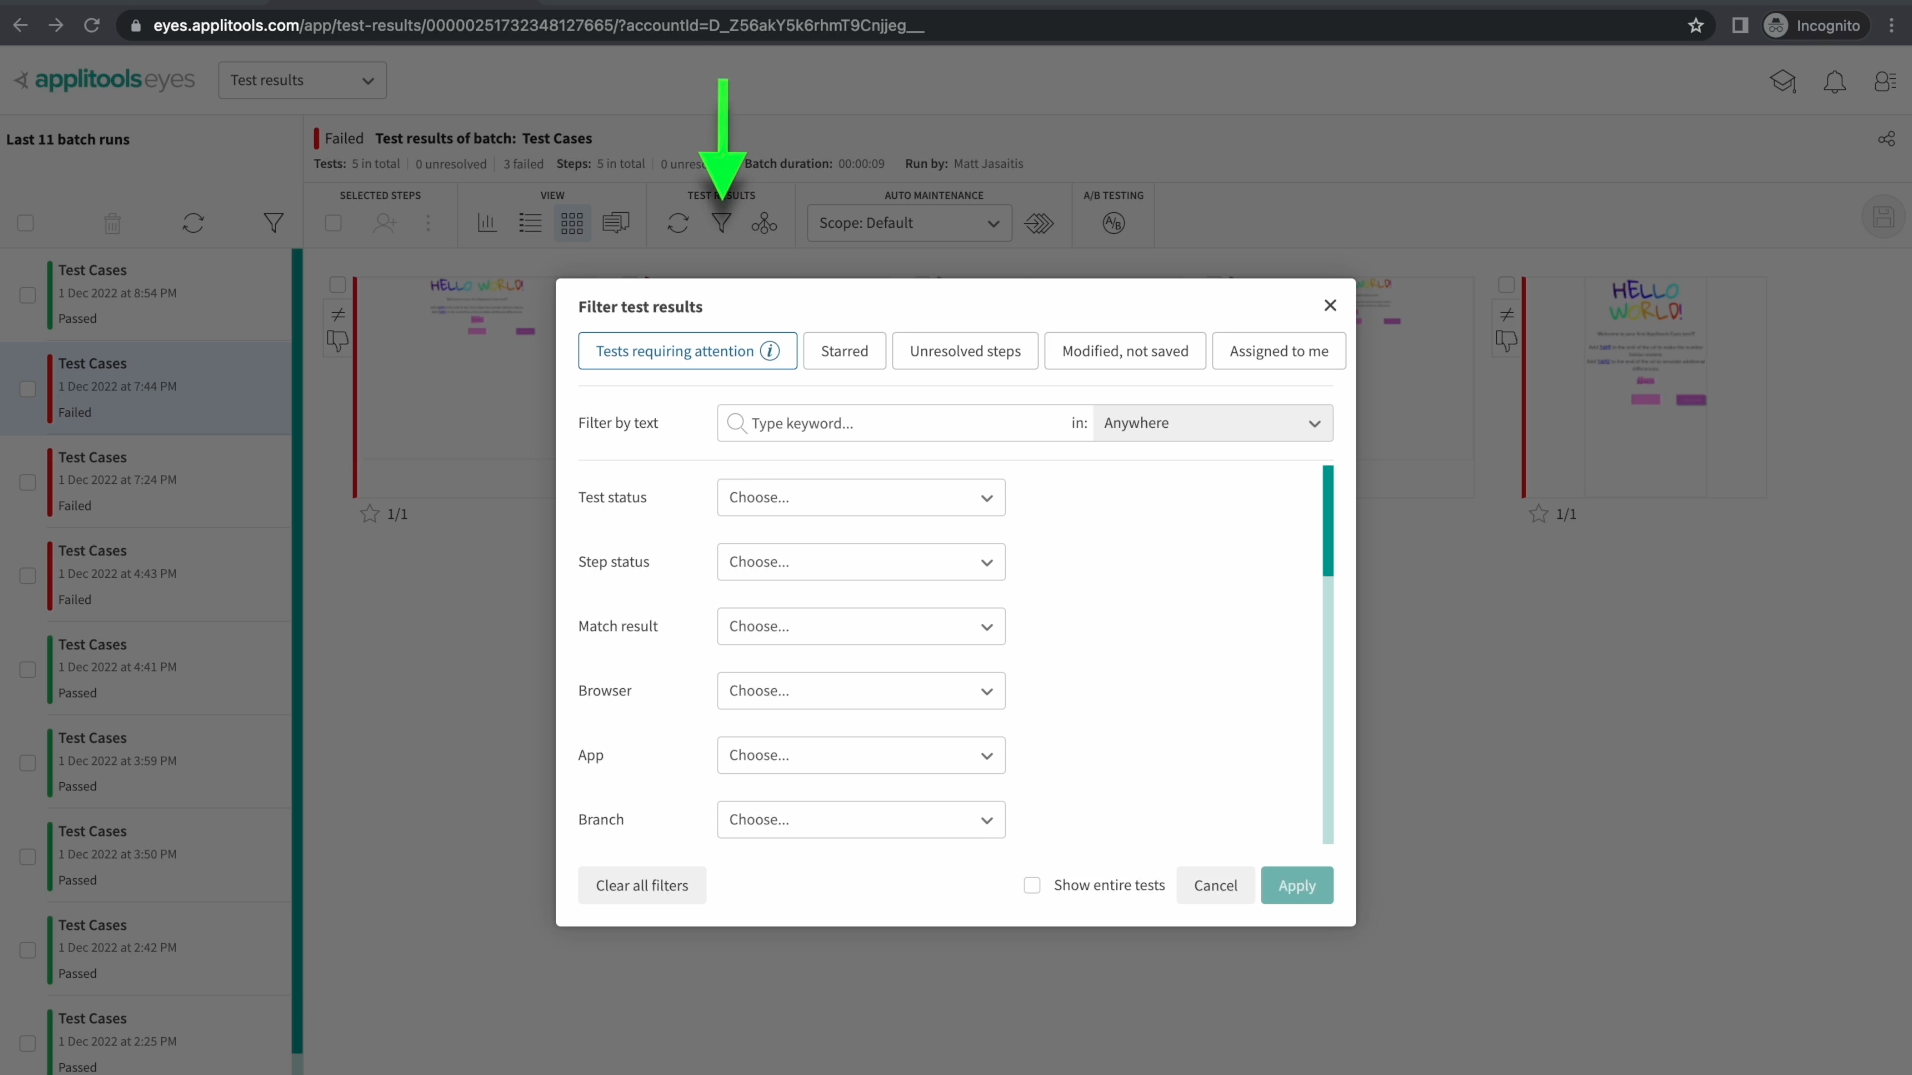
Just like we filtered our batches earlier, we can also filter the test results within a batch. Clicking on this icon brings up another filter dialog with many options such as Browser, status, App name and more.
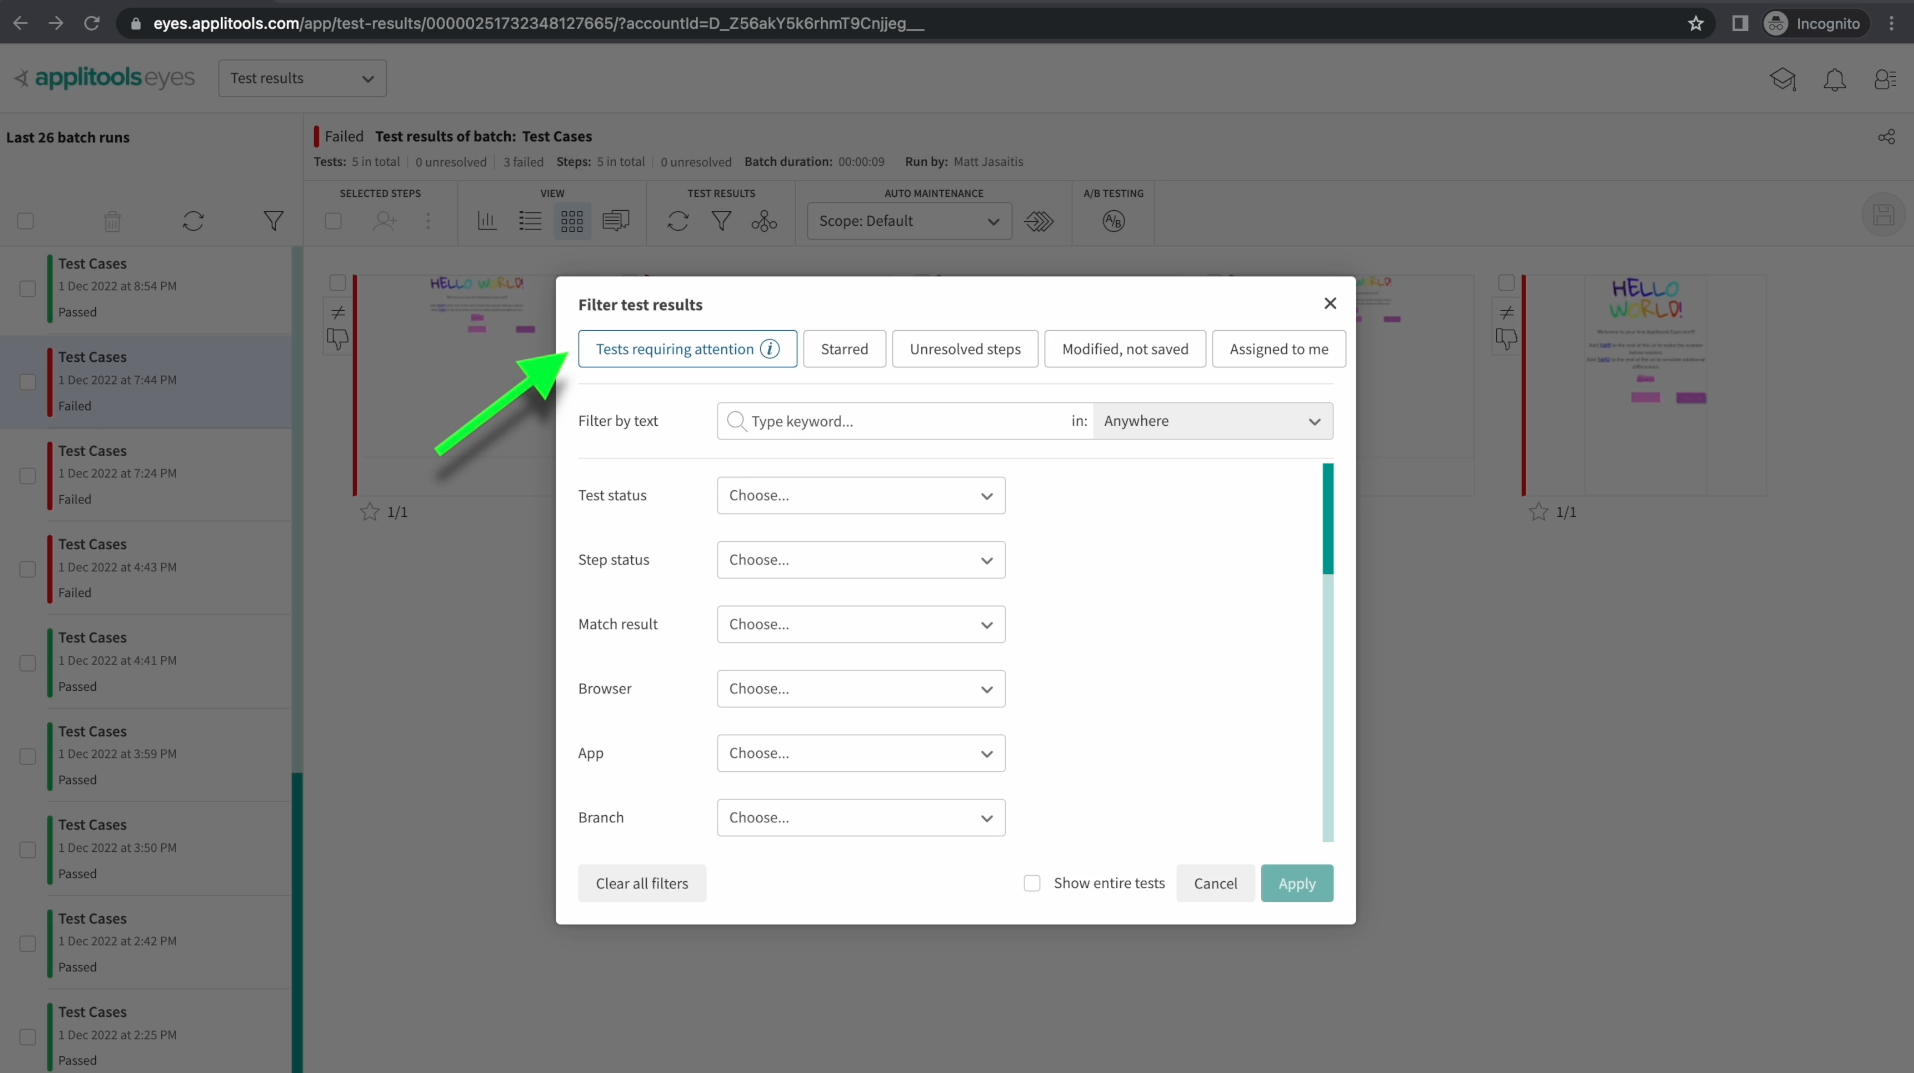
One of the most powerful options here is the "tests requiring attention" option in the top left. Selecting this option will show tests that need to be reviewed. This includes New Tests, Tests with Unresolved differences and tests that have been flagged with issues which we'll cover in a later course. This option is perfect for focusing only on tests where action is required by the user.
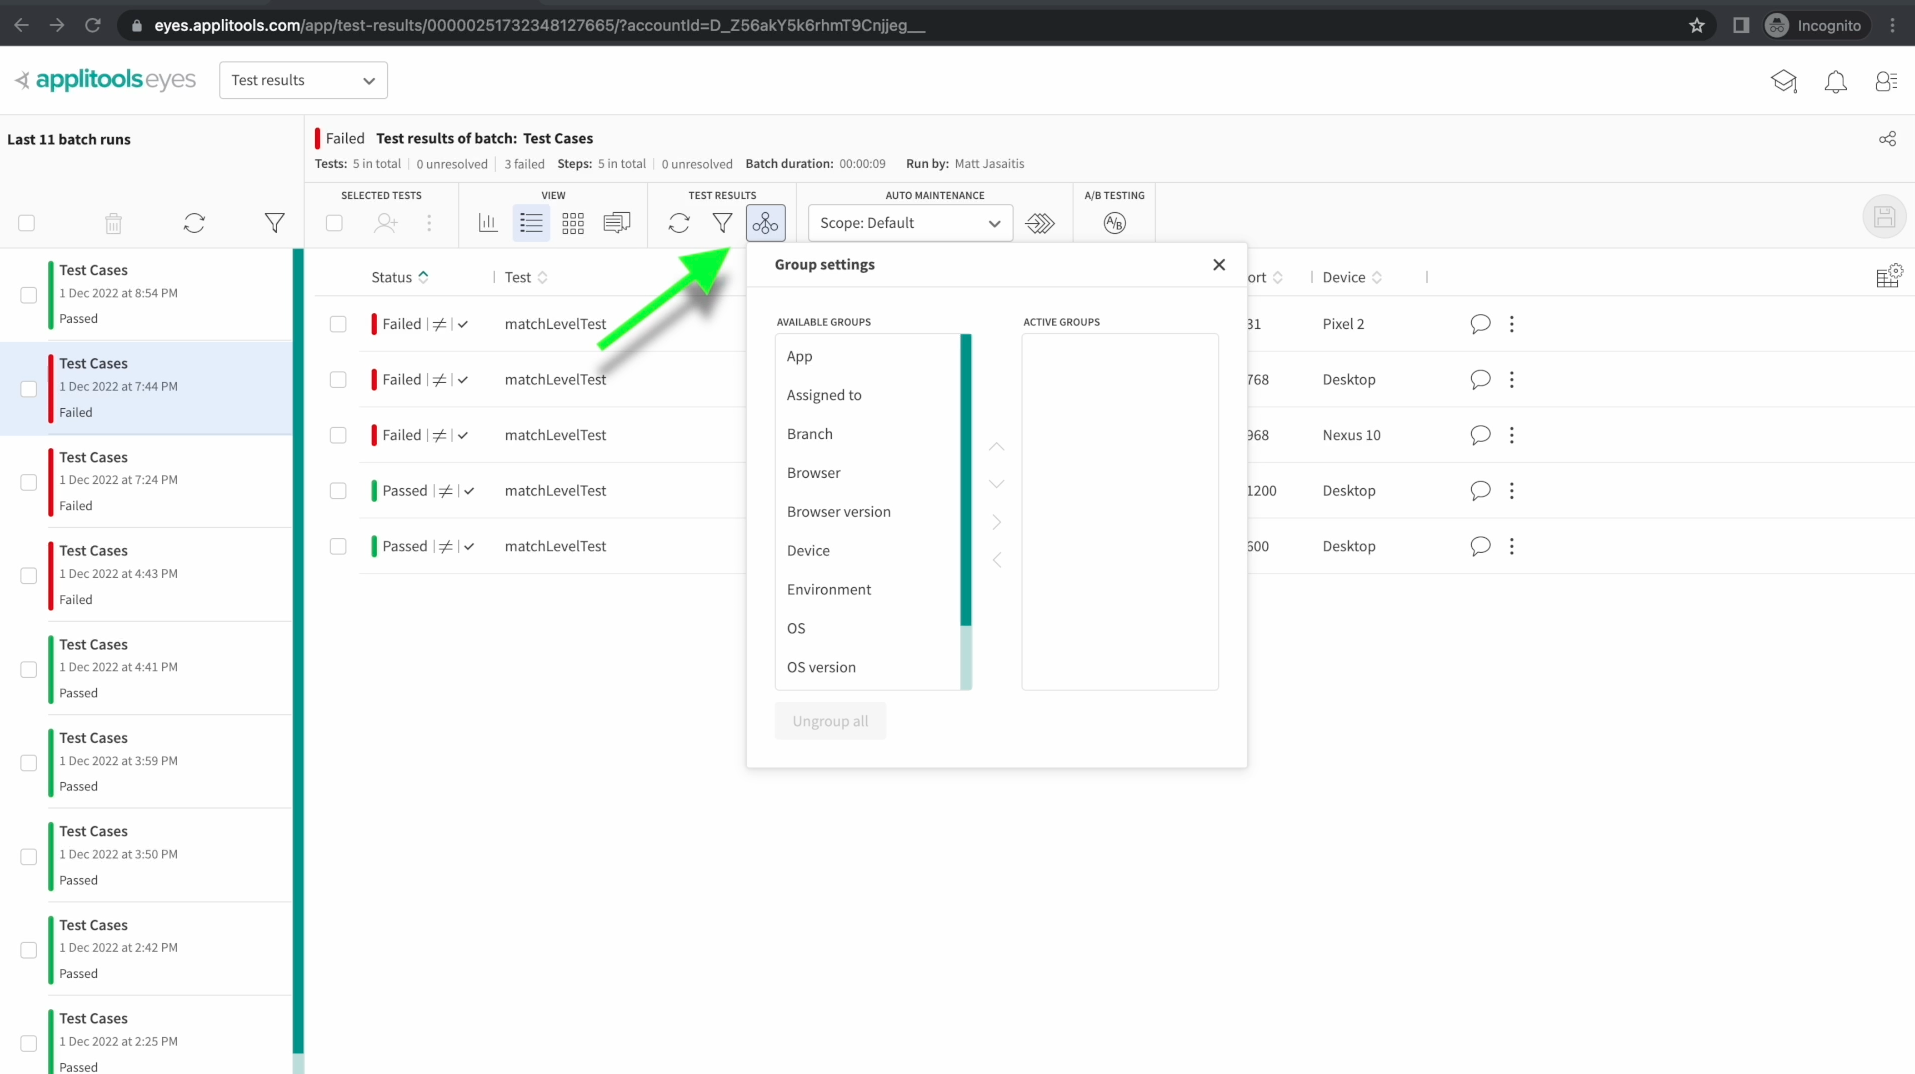
In addition to filtering, you're also able to group your test results. Clicking on this icon to the right of the filter icon brings up a prompt that allows you to select multiple fields to group by. You can select fields by dragging them from the left panel over to the right panel.
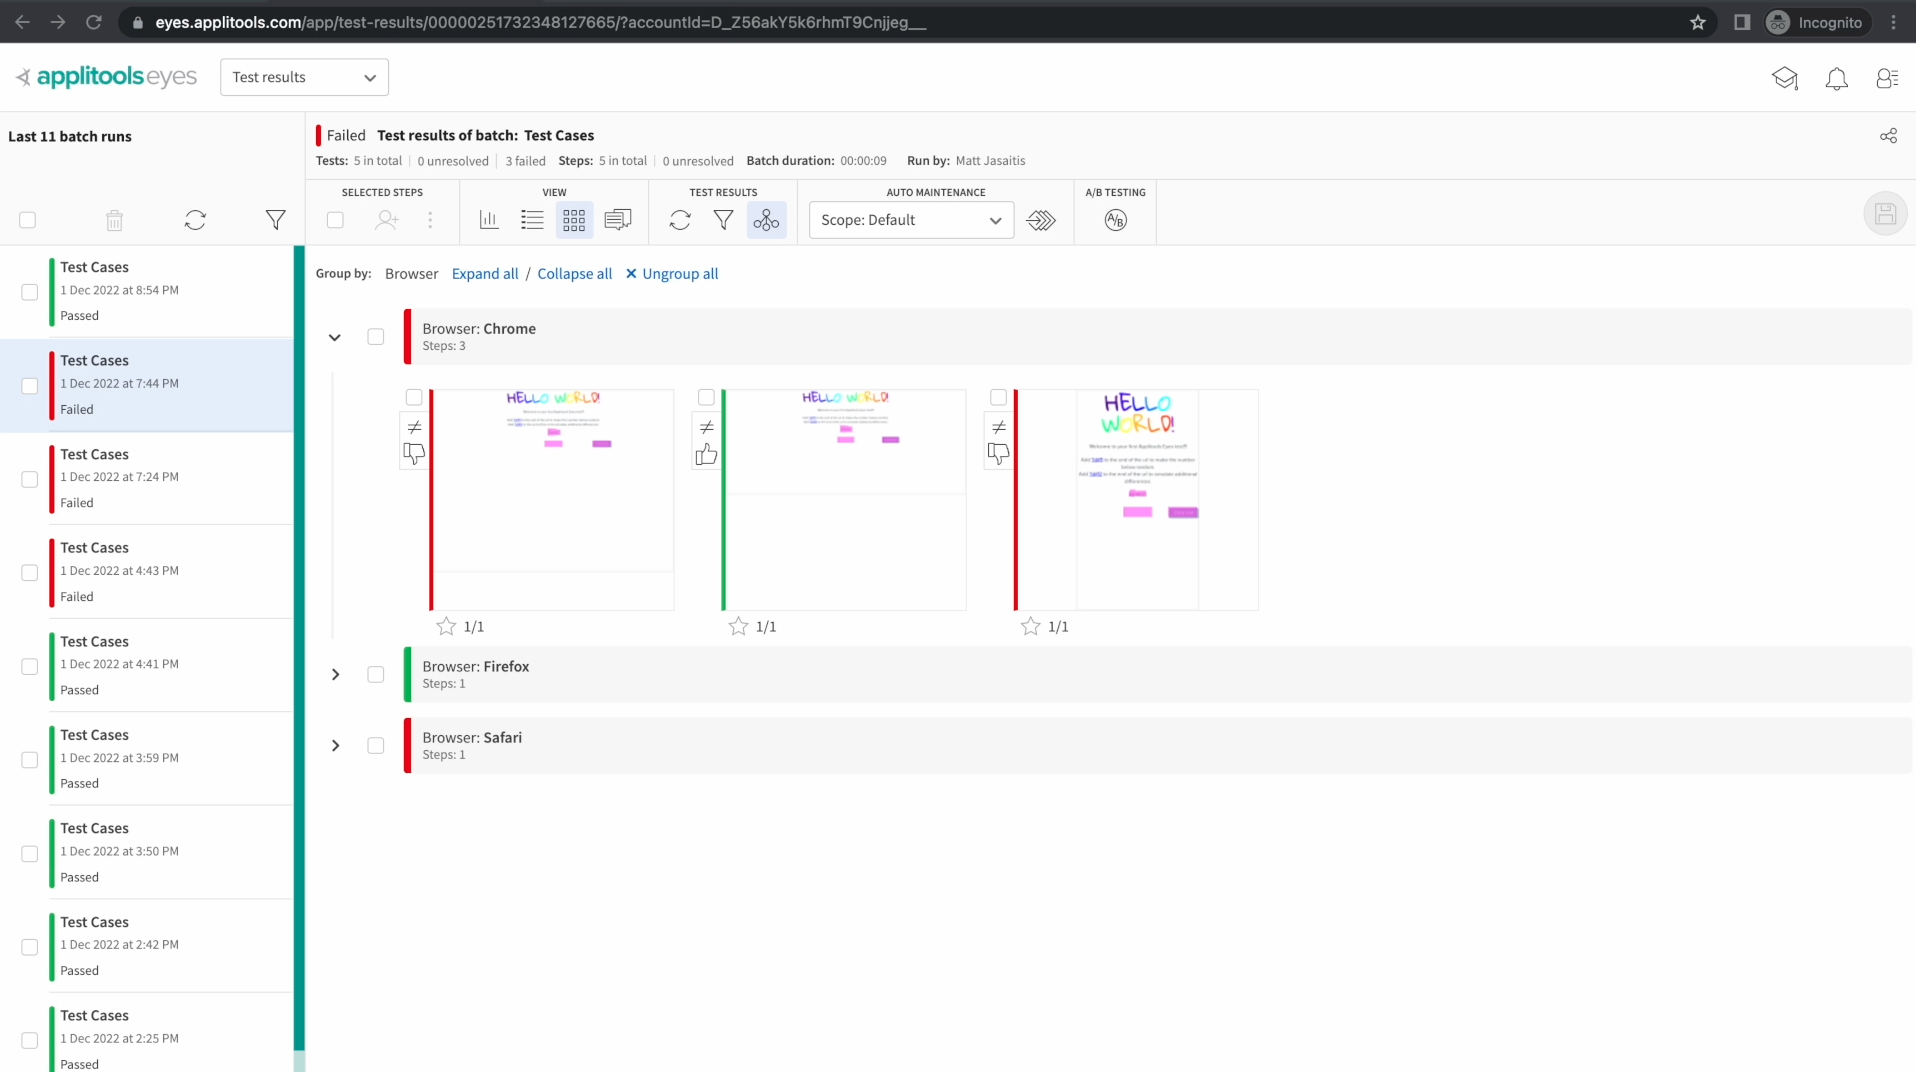
I've gone ahead and grouped our test results by browser and they're now nicely organized making them much easier to process. Also, once you've configured your groups for one batch, they'll persist for other batches that you review as well. This allows you to set up your groups once and then easily review test results across multiple batches. Feel free to try out different group options and see how they work.
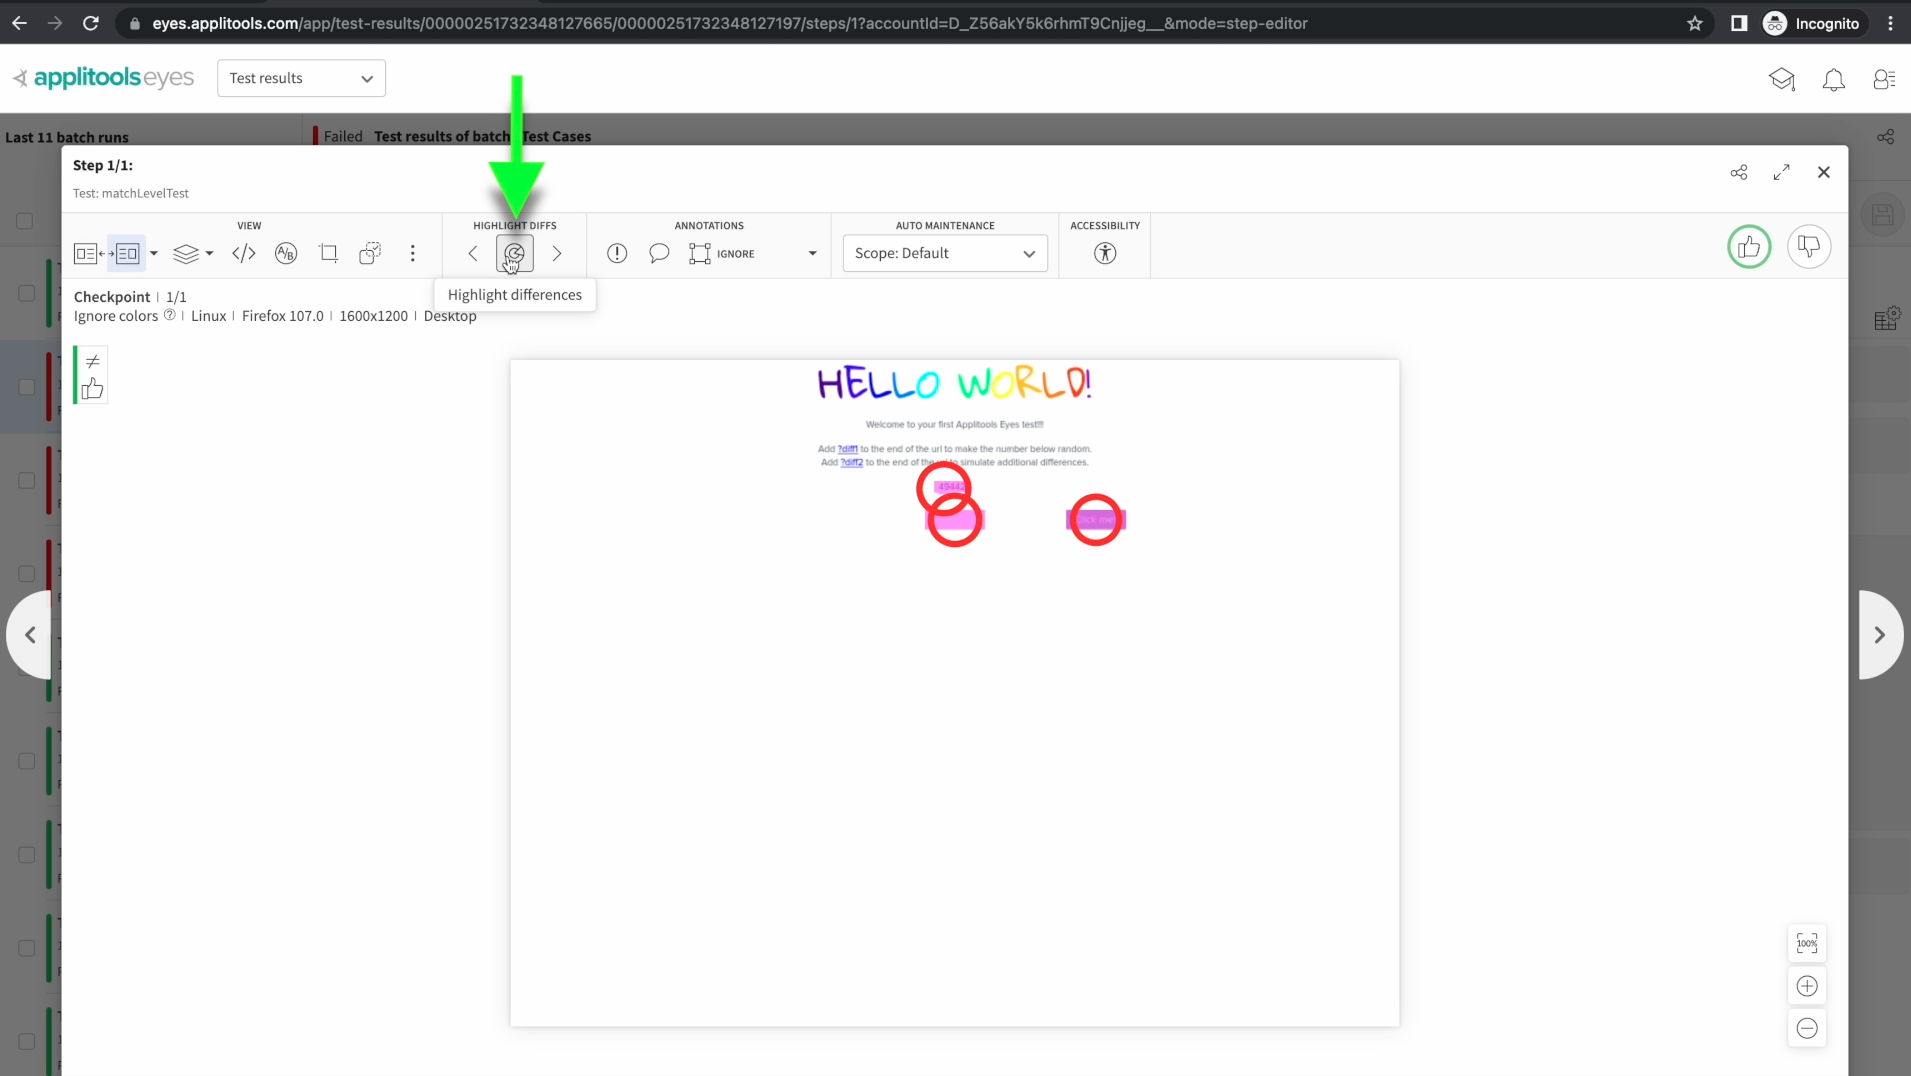
Go ahead and click on one of your images taking us to this familiar view. Clicking on this button will show us where all the diffs are generally located on the image that we're reviewing. Sometimes diffs will be small and images will be large which can make diffs tough to locate. This will help us pinpoint exactly where to look.
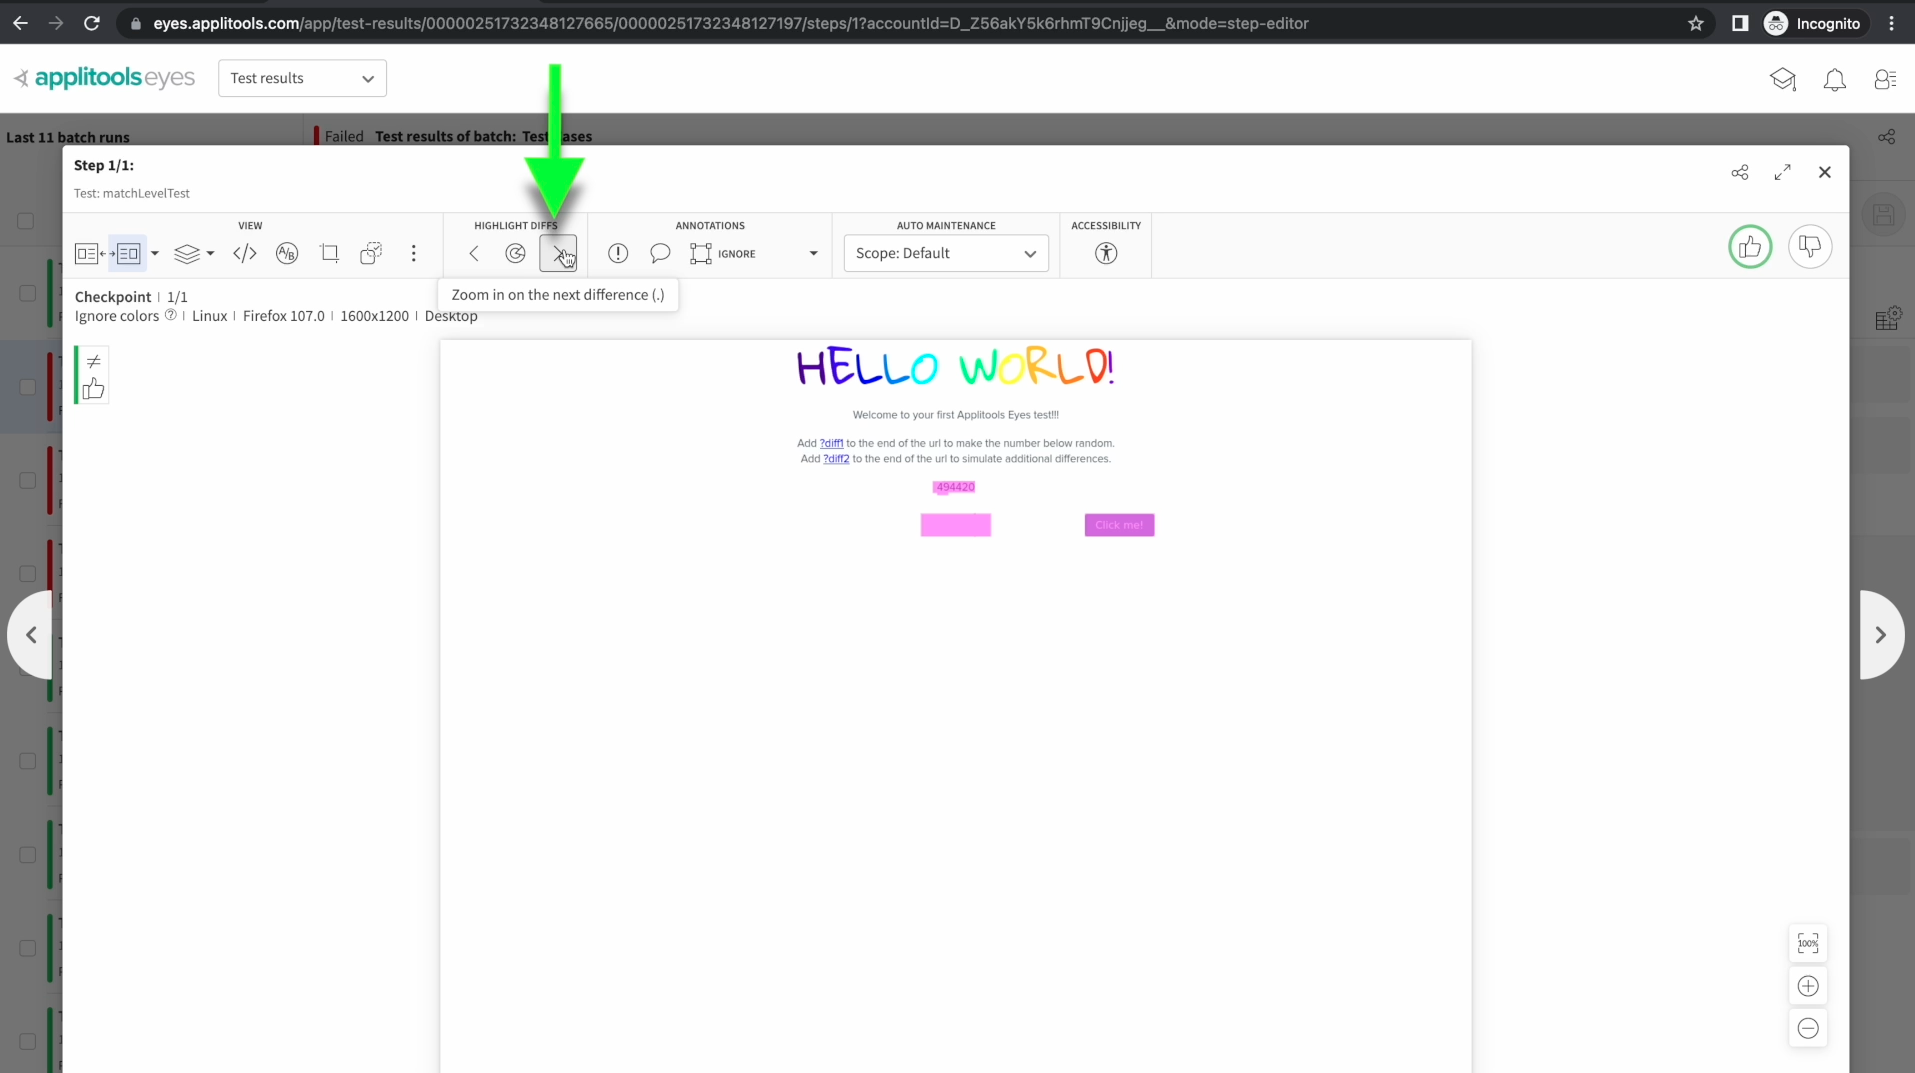
We can also click on one of the arrow buttons to the right or left of this radar button. These buttons will zoom in on each of the differences found and give us a great view of the comparison.
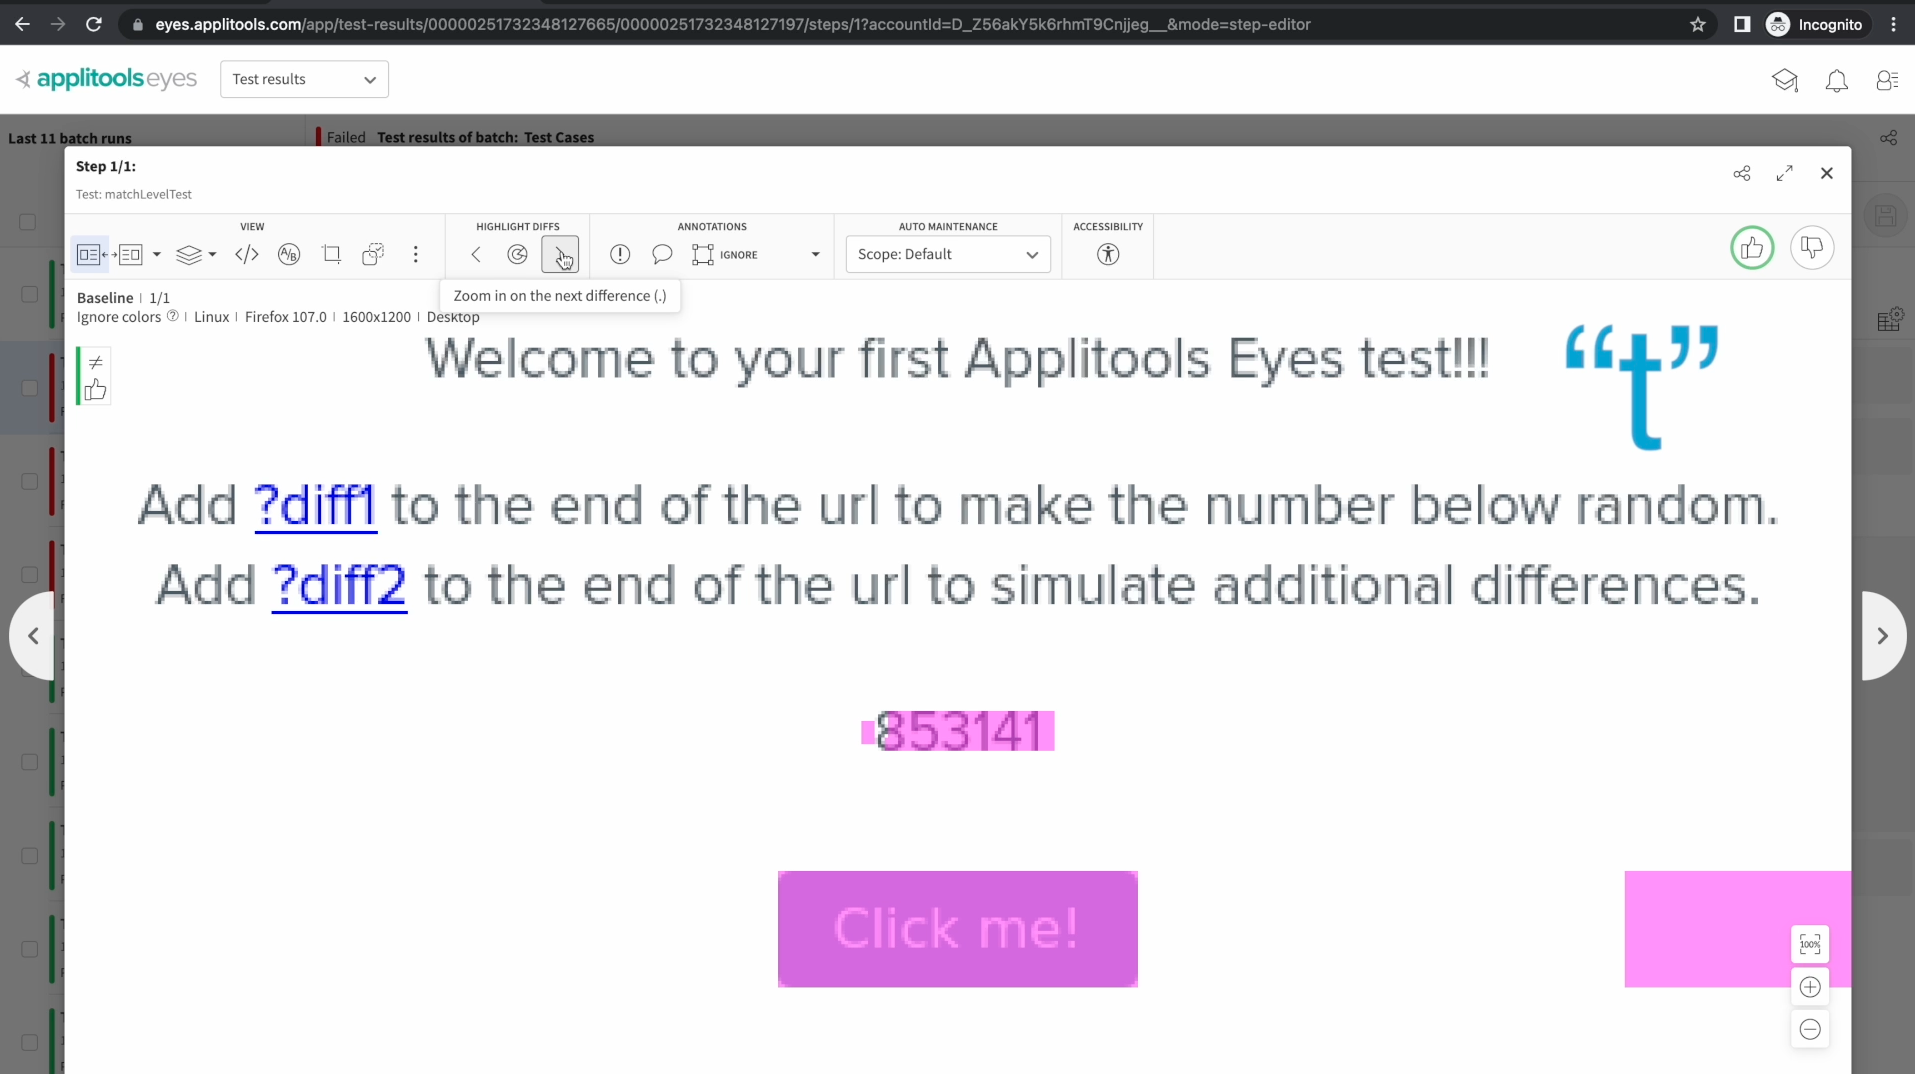
Another good tip for reviewing differences is to toggle between the baseline image and the checkpoint image. Let's first use those arrow buttons to find a difference that we want to look at more closely. Now, if we press T on our keyboard, this will toggle back and forth between the baseline and the checkpoint image. When doing this, we can really see what's changed and better understand why Applitools has flagged this as a diff.
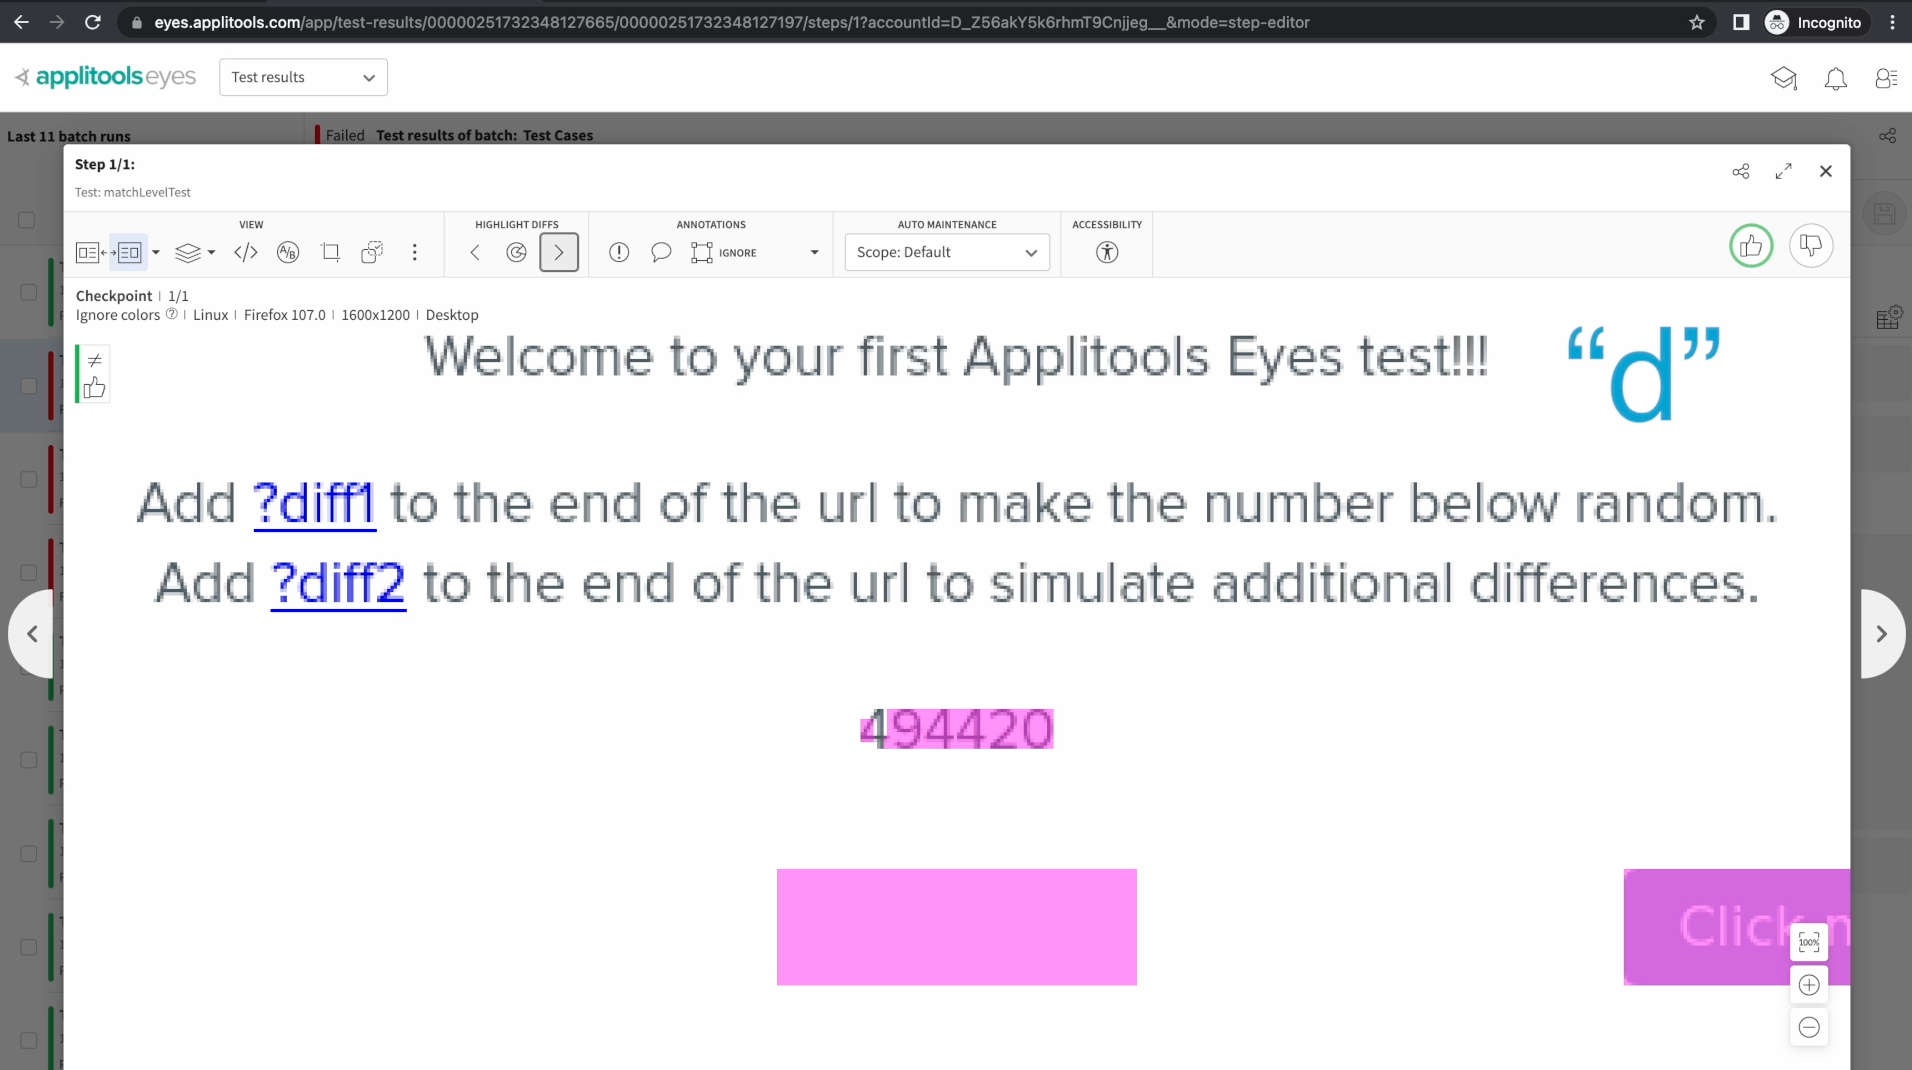
Also, pressing d on our keyboard, will show or hide the pink differences on the screenshots. Turning these off can also make it easier to review what's really changing between our two images.
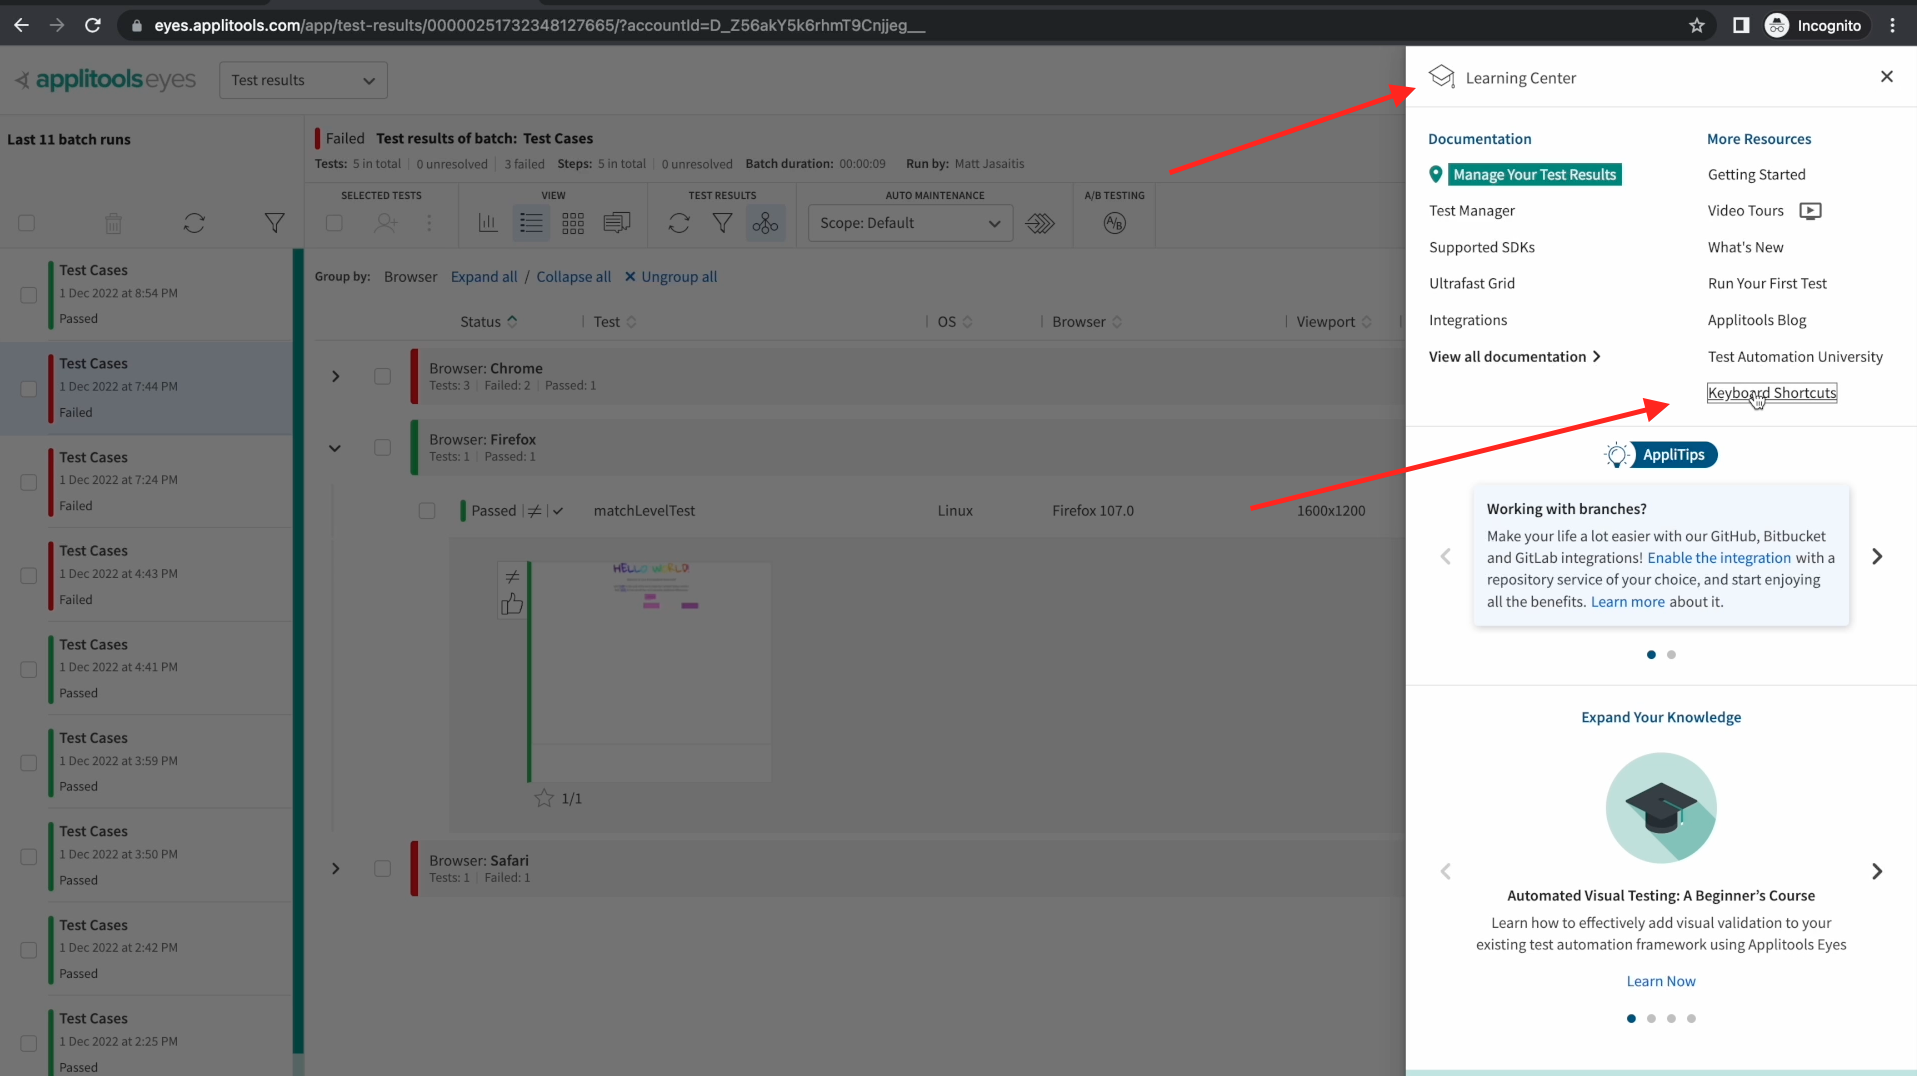
As a side note, I just mentioned a couple of keyboard shortcuts that you can use to quickly navigate through your test results. There are quite a few other shortcuts available to you and you can read all about them by clicking on the Graduation hat icon in the top right followed by keyboard shortcuts.
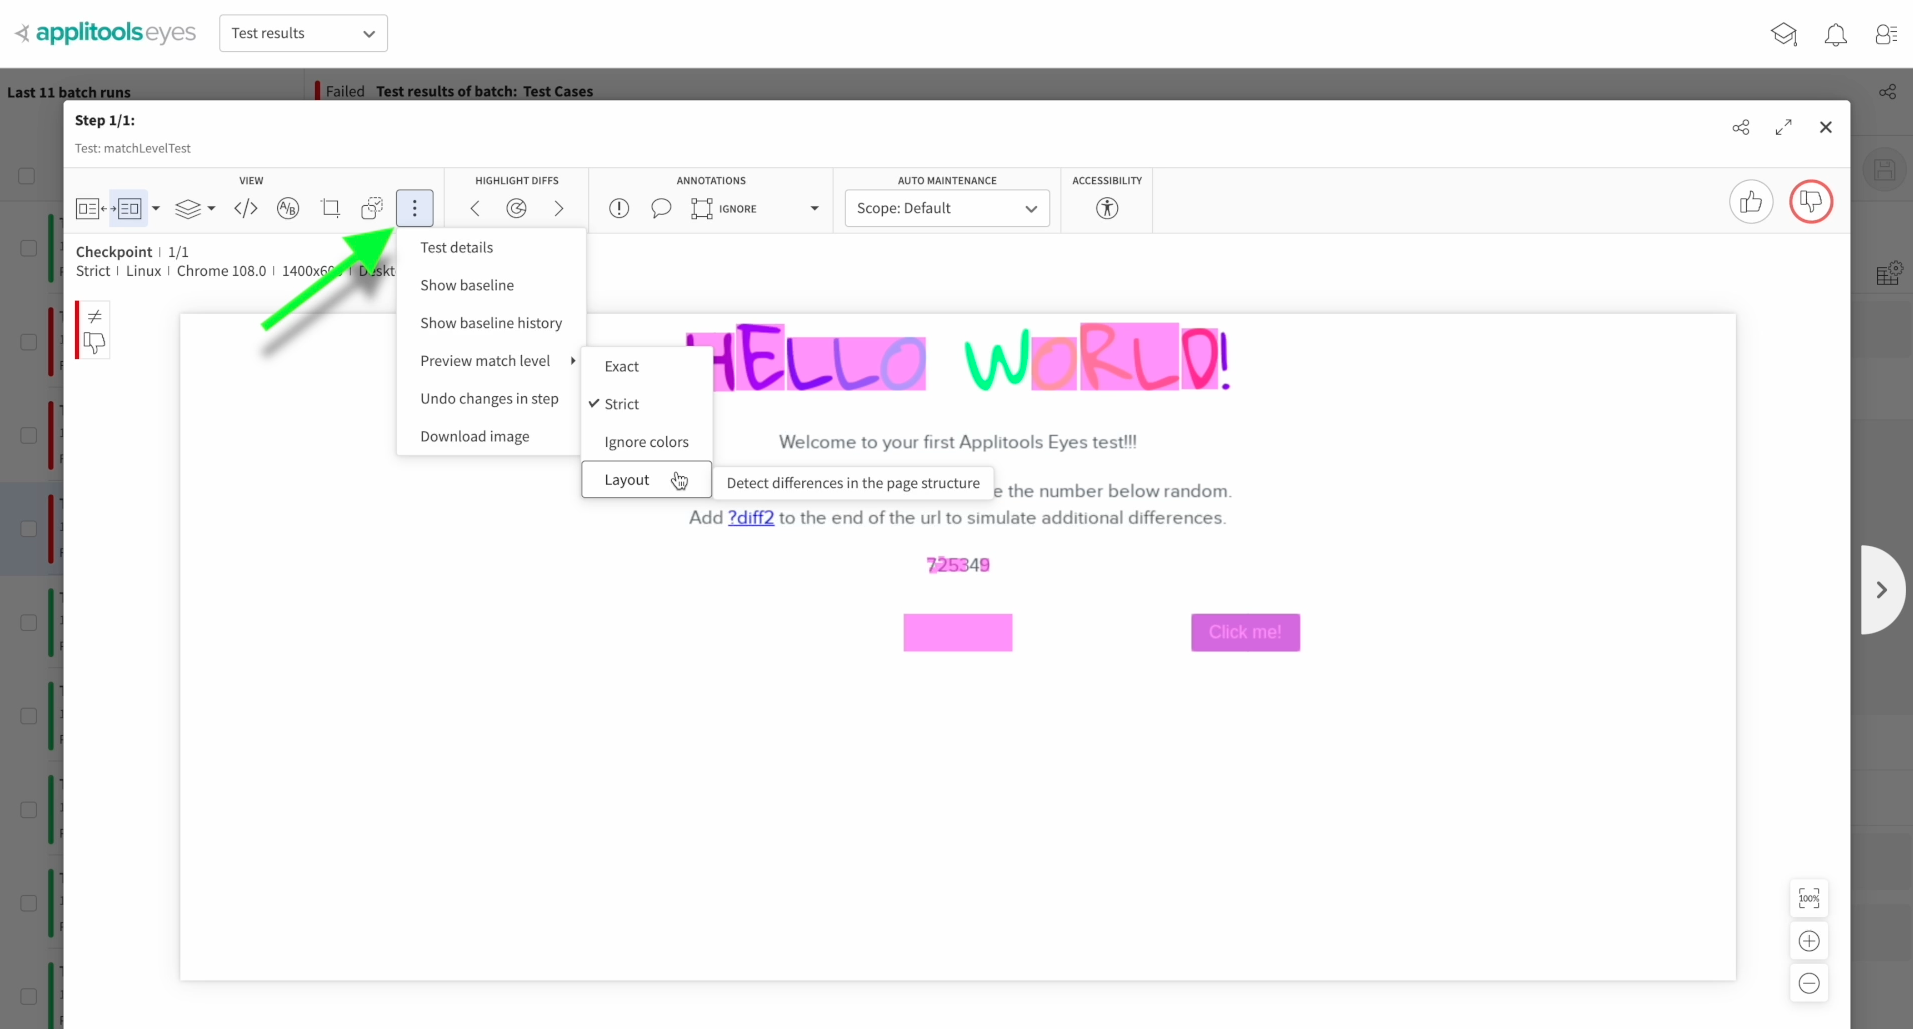
The next feature that I want to highlight is the ability to preview Match Levels. In the last chapter, we ran a bunch of tests showing how each of the Match Levels that Eyes offers handled the comparison of these two images. Let's say we're reviewing our test results and we come across a result that we feel could've been better handled by a different Match Level. Instead of having to re-run our tests with this other Match Level, we can check this right on the dashboard.
By clicking on the 3 dots icon here, we see we have an option to preview a Match Level. We see we can change it to Layout, Ignore Colors or even this other option called Exact if we wanted to see what pixel-to-pixel comparison shows us, though this is not recommended. This can help us decide if we should use a different Match Level at the top level or for a particular region for our future test runs. Let's click on Layout and see what happens.
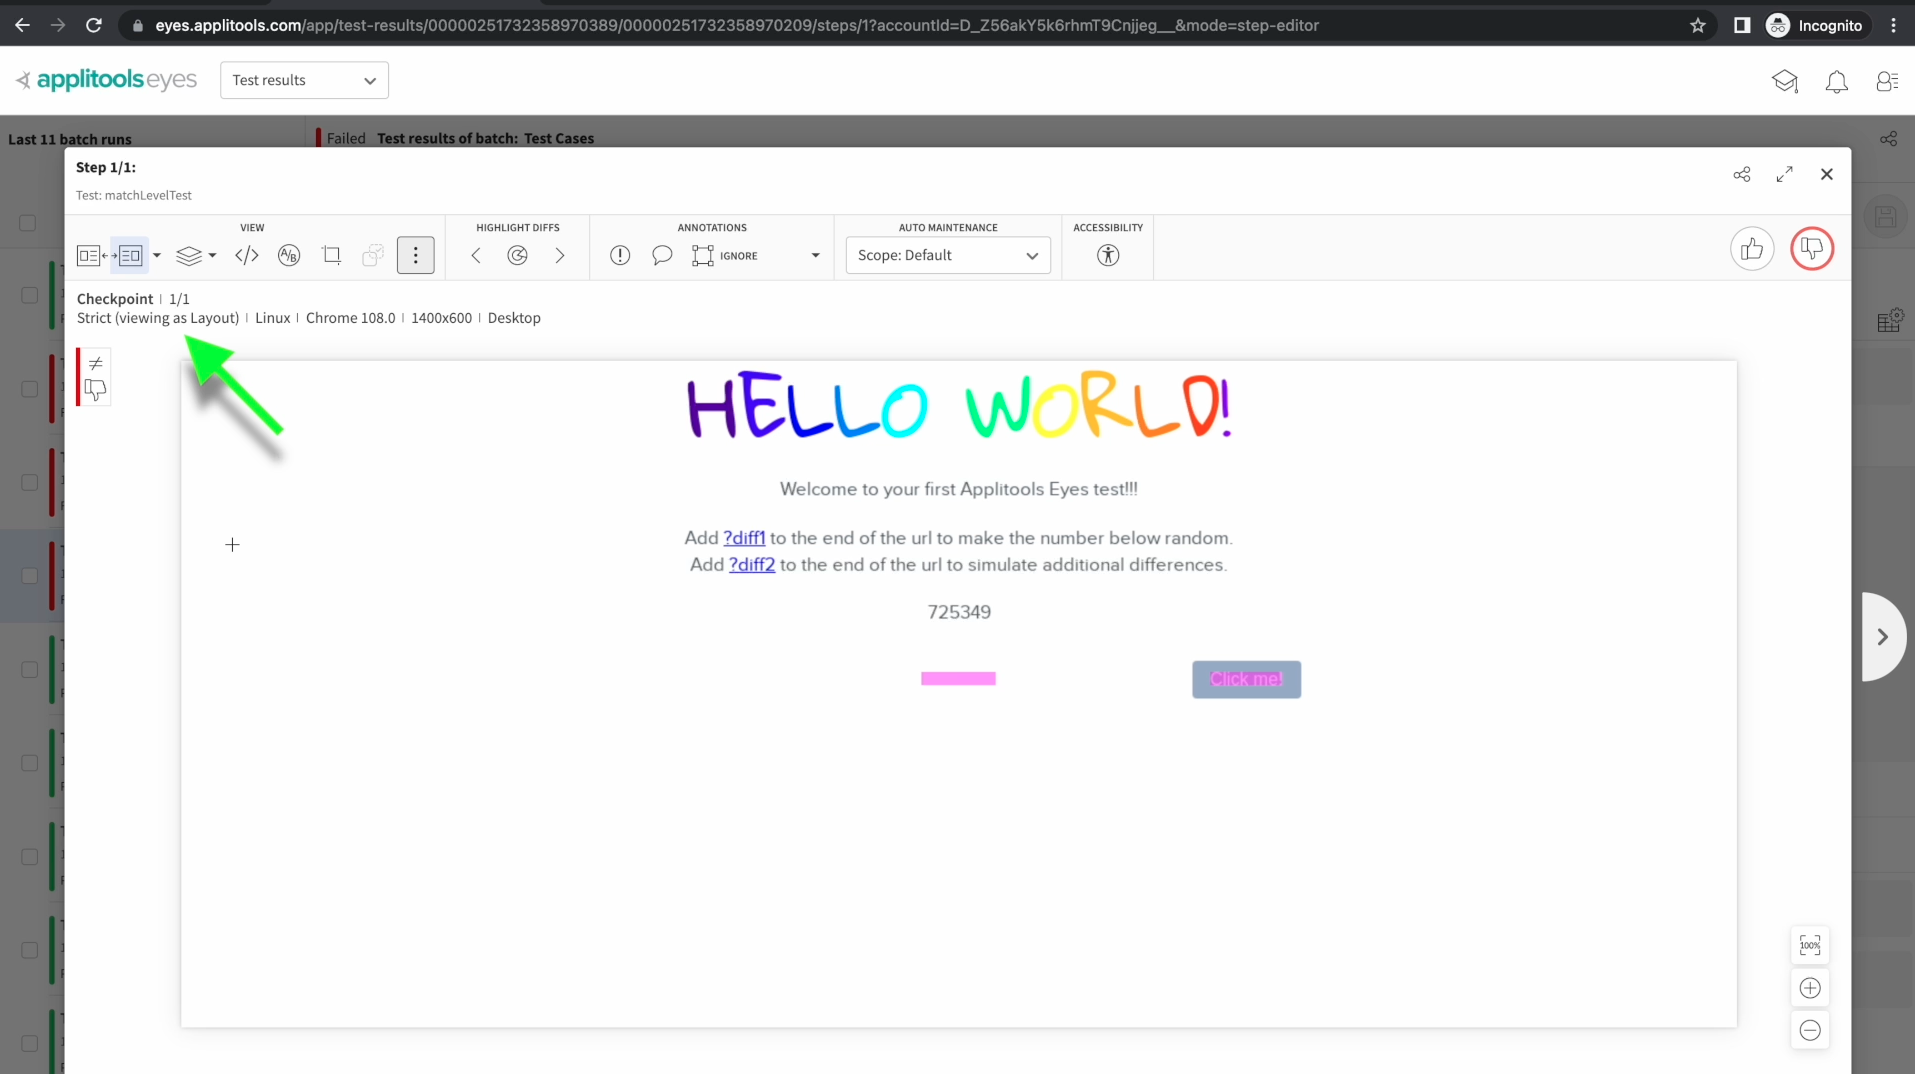
As we can see, we're now comparing our images with the Layout Match Level. To clarify, This won't actually change the status of our test result. This is strictly a temporary check to see if another match could have worked better.
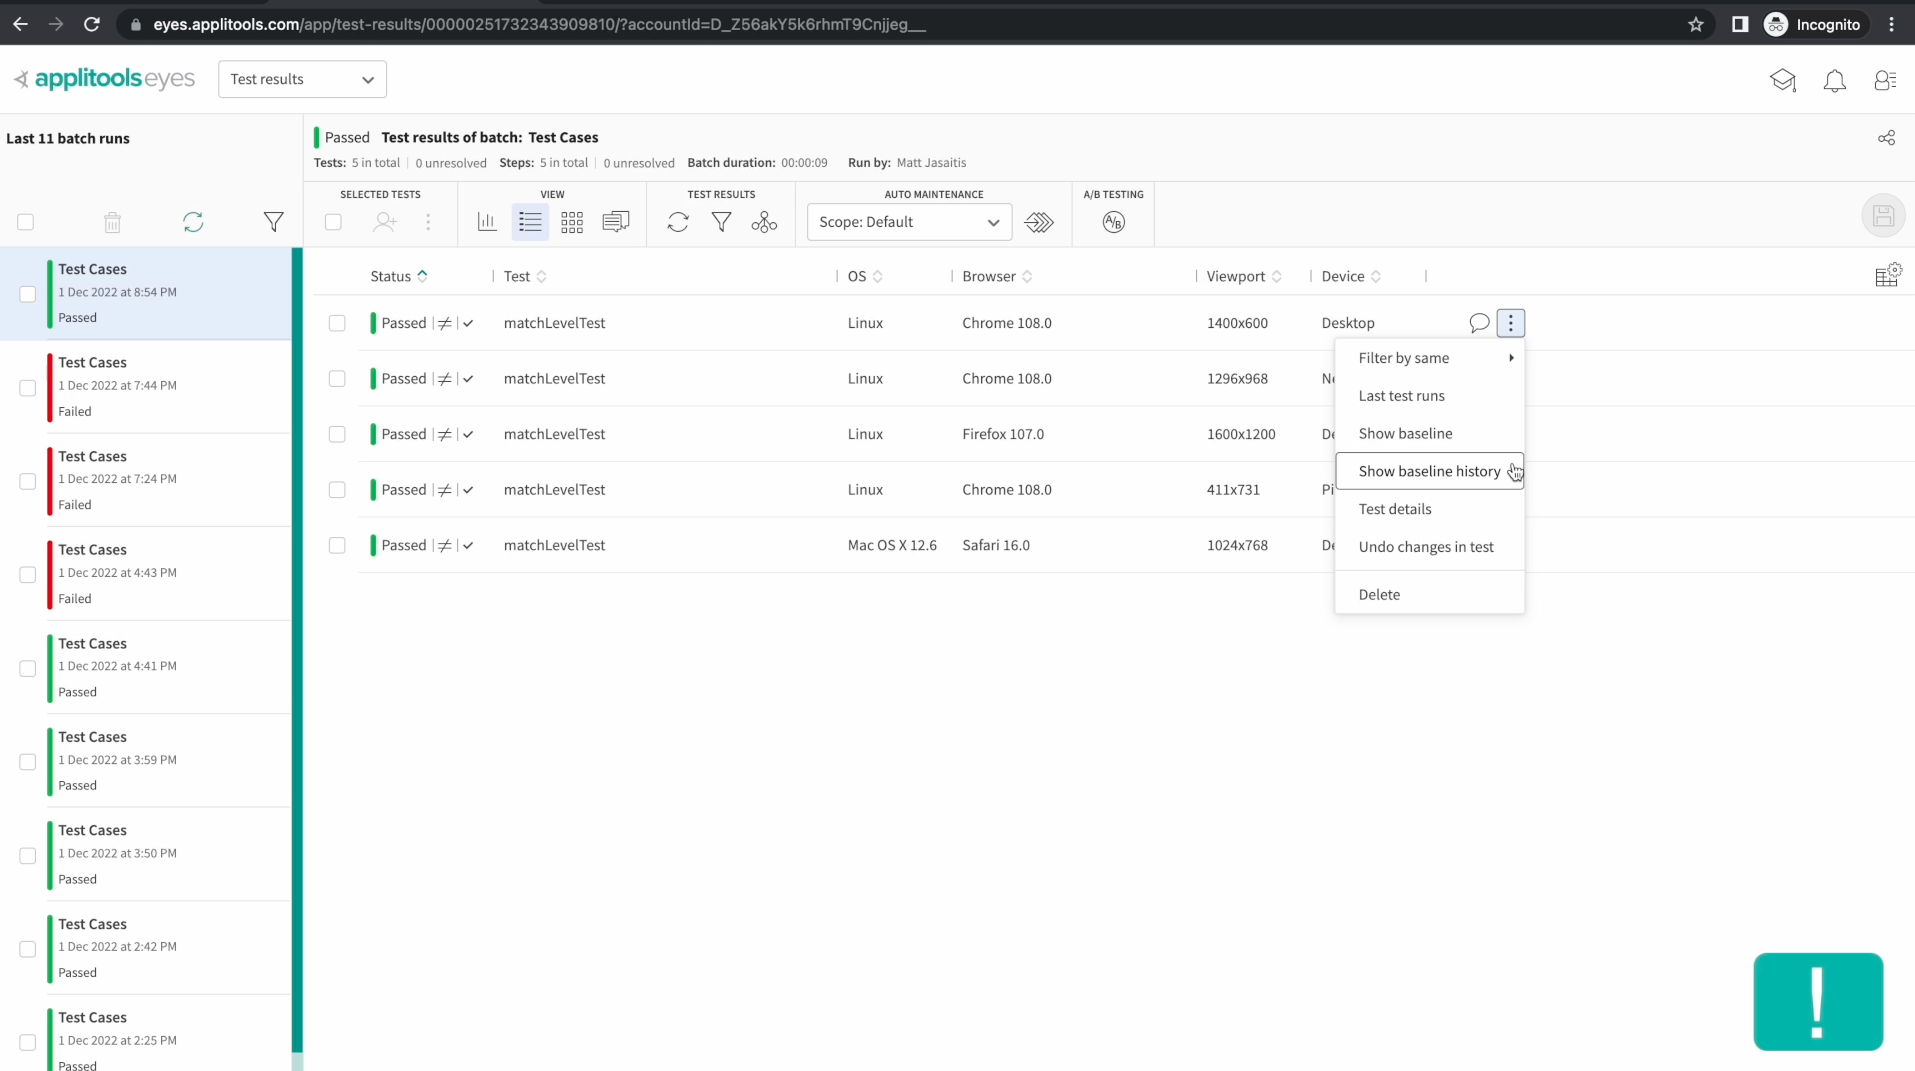
The next screen that I want to highlight is the baseline history screen. Head back the list view and then select the 3 dots at the end of row of one of your test results followed by the baseline history option.
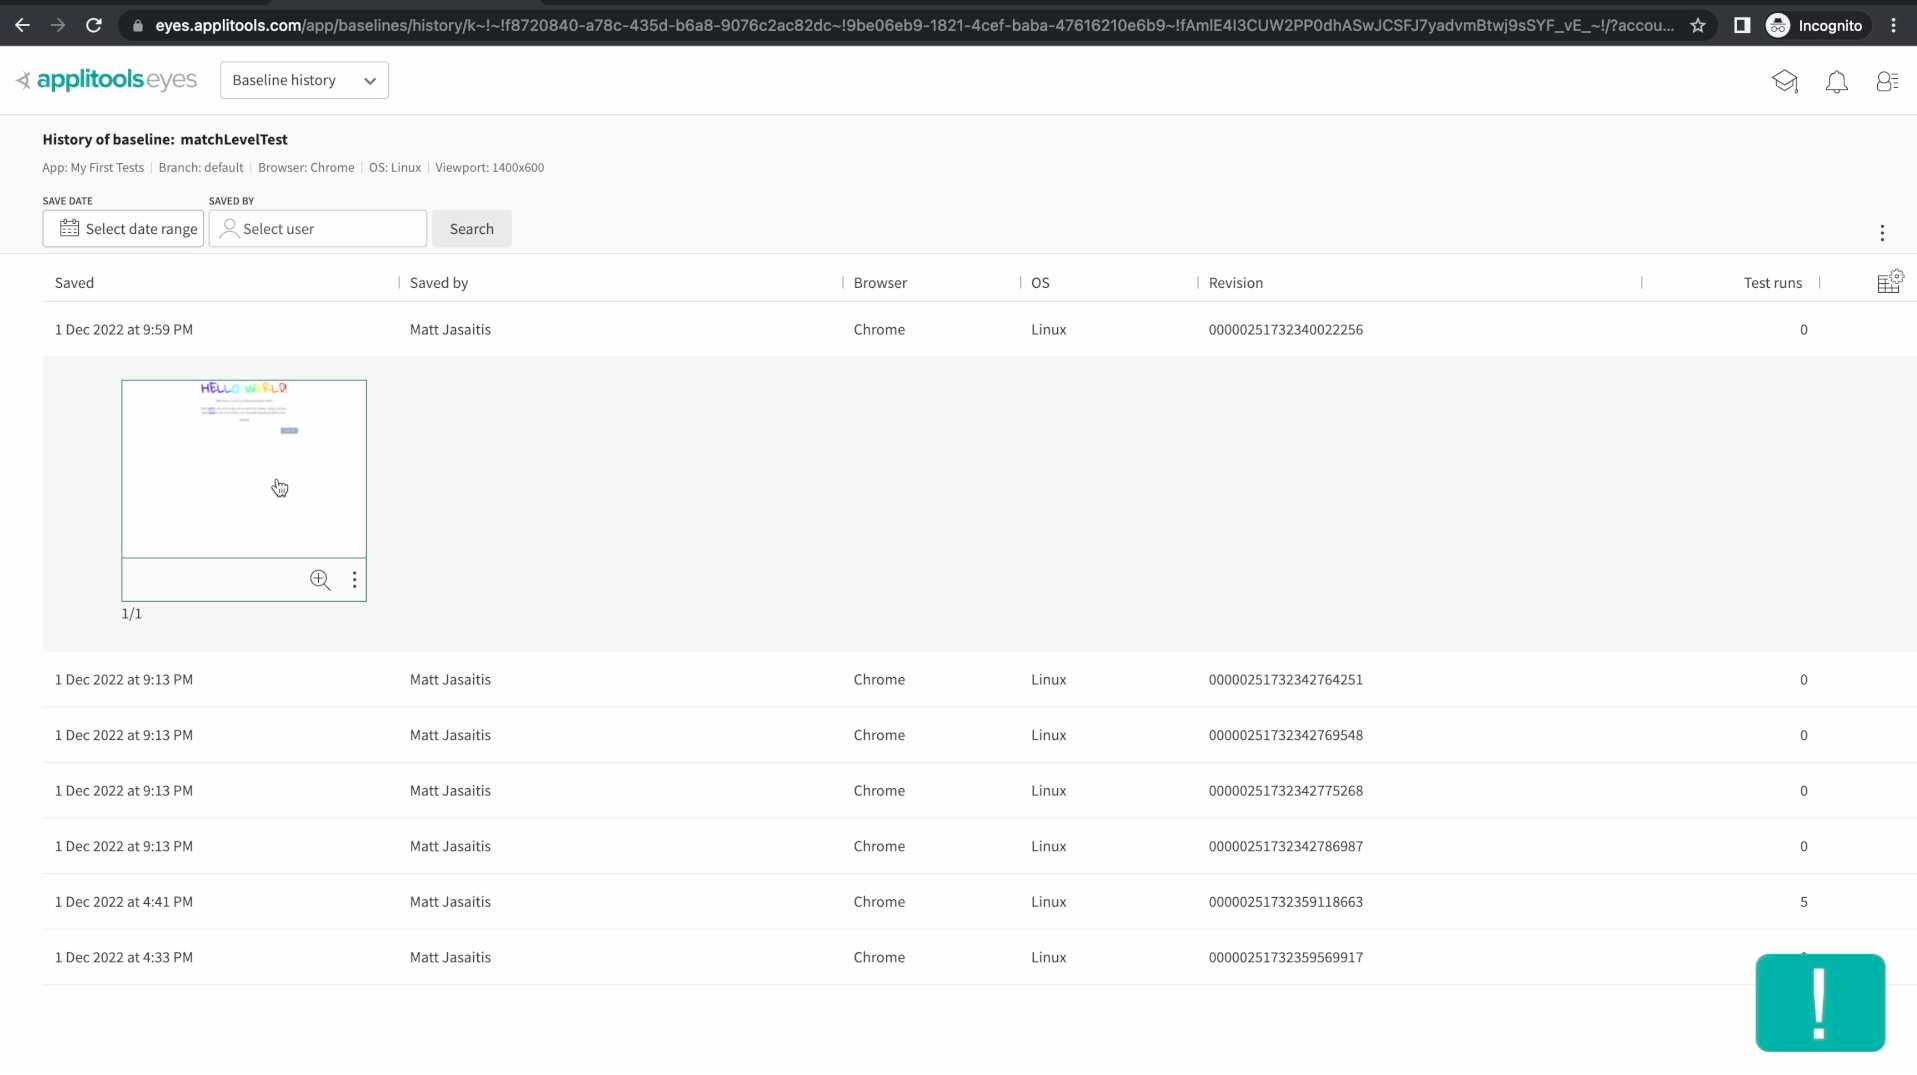
The baseline history screen lists out all the updates to our baseline that we've saved in chronological order. This allows us to see the progression of this test over time and see how our page has evolved. Clicking on a row reveals a thumbnail that when clicked allows for a closer look at the baseline image at that point in time.
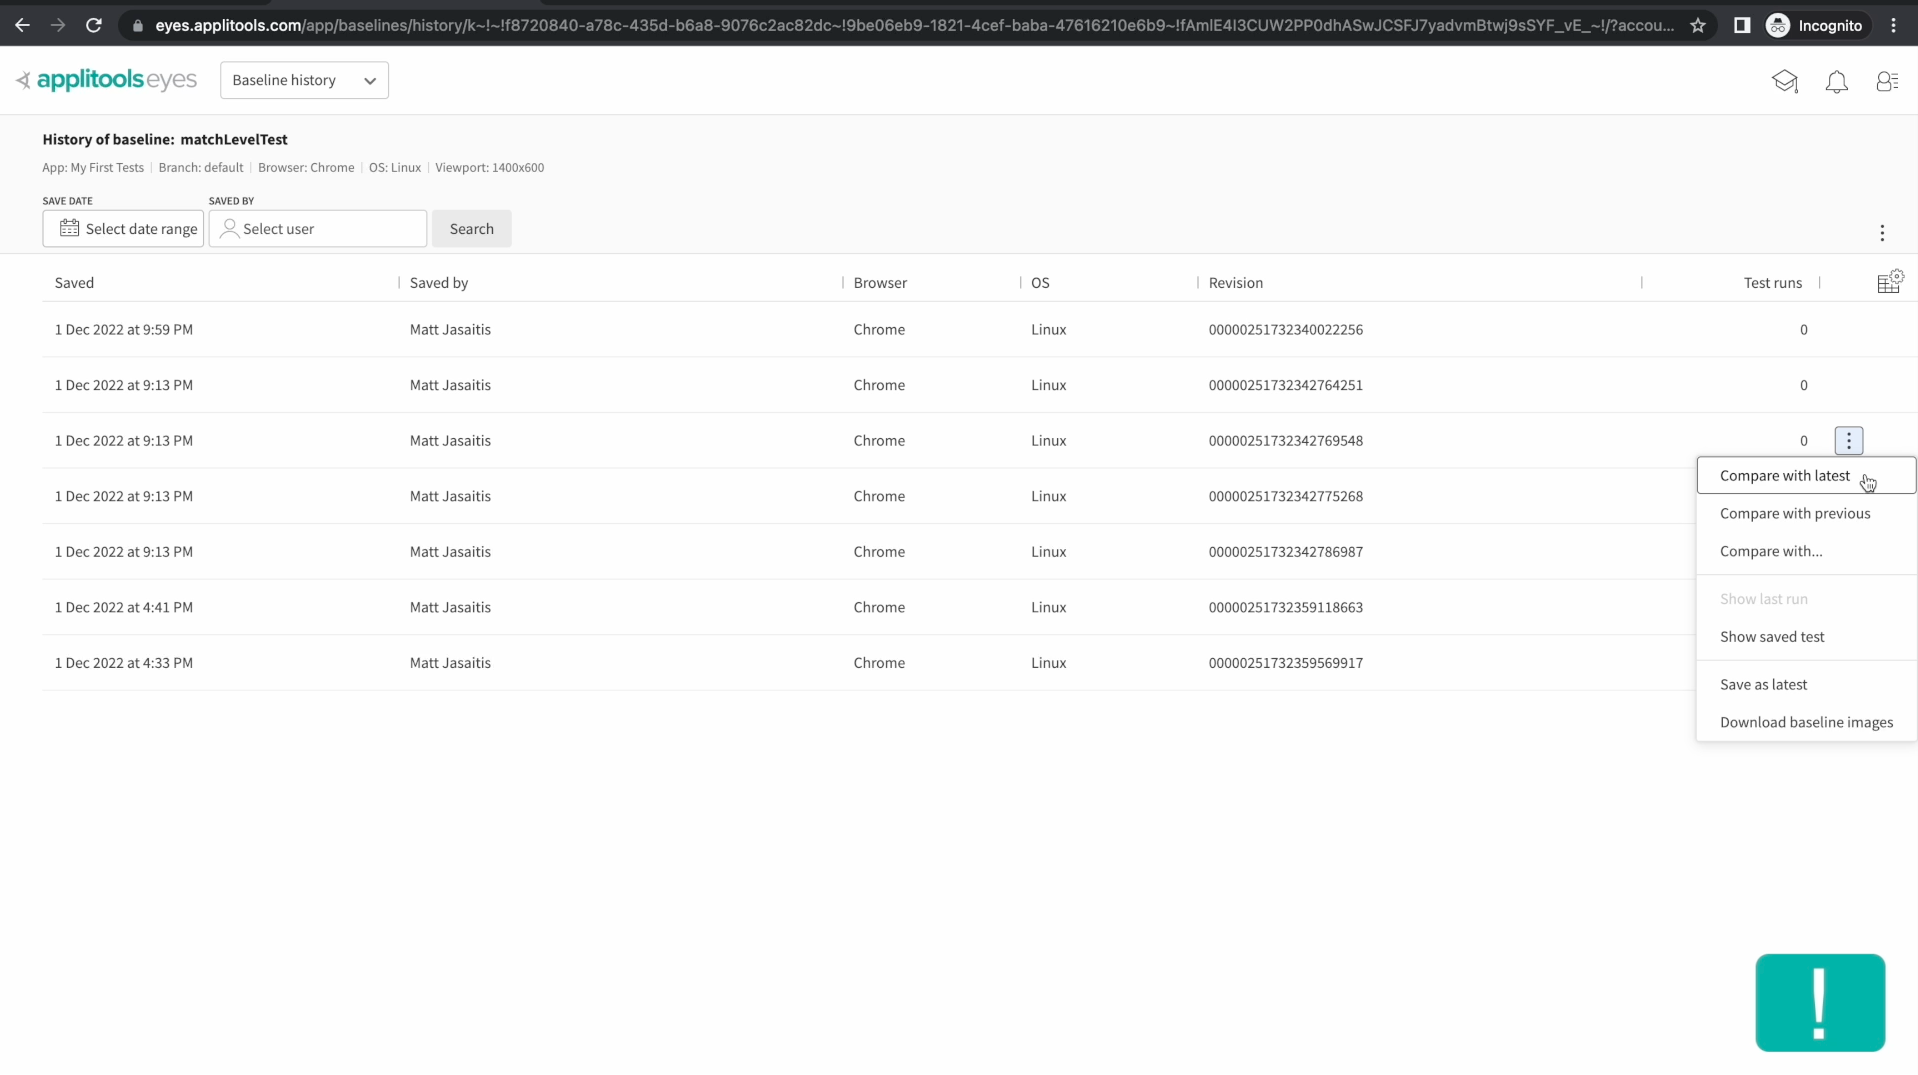
Back on the baseline history screen, if we click on the 3 dots icon on any of these rows, it will reveal some interesting options. We have some options at the top of this dialog that allow us to compare this version of the baseline to another version. For example, selecting compare with latest, will bring us to a screen comparing the old version of this baseline to the latest version.
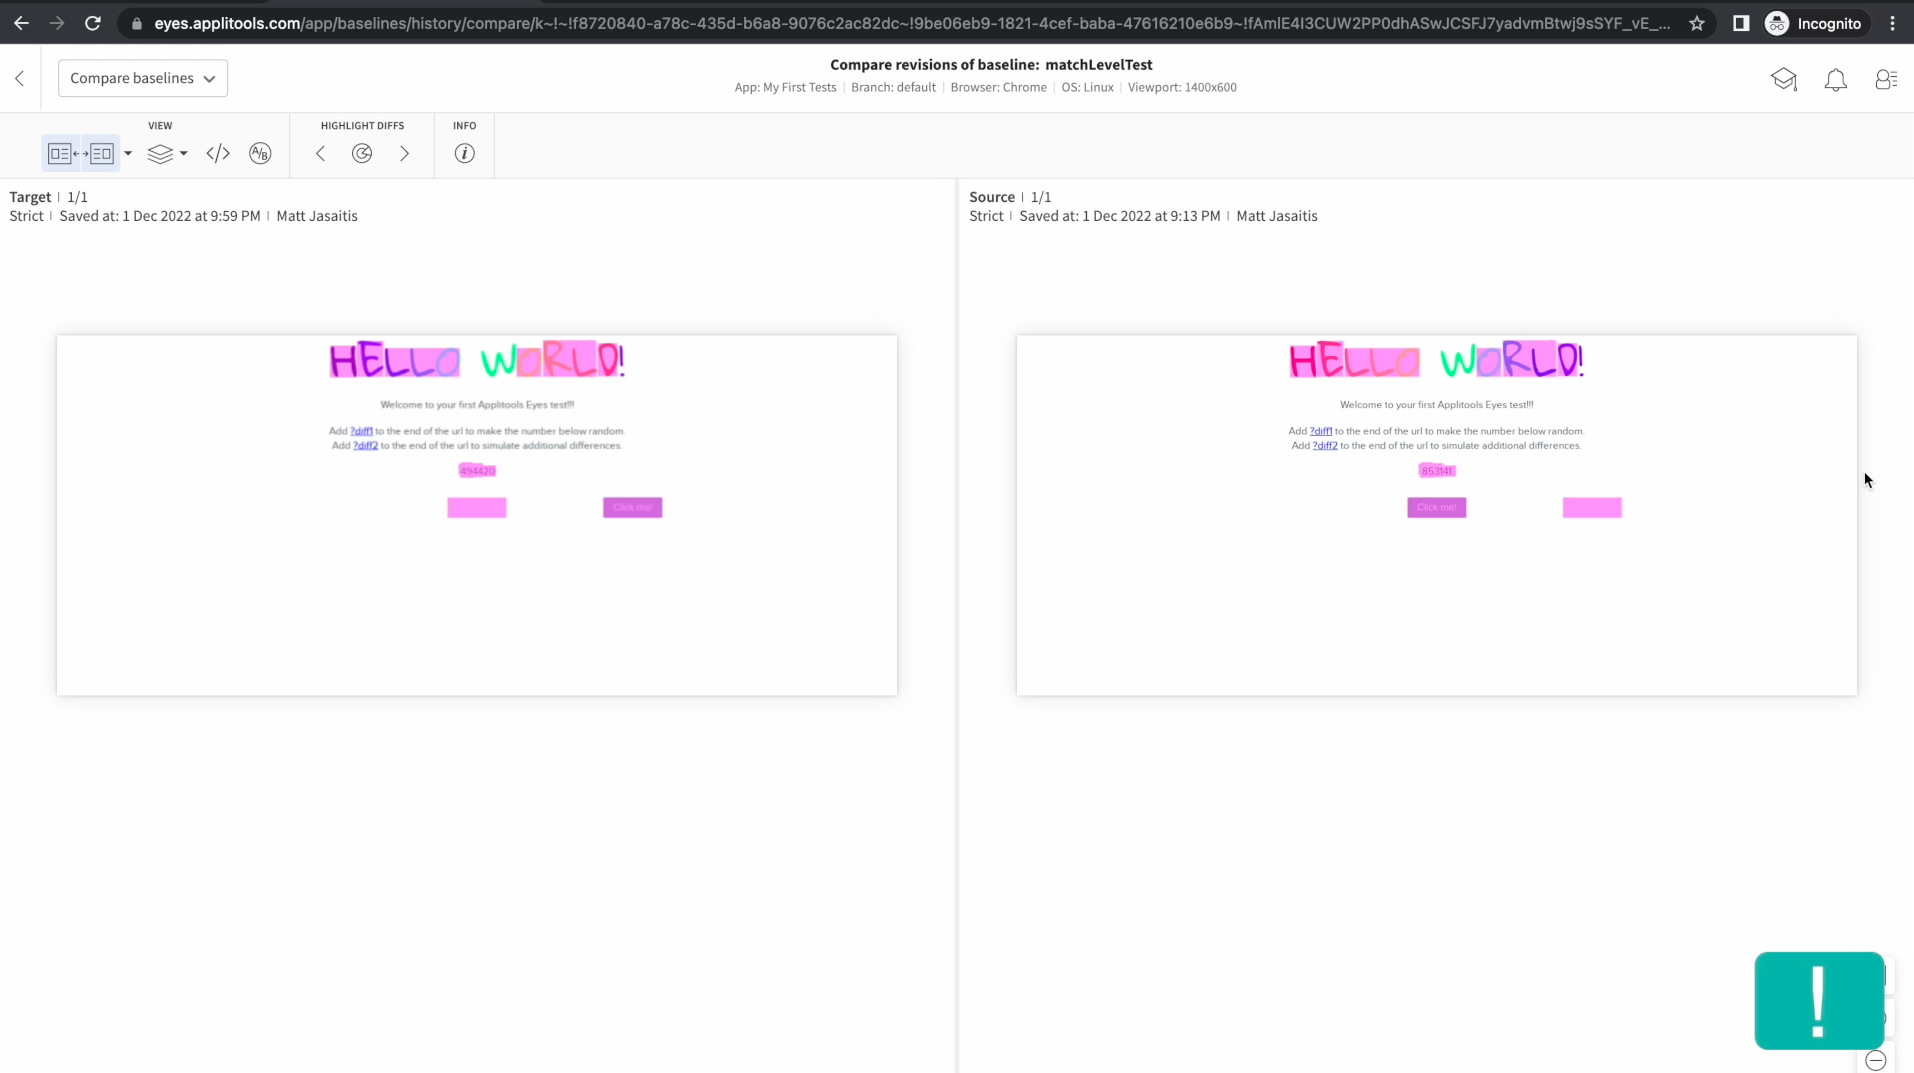
As we can see, just like a normal test result, we can see the differences between these two images.

Another interesting option is the Save as latest option. Selecting this option will save this version of the baseline as the latest baseline going forward. This allows you to revert your baseline back to a previous version at any time.

The last option that I want to highlight here is the show saved test option. This will take you to the batch where this baseline was saved. This allows for quick navigation back to your test results so you can review this baseline in the context of its batch.
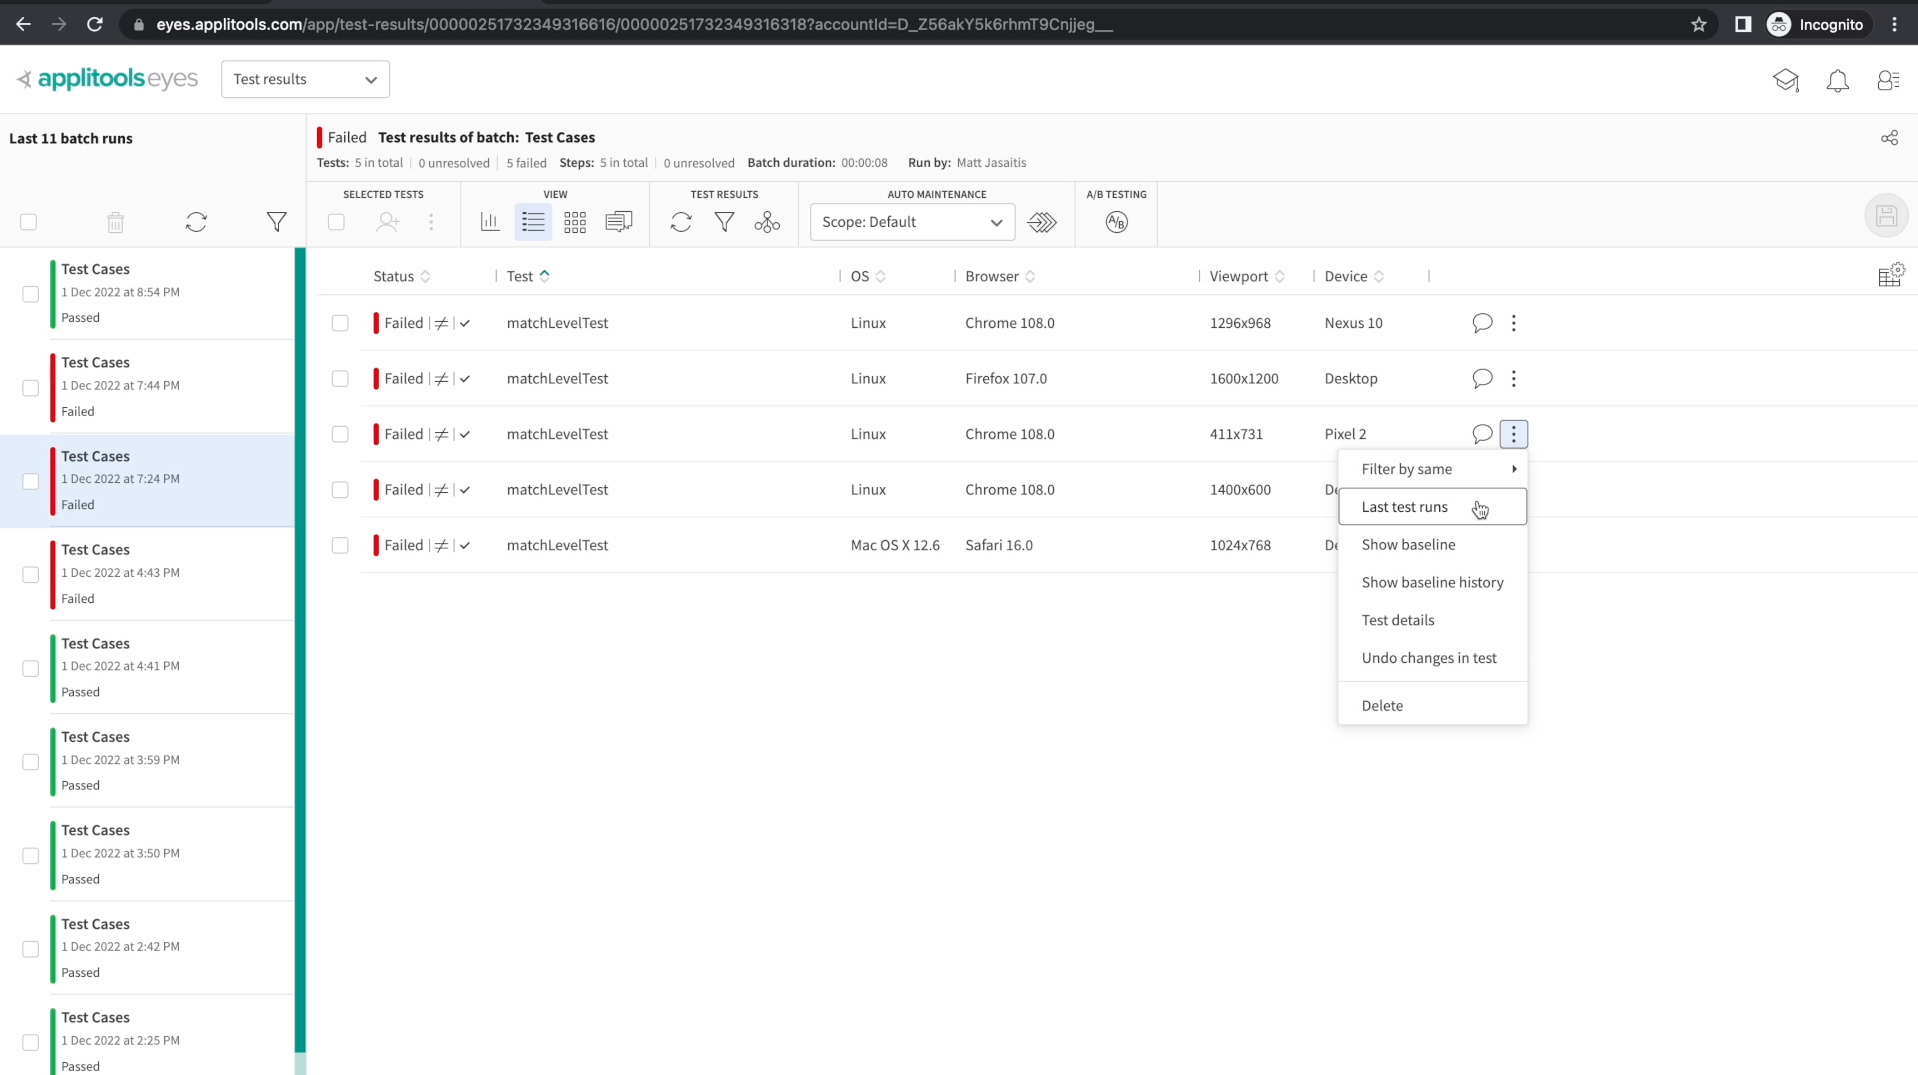
The last thing that I want to highlight in this chapter is the last test runs screen. Back in our list view once again, click the 3 dots on any of your tests followed by the last test runs option.
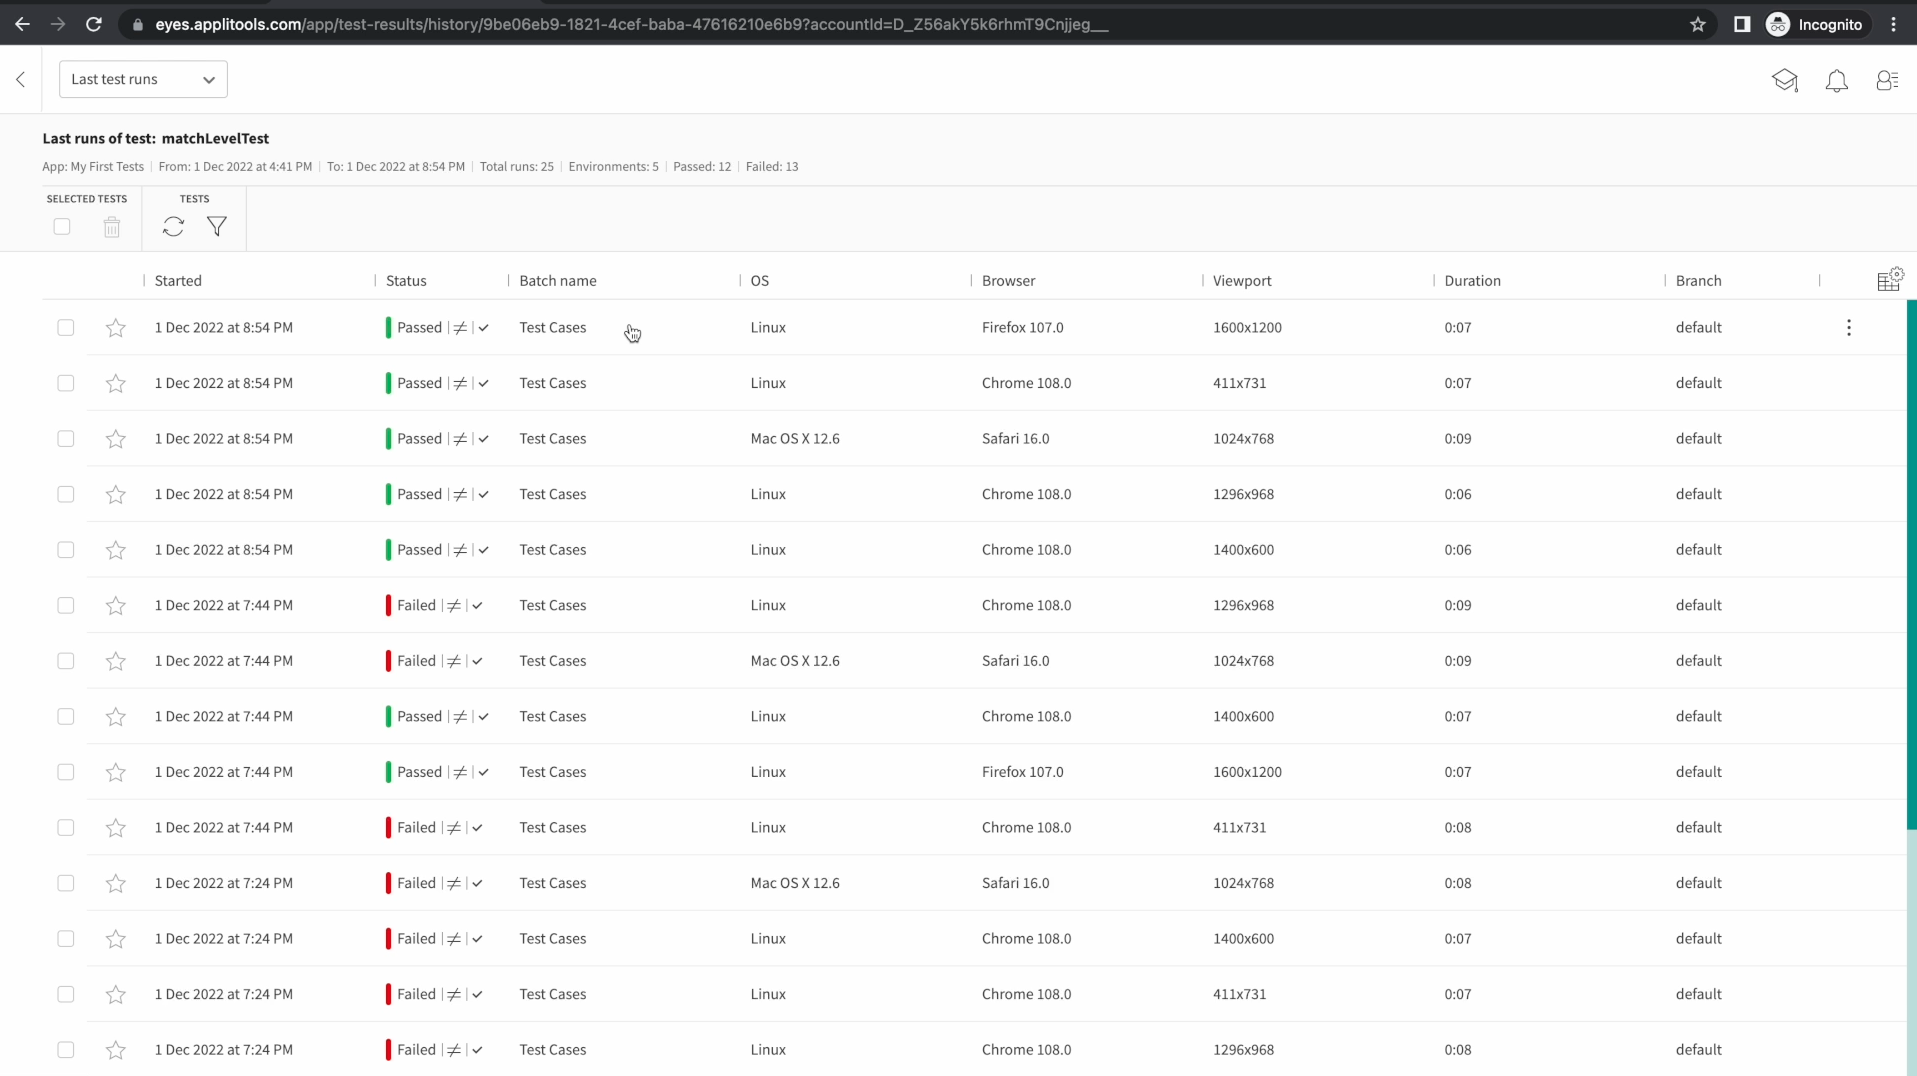
On the baseline history screen that we looked at in the last section, it only showed test runs where the baseline was updated or saved. This screen shows all test runs regardless of whether they changed the baseline or not.
This view offers a great summary of all of the historic test runs performed for this test. It's a great way to focus on a specific test and see how it's progressed over time. If we click on one of the rows, it will take us to the batch on the test results screen.
In this chapter, we took a closer look at the Applitools dashboard and learned about some advanced techniques for reviewing our test results and easily finding historic test runs.
We checked out some new screens such as the Baseline History Screen and the last test runs screen. We learned about some tips for reviewing differences flagged by the Eyes AI and also saw how to filter and group our test results.
As always, feel free to reach out to us on the support channels mentioned earlier if you have any questions about the content covered in this chapter. Otherwise, I'll see you in the next chapter.
