

Transcripted Summary
Let's start by creating a new Cypress project.
I have an empty folder here that's called cypress-basic-tau and I'm going to open my Terminal.
The first thing you need to make sure of is that you have Node installed.
To check that, you can type node -v into your Terminal.
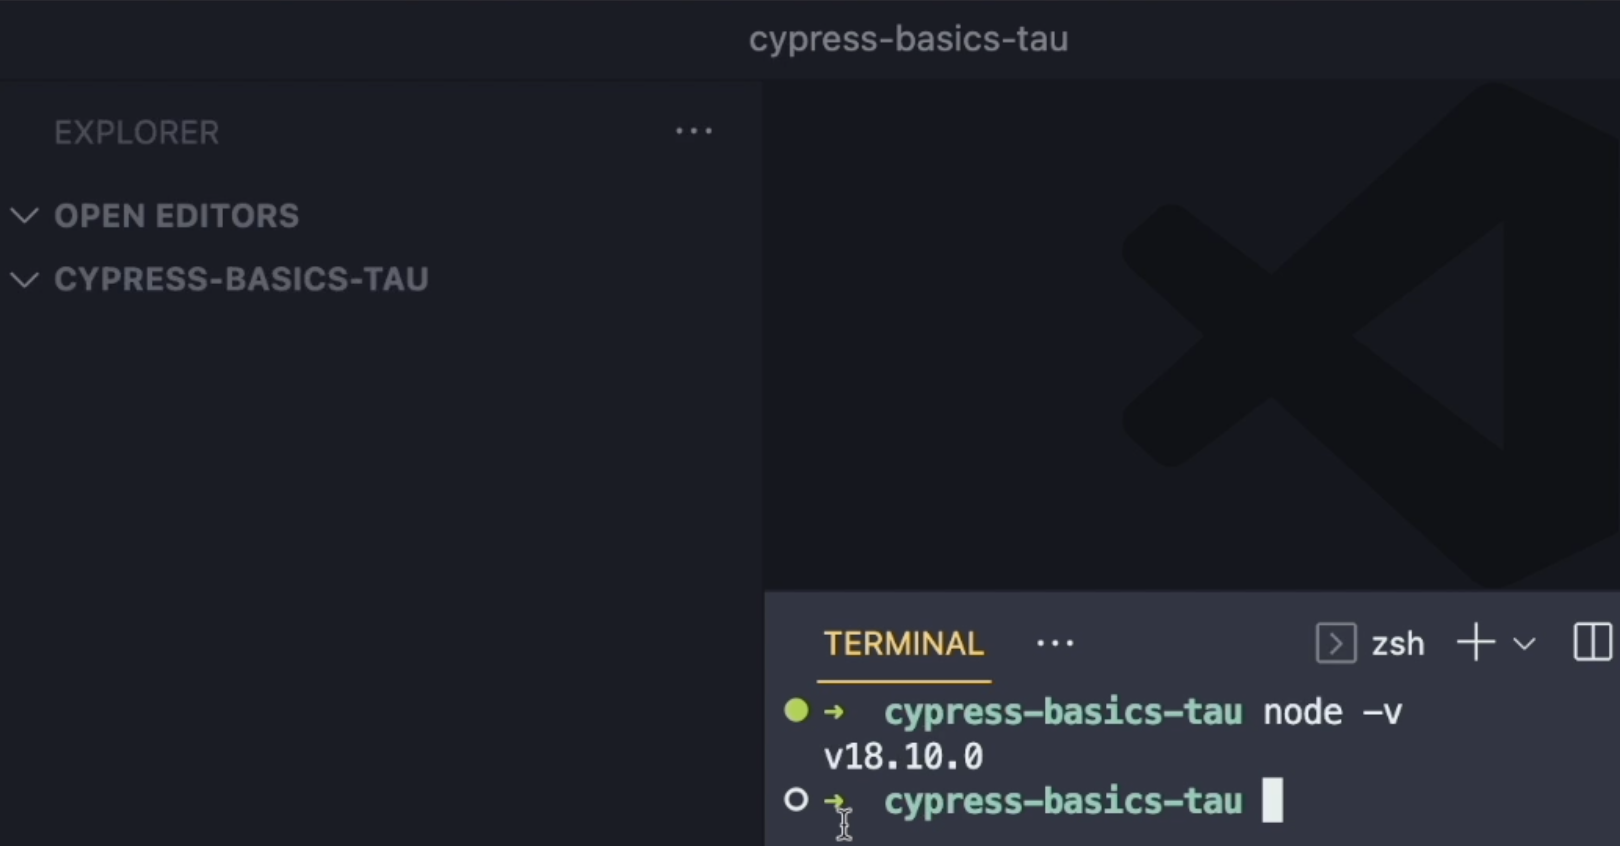
If you get a number version, then that's all okay.
My current version is version 18, but you should be fine with version 16 as well.
If instead you get an error, you'll need to visit the page nodejs.org, and then click on Download.
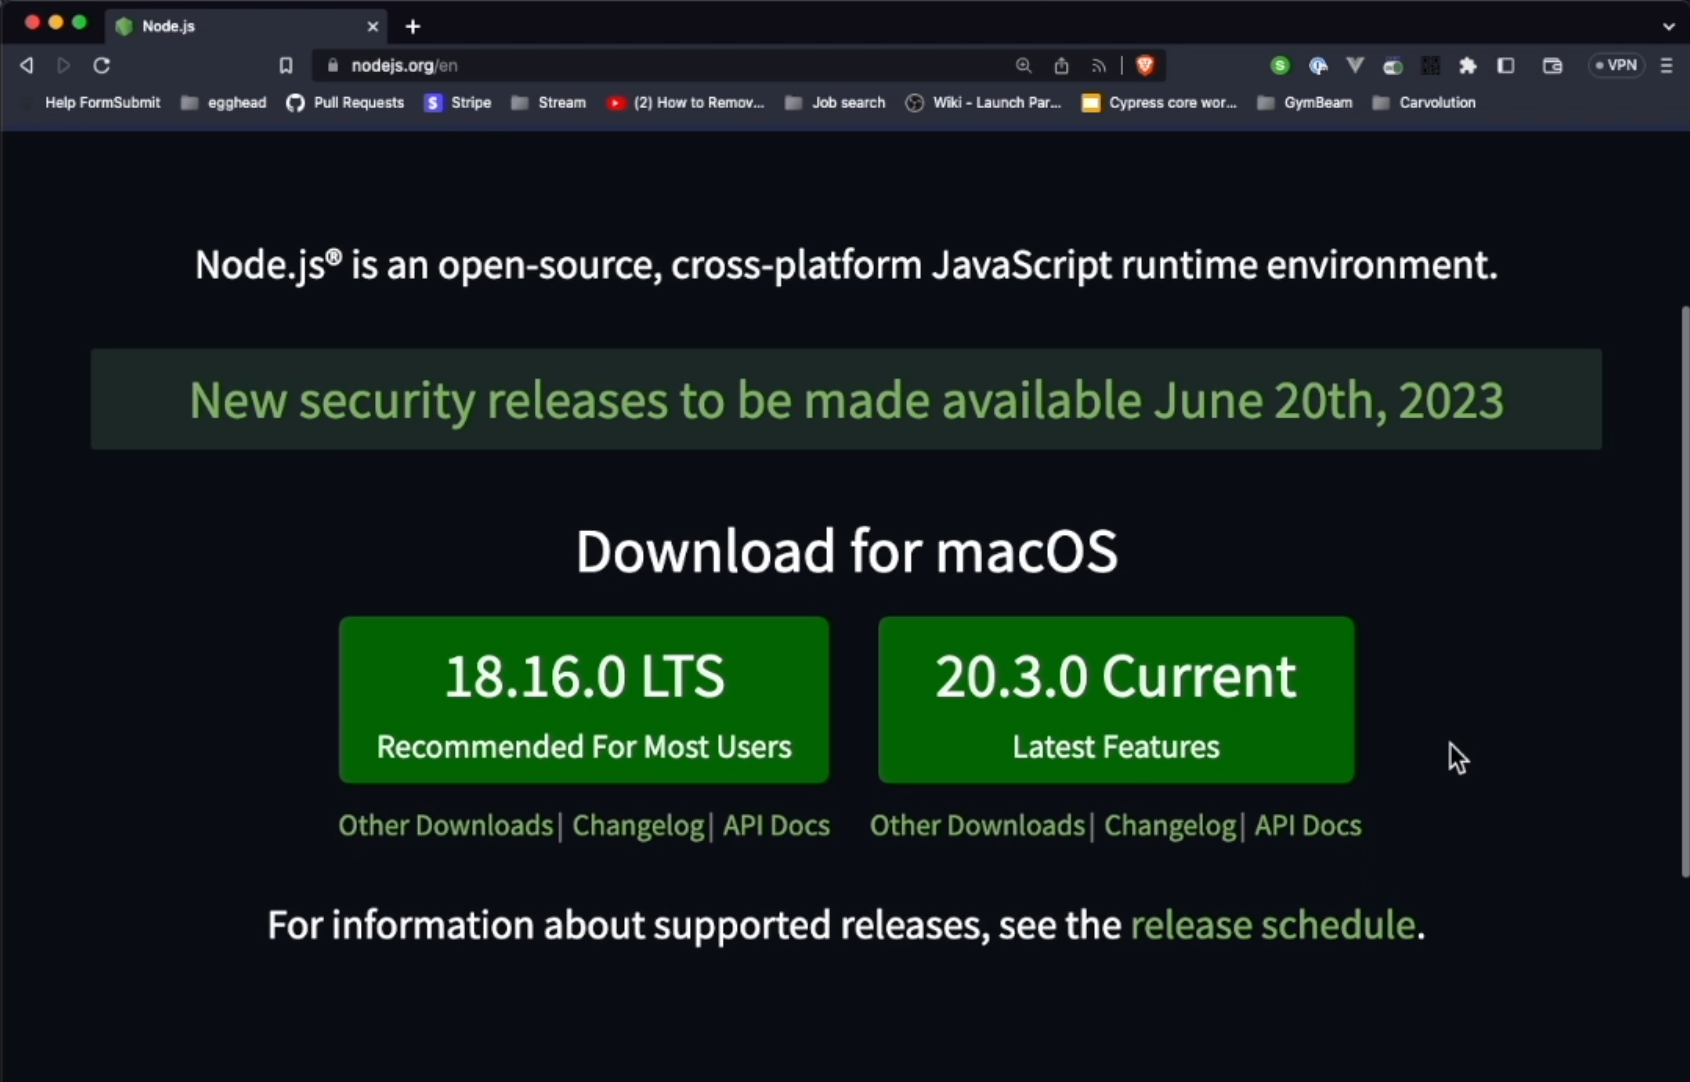
You can either choose the LTS version or the current one - it doesn't really matter as soon as you have Node installed on your computer.
The installation is as easy as making a download and doing the installation, so there's no advanced stuff there.
Now that we know that we have Node installed we are going to initialize a Node project - so our cypress-basics-tau will become a Node project.
To do that, I'm going to type npm init.
When I hit "enter", I will get this nice walkthrough that will ask me a bunch of questions.
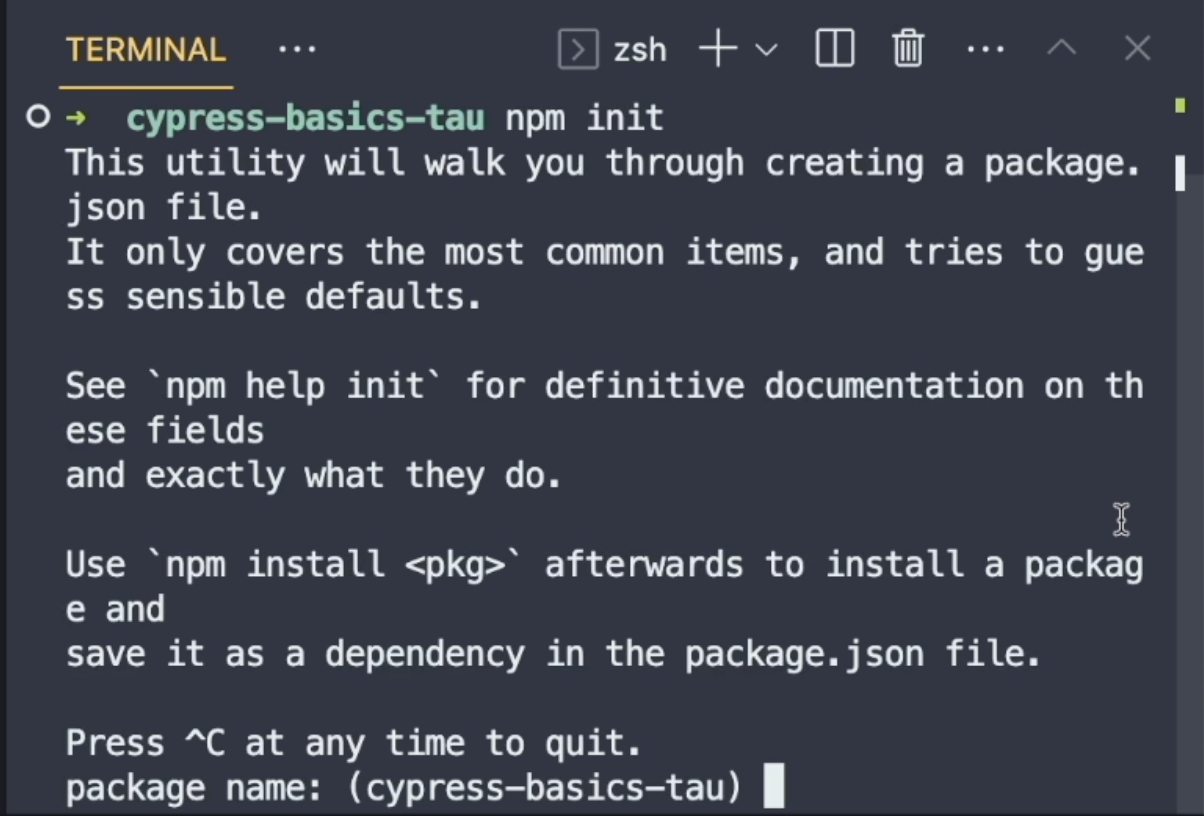
For example, how I want to name the package, what will be the version of my package, description and so on.
I'm going to quit this now and do npm init with an argument -y which essentially means say yes to every question.
When I hit that, it's just going to take all my defaults.
All of those questions and all of that information serves for creating this package.json file.
Every Node project will contain this package.json file that contains information about the project.
Let me go back to the Terminal and finally add Cypress into this project.
To do that I will do npm install cypress.
When I do that, Cypress is going to install in my project along with all of the dependencies.
You can now see in package.json we have this dependencies part where it says that cypress was installed in version 12.4.0.
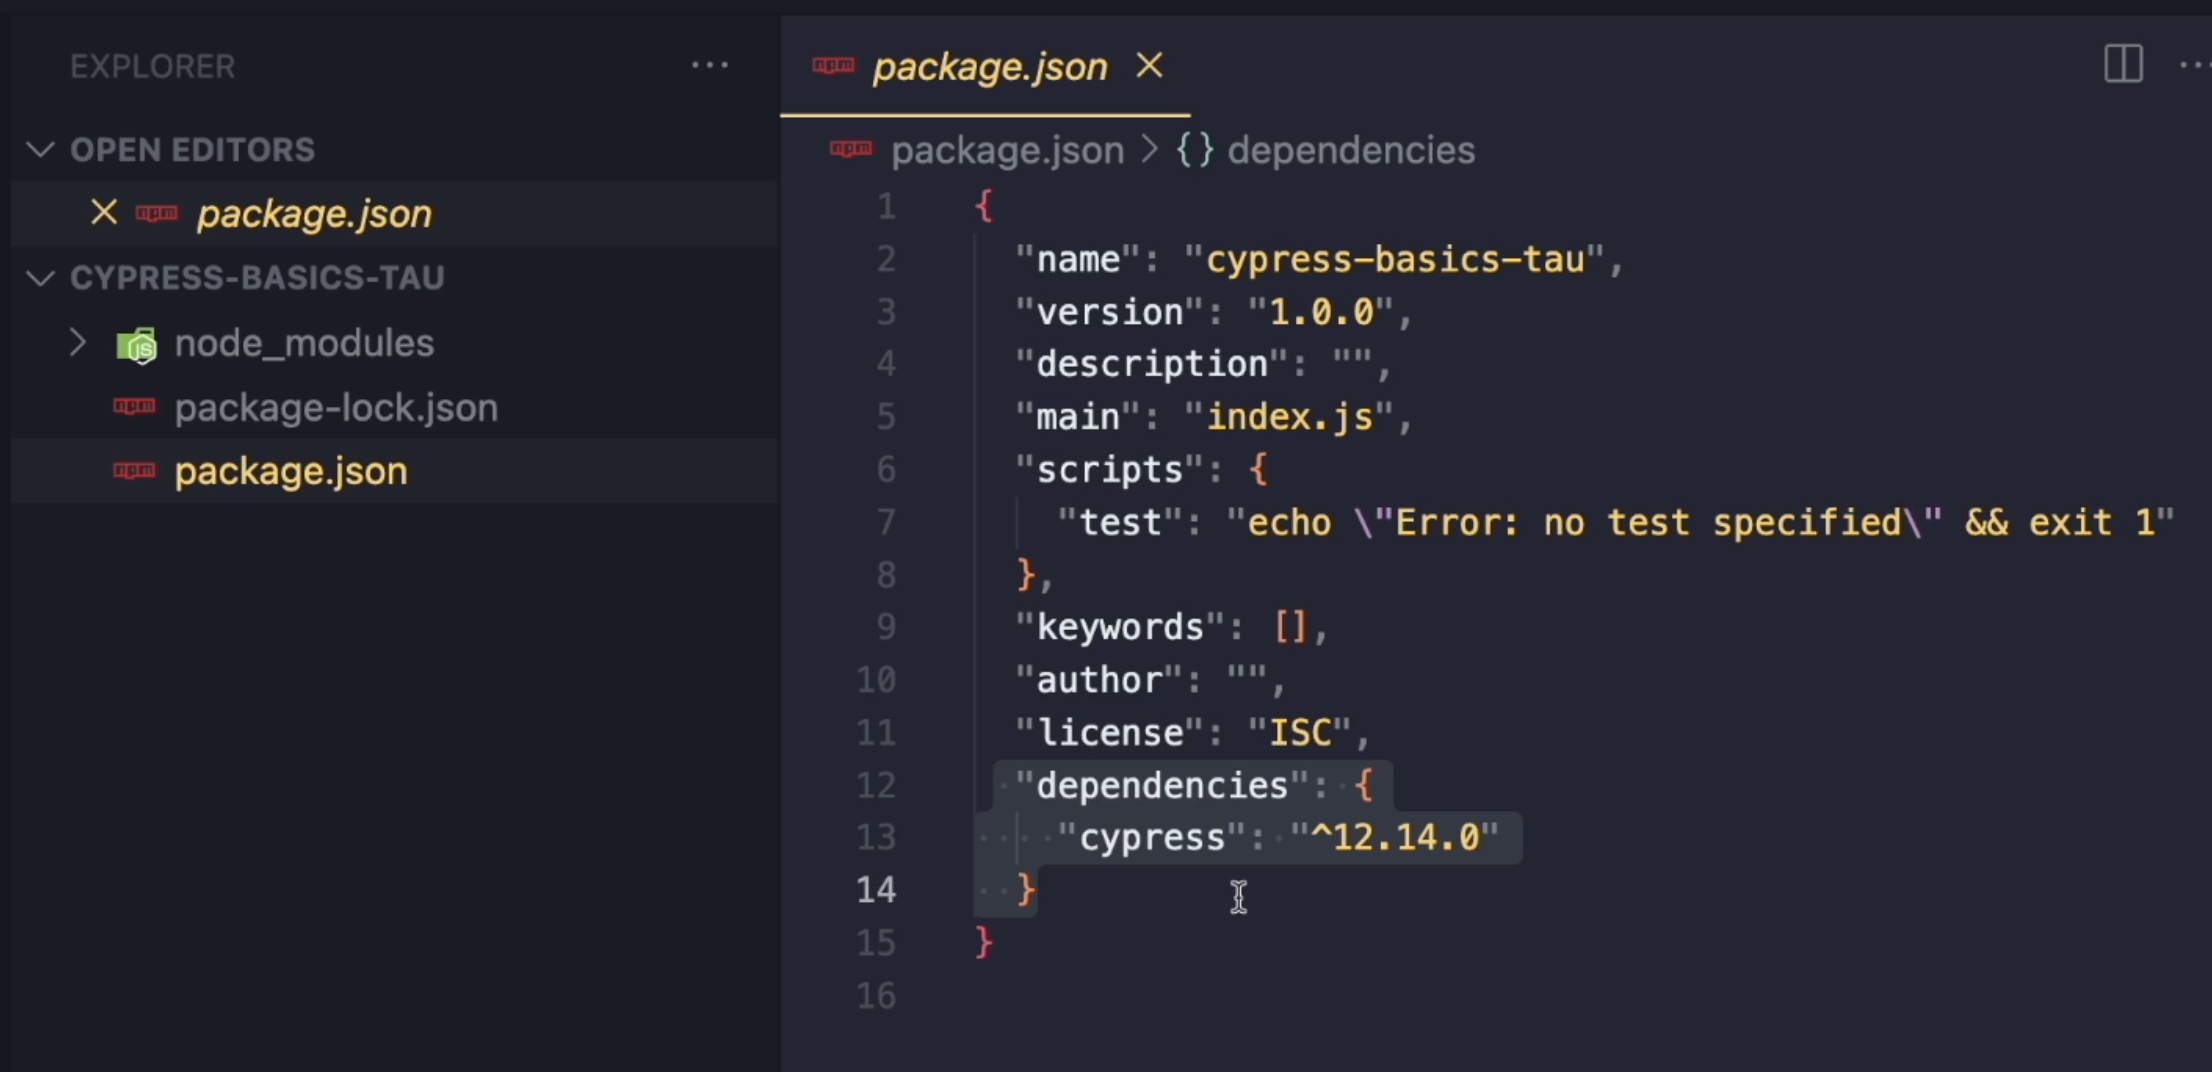
Also, in the folder, we got two new items.
One is package-lock.json - that's not really meant to be read by humans, but it contains references to Cypress, information about our project, and information about all of the dependencies that Cypress uses.
Cypress also uses some additional packages, so all of them are going to get installed and you can see them in this node_modules folder.
There's quite a lot happening in there, but there's no real need for examining what's happening inside this folder.
Let's now go to the Terminal once again, and finally I'm going to type npx cypress open.
This will open Cypress in this nice UI mode where we can examine our tests, run them, and set up our project, etc.
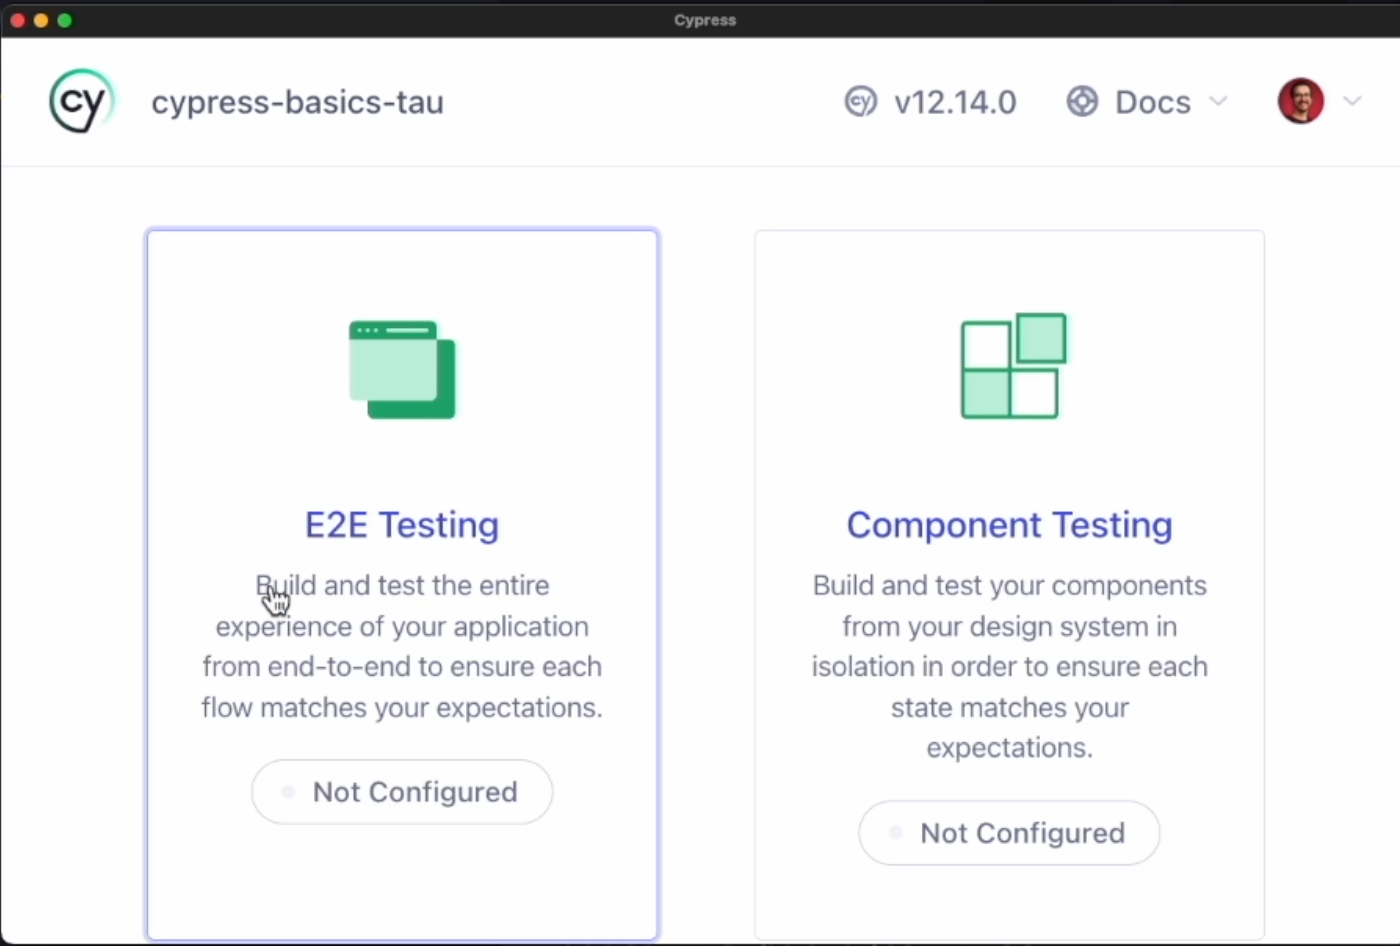
Coming up in version 10, Cypress has added component testing.
In this course, we are just going to be dealing with end-to-end testing.
As you can see, it's not configured so let's click on this button and configure it.
Cypress is actually going to do that for us - it has now created configuration files and added them to my project.
When I click on "Continue", I can go ahead and choose a browser.

Cypress is automatically going to search for all the browsers that are installed on my computer and suggest them as a possible browser for our testing.
Cypress has support for all of the Chromium based browsers - so that includes Chrome, Edge, Electron - and then also we have Firefox which is not Chromium based but Cypress supports it.
If you're interested in running your tests in Safari, there is experimental support for that which you can enable in your configuration.
Let's now start testing in Chrome.
This will open my Chrome browser, and again, I got this nice UI to explore the settings and take a look at my spec files, and maybe examine cloud recordings and debug them.
As this is a new project, we don't have any spec files in our project so we got two options.

We can either create a new spec by ourselves or we can scaffold example specs.
This option is really good if you want to examine what Cypress is capable of.
I'm going to click on that and what this is going to do is it's going to create a bunch of test files for me.
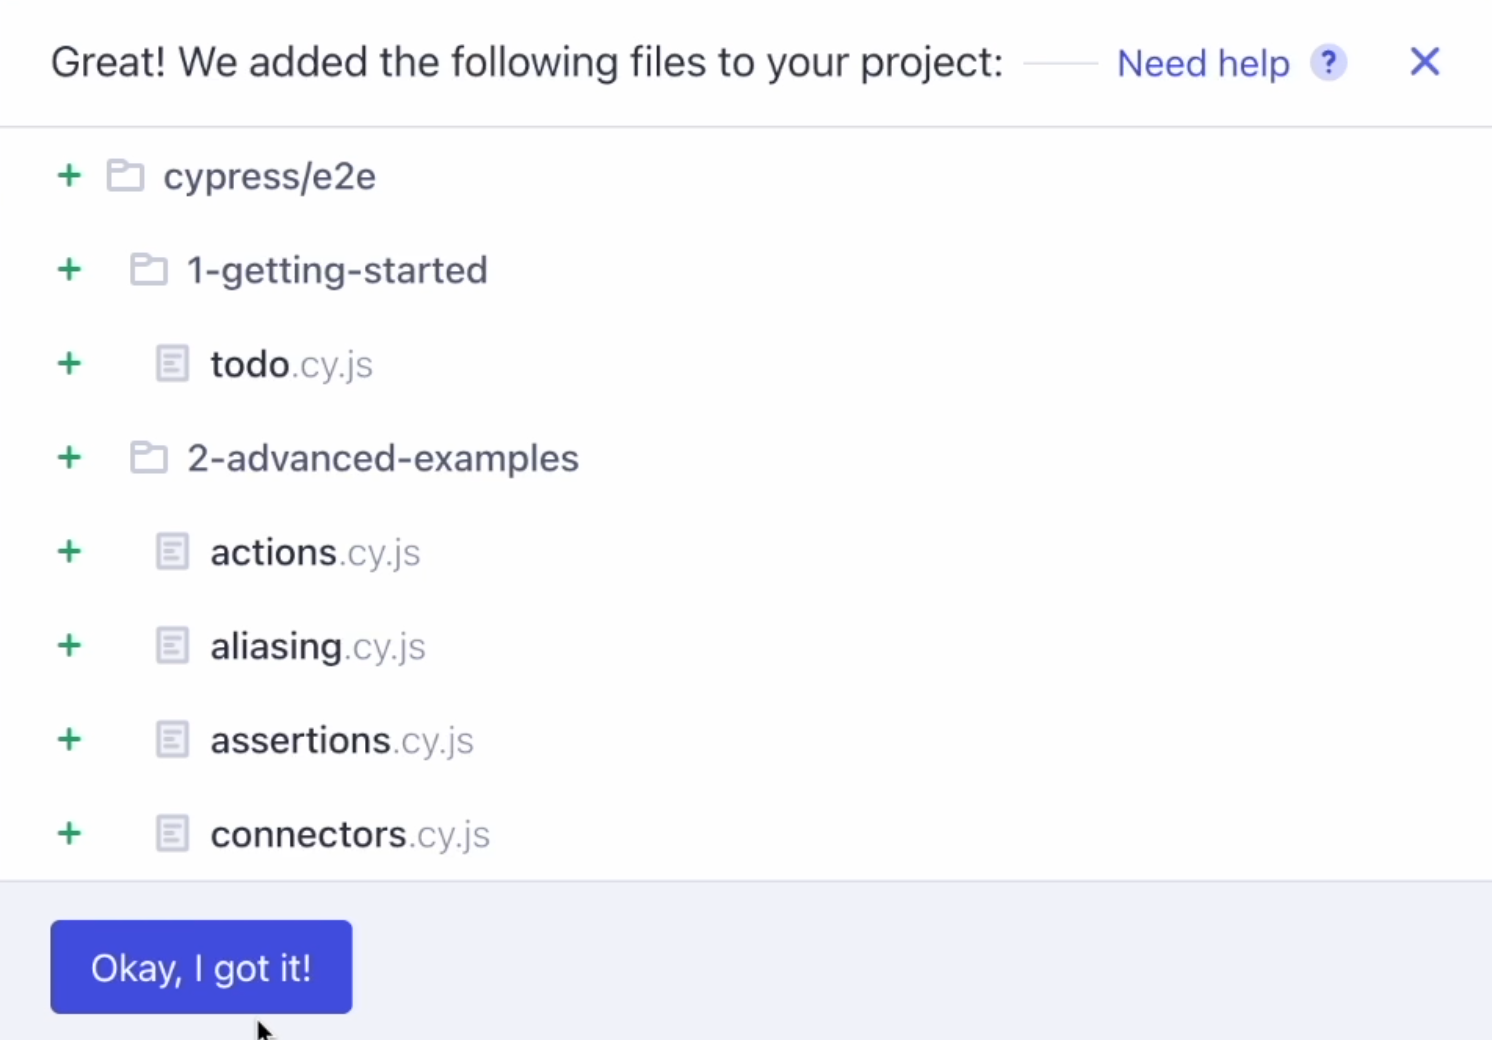
As soon as I click "Okay, I got it!", I can see now a list of all of the different tests.
If I click on it, for example, on this todo under 1-getting-started, Cypress is going to open an application and run a test.
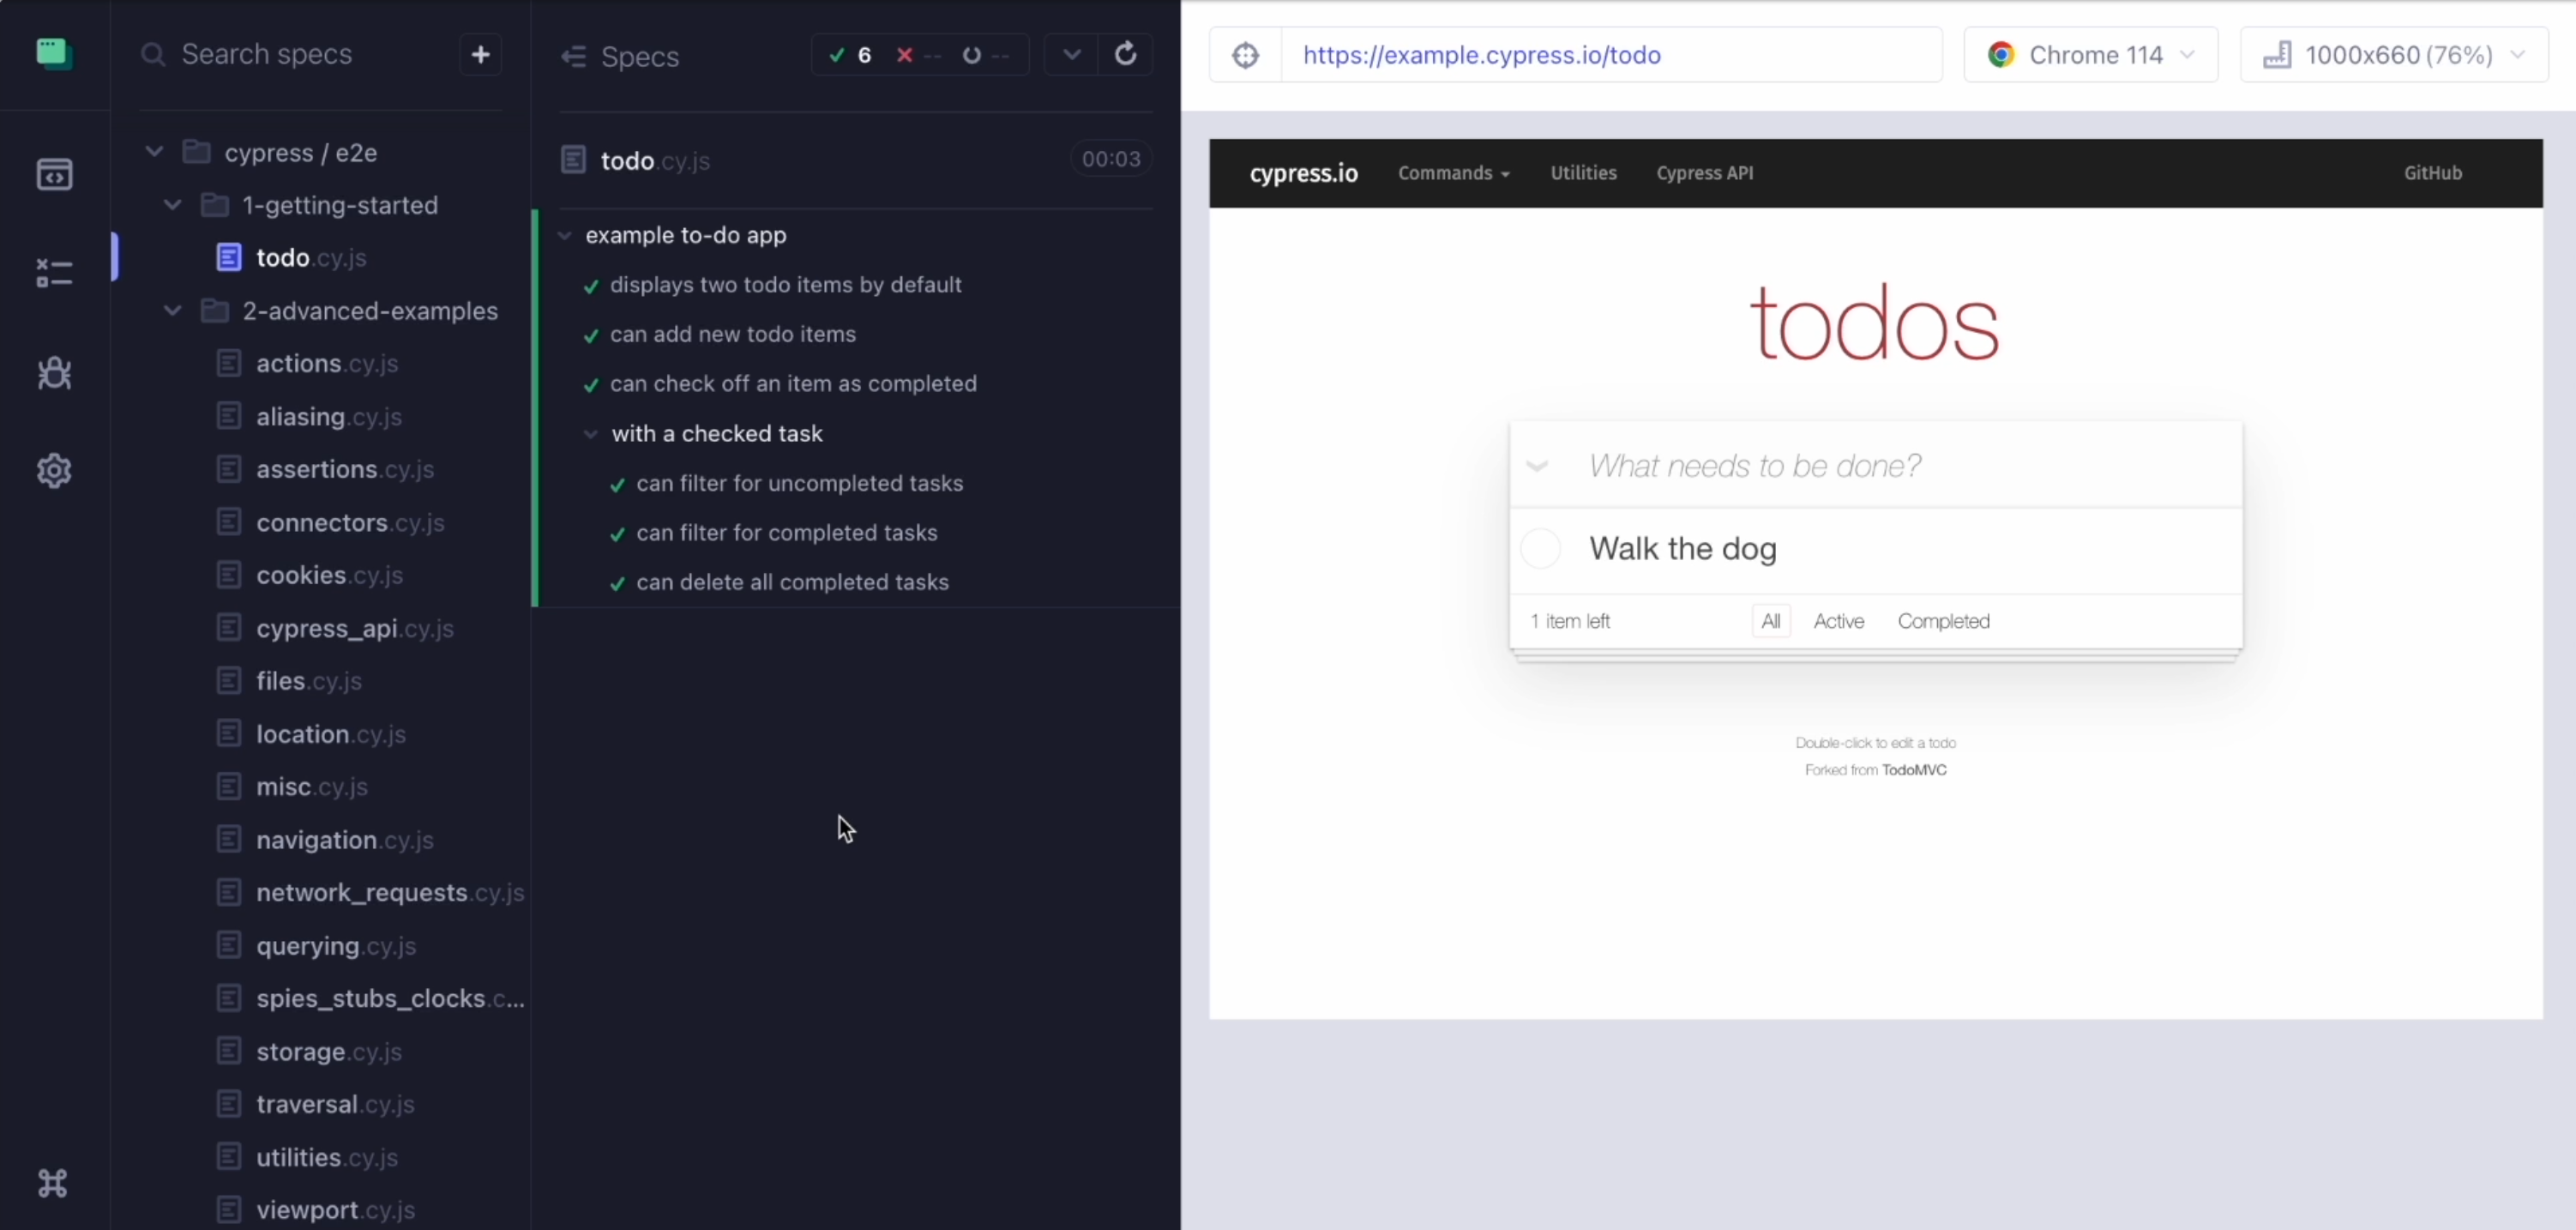
So we can now see the Cypress runner UI.
We basically have three panels in here.
On the left, we got all of our specs - all the files that we can run.
In the middle, we have what we usually refer to as the timeline, and on the right, we have the application we are testing.
Now, this is a live application, so we can actually keep on interacting with that.
We are inside the browser and that gives us the option to test our application both manually and automatically using our script.
If I want to take a look into the details of the test, I can just click on the name and it will show me all of the commands and assertions that were made during the running of the test.
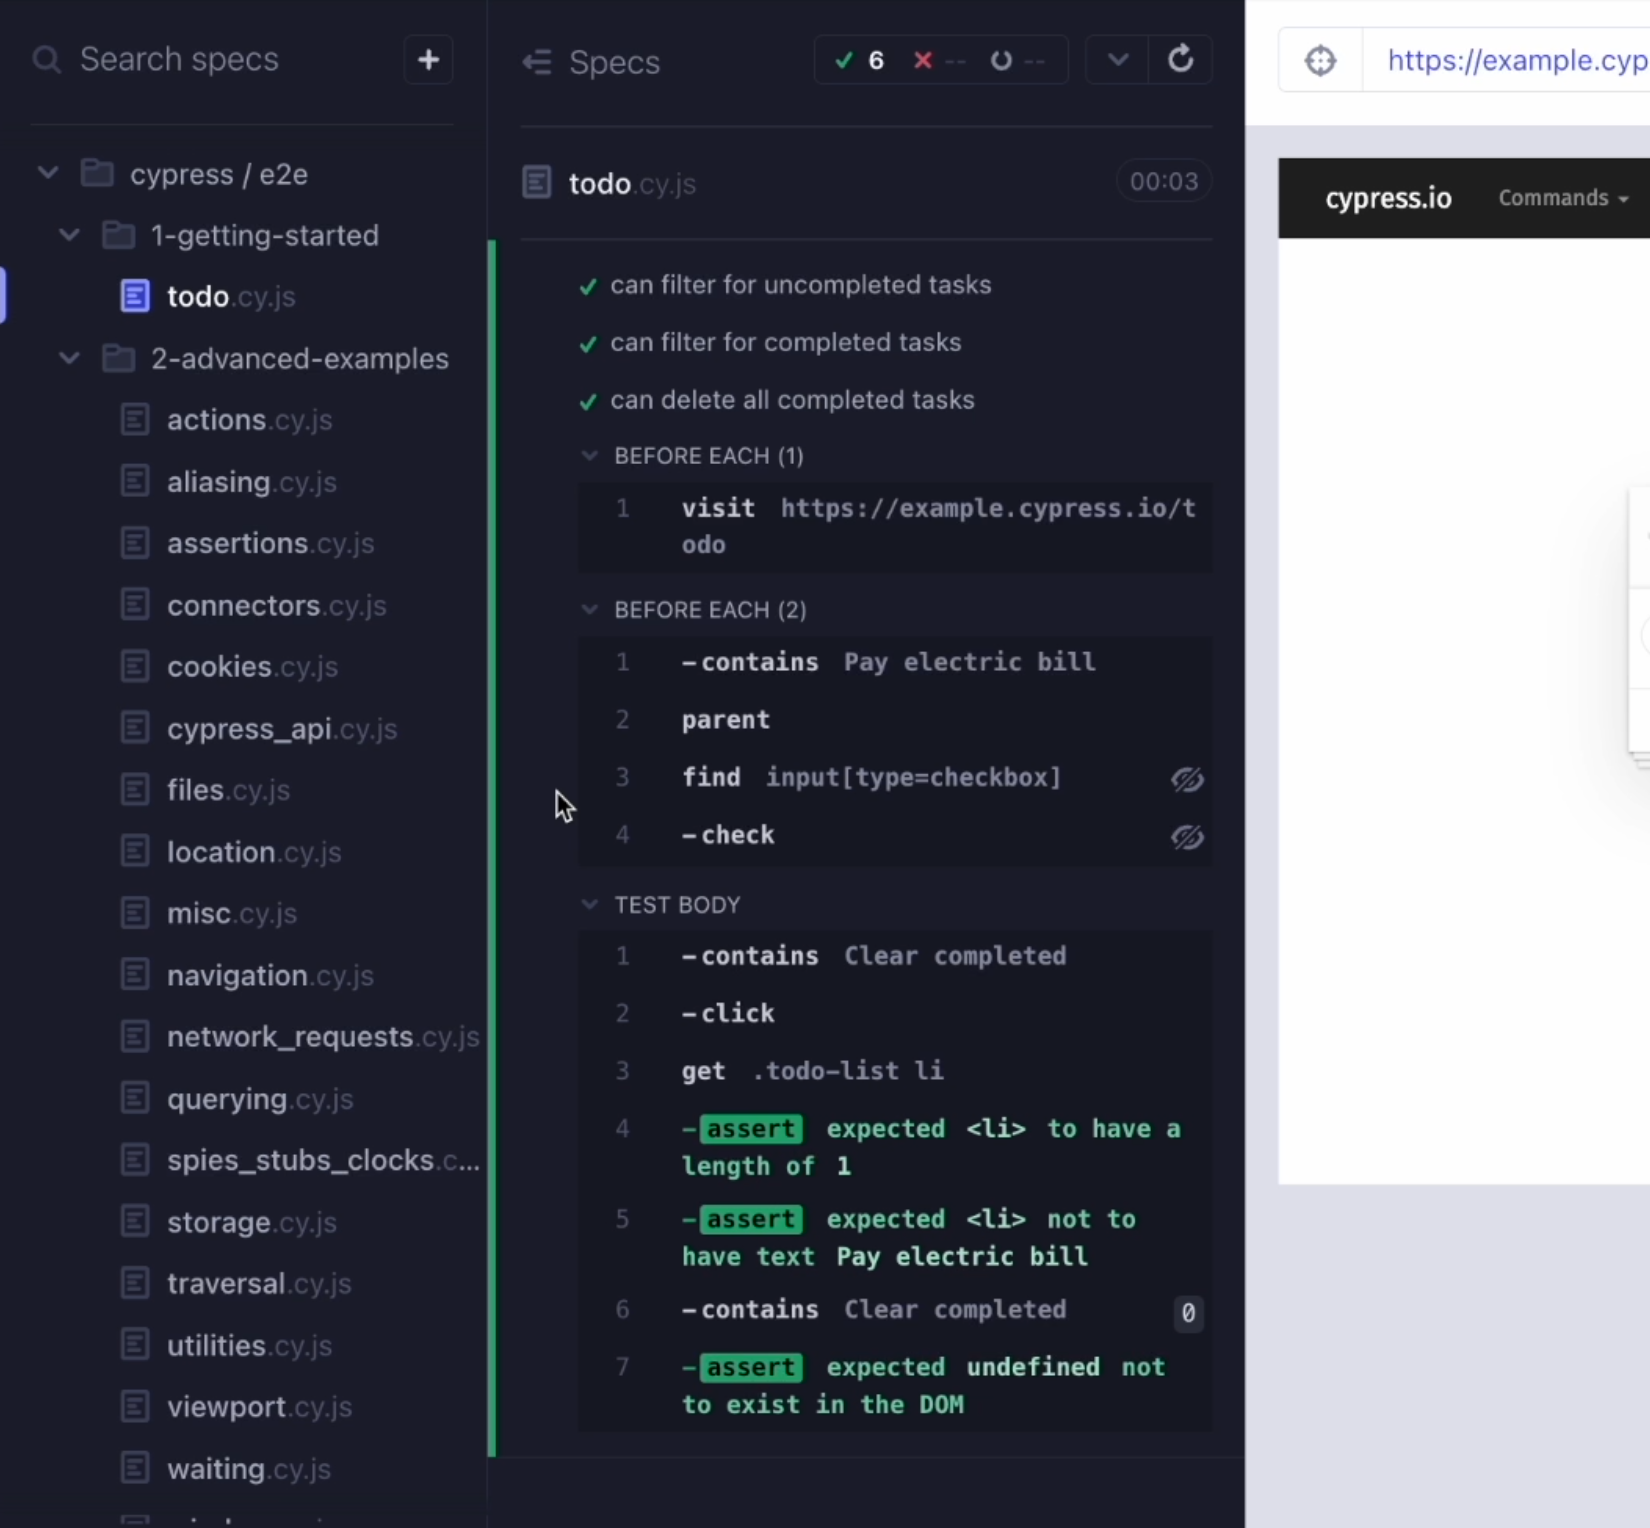
Moreover, if I hover over any of the commands, you can see the UI change on the right side.
Cypress will automatically do a DOM snapshot of our application during each and every command.
This means that we can sort of travel back in time and look into how our application looked when a certain action was being done.
This is great for finding selectors and examining what our application was actually doing.
At the top of this panel, we have the reference to our file.

We can see the number of passed, failed, and skipped tests.
We can run our test again and then we have a selector playground which can help us find a suitable selector.

We have the URL, and then some additional information like which browser we are running on and what the resolution is.
Now, since we are in a browser we can actually right-click and inspect our elements.
So this way, if we want to find a selector, we can do that, but also, I can open my Console.
I can examine the network calls in the Network panel.
I can take a look into the cookies in the Application panel.
Basically, I can harness all of the power of my dev tools.
Moreover, Cypress actually makes use of the browser console.
If I click on any of the commands in the timeline, it's actually going to print out information about the command and about what it has done.
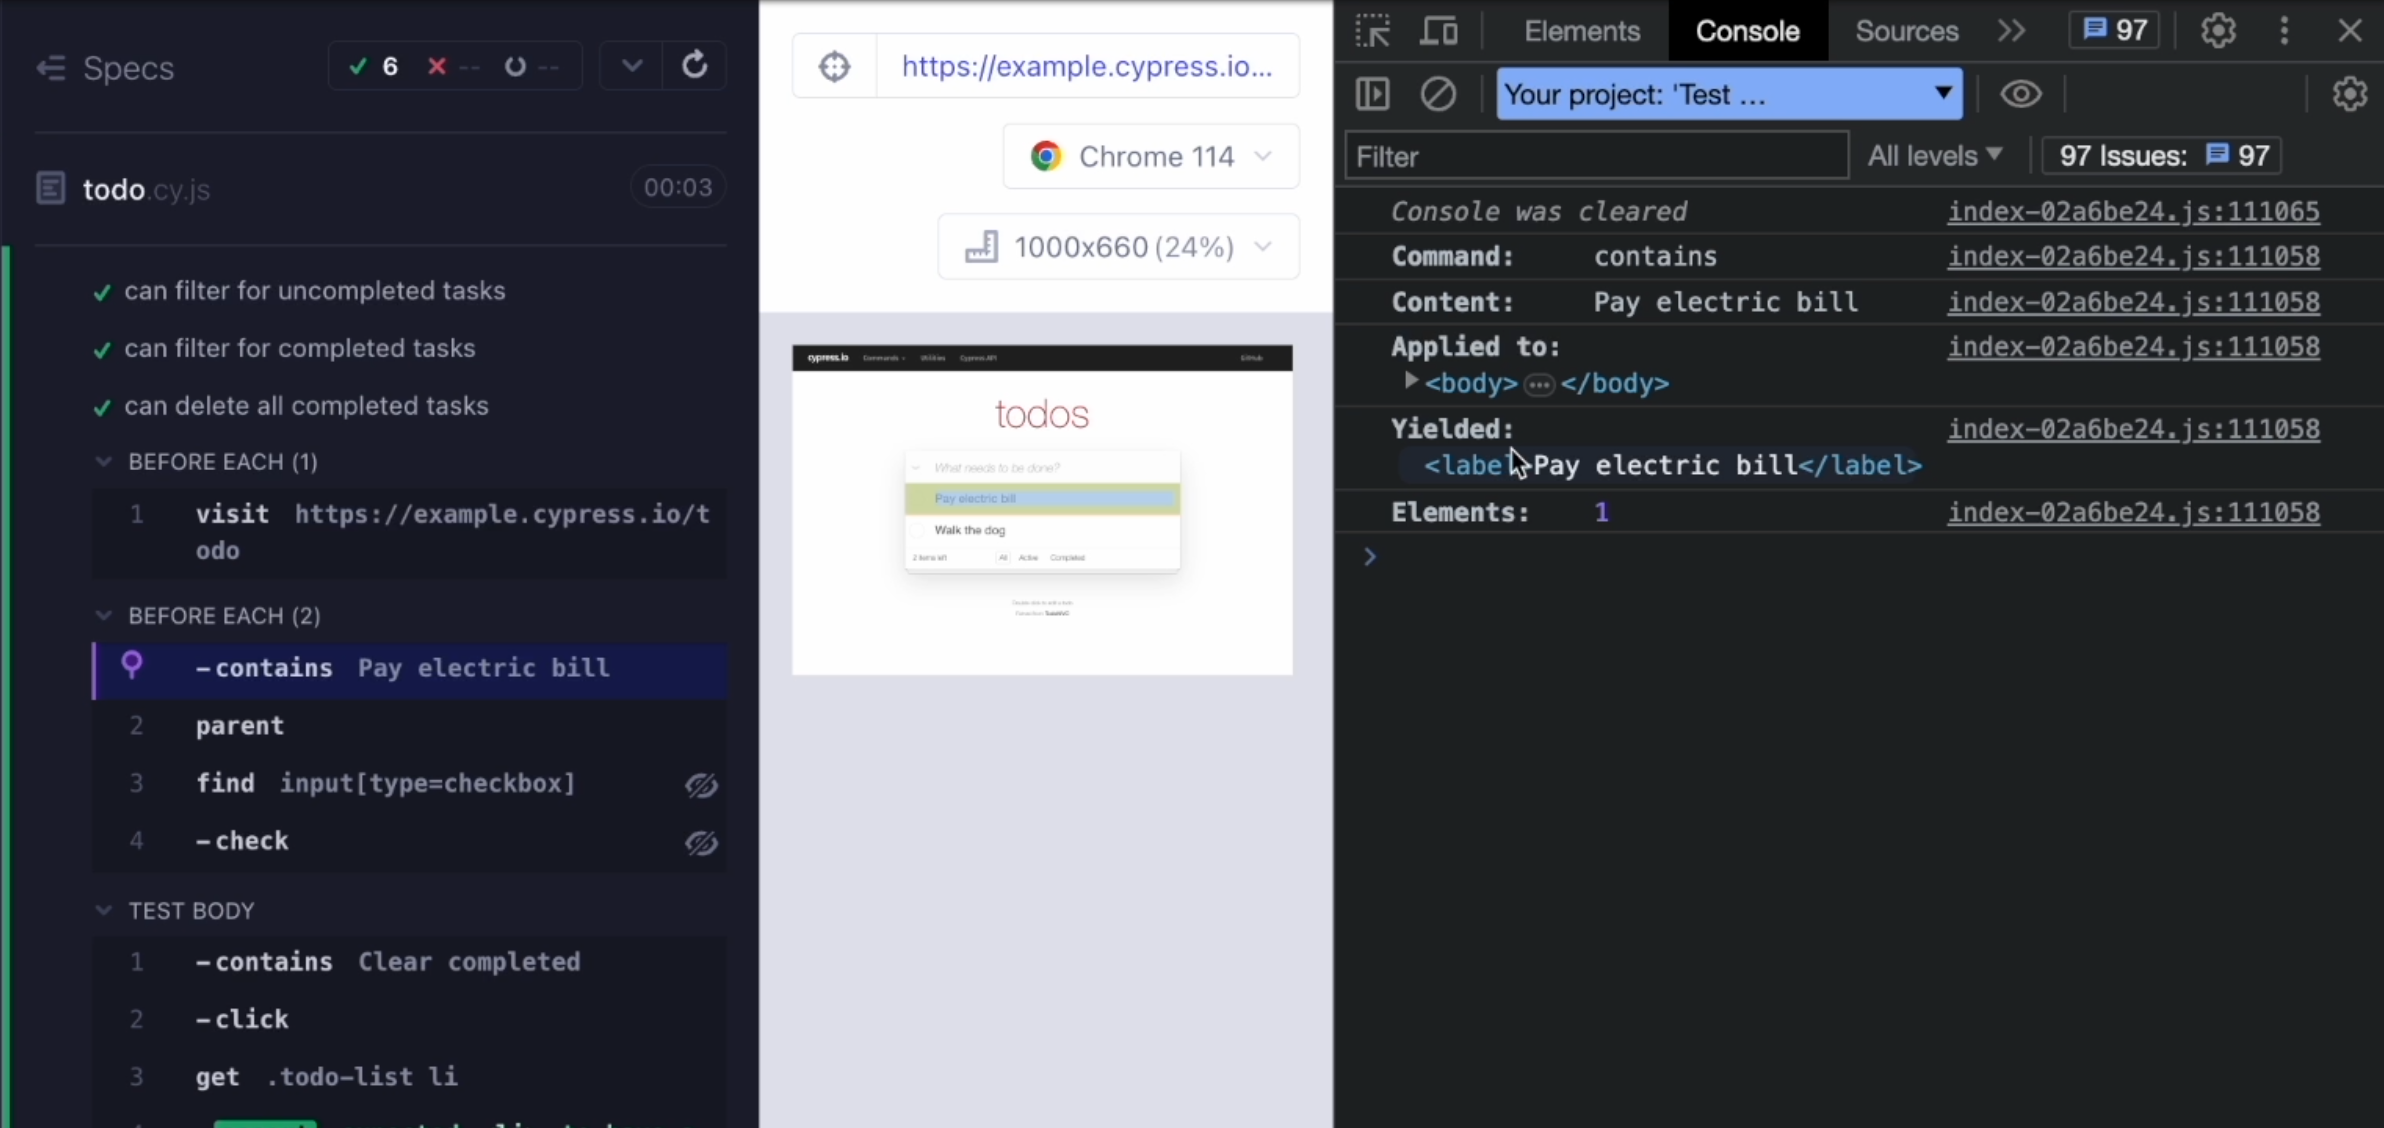
Working with the Console is actually going to help us tremendously when we will be examining how Cypress actually works.
Let's now go back to our VS Code, and here, you can see that we have two new items.
We've got cypress.config.js, which is a configuration file.
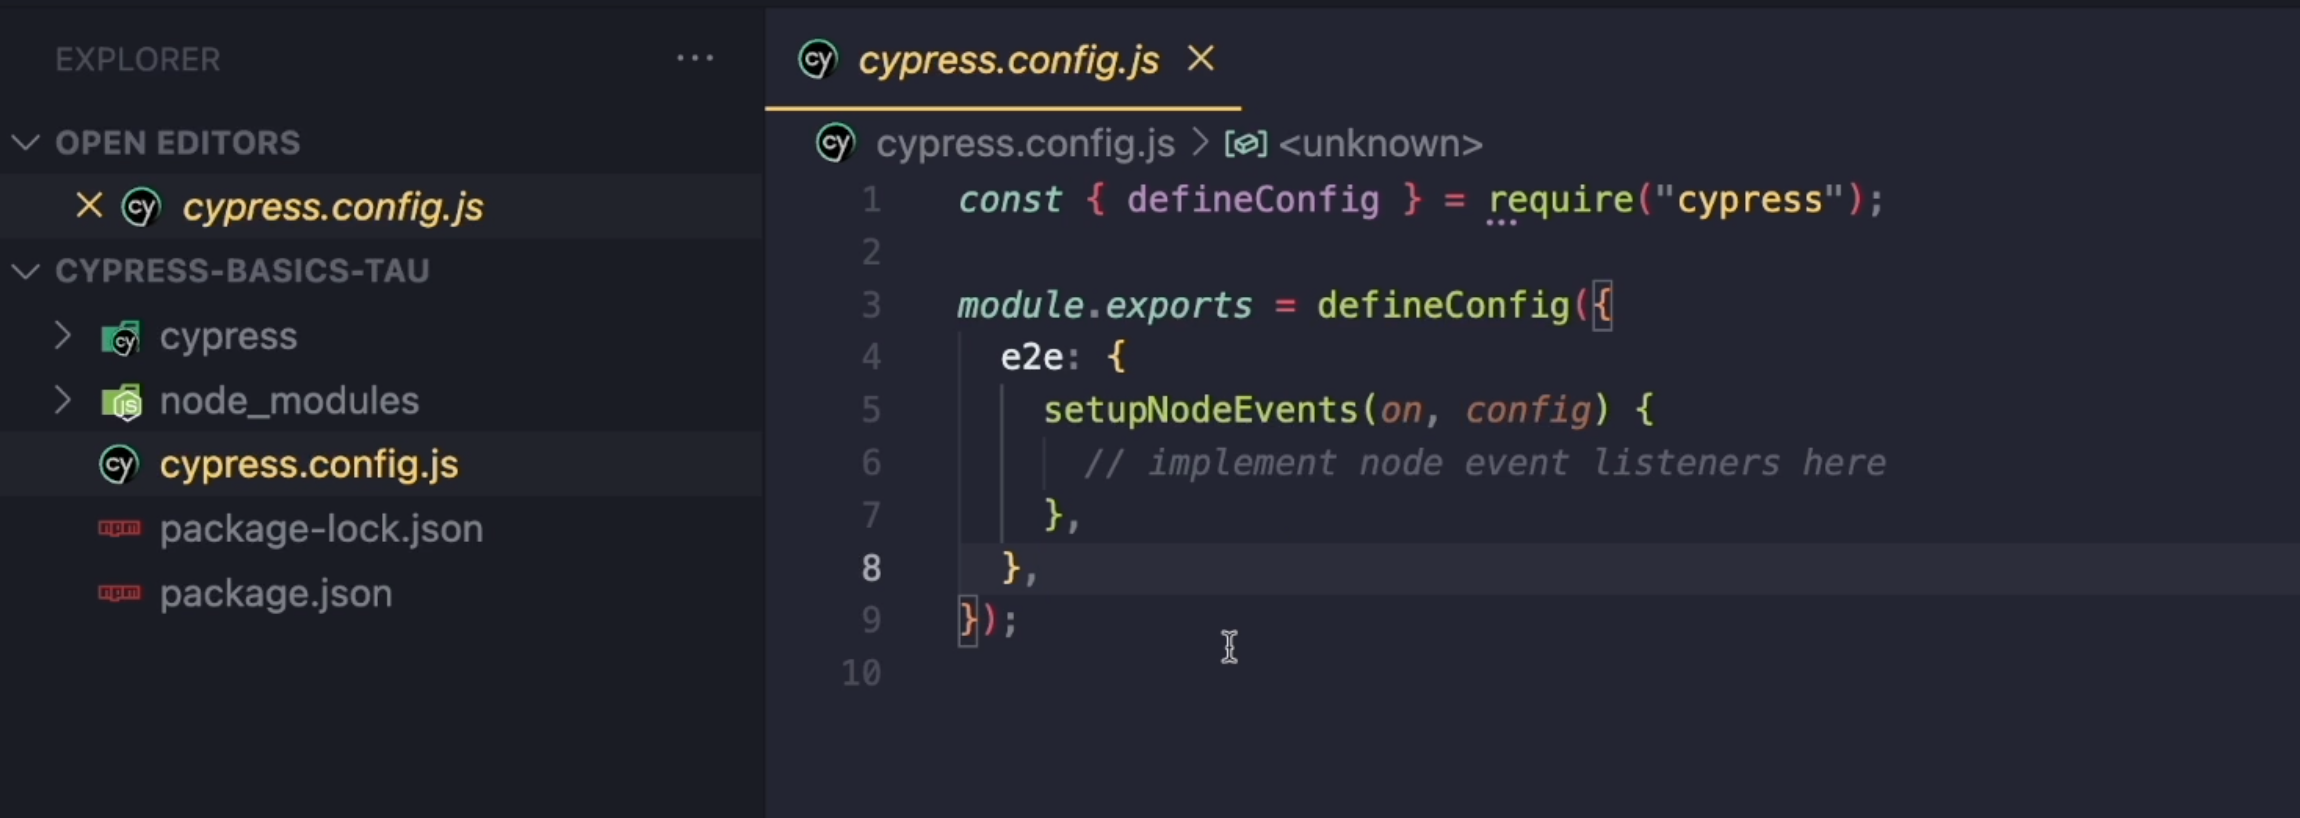
Currently, there's not much happening in here.
We're basically not configuring anything, but if we were to set things like viewportHeight and viewportWidth in order to do testing in different resolutions, then this is the place where we would set it up.
The second thing we have here is the cypress folder which contains three subfolders.
The first one is e2e - this is where our tests are.
You can see that we have the 1-getting-started and 2-advanced-examples that we created a moment ago when we decided to create scaffold files.
Inside here, you can take a look into each and every command and it sort of serves like documentation because you have all of these comments in here which can really help you understand what the command is actually doing.
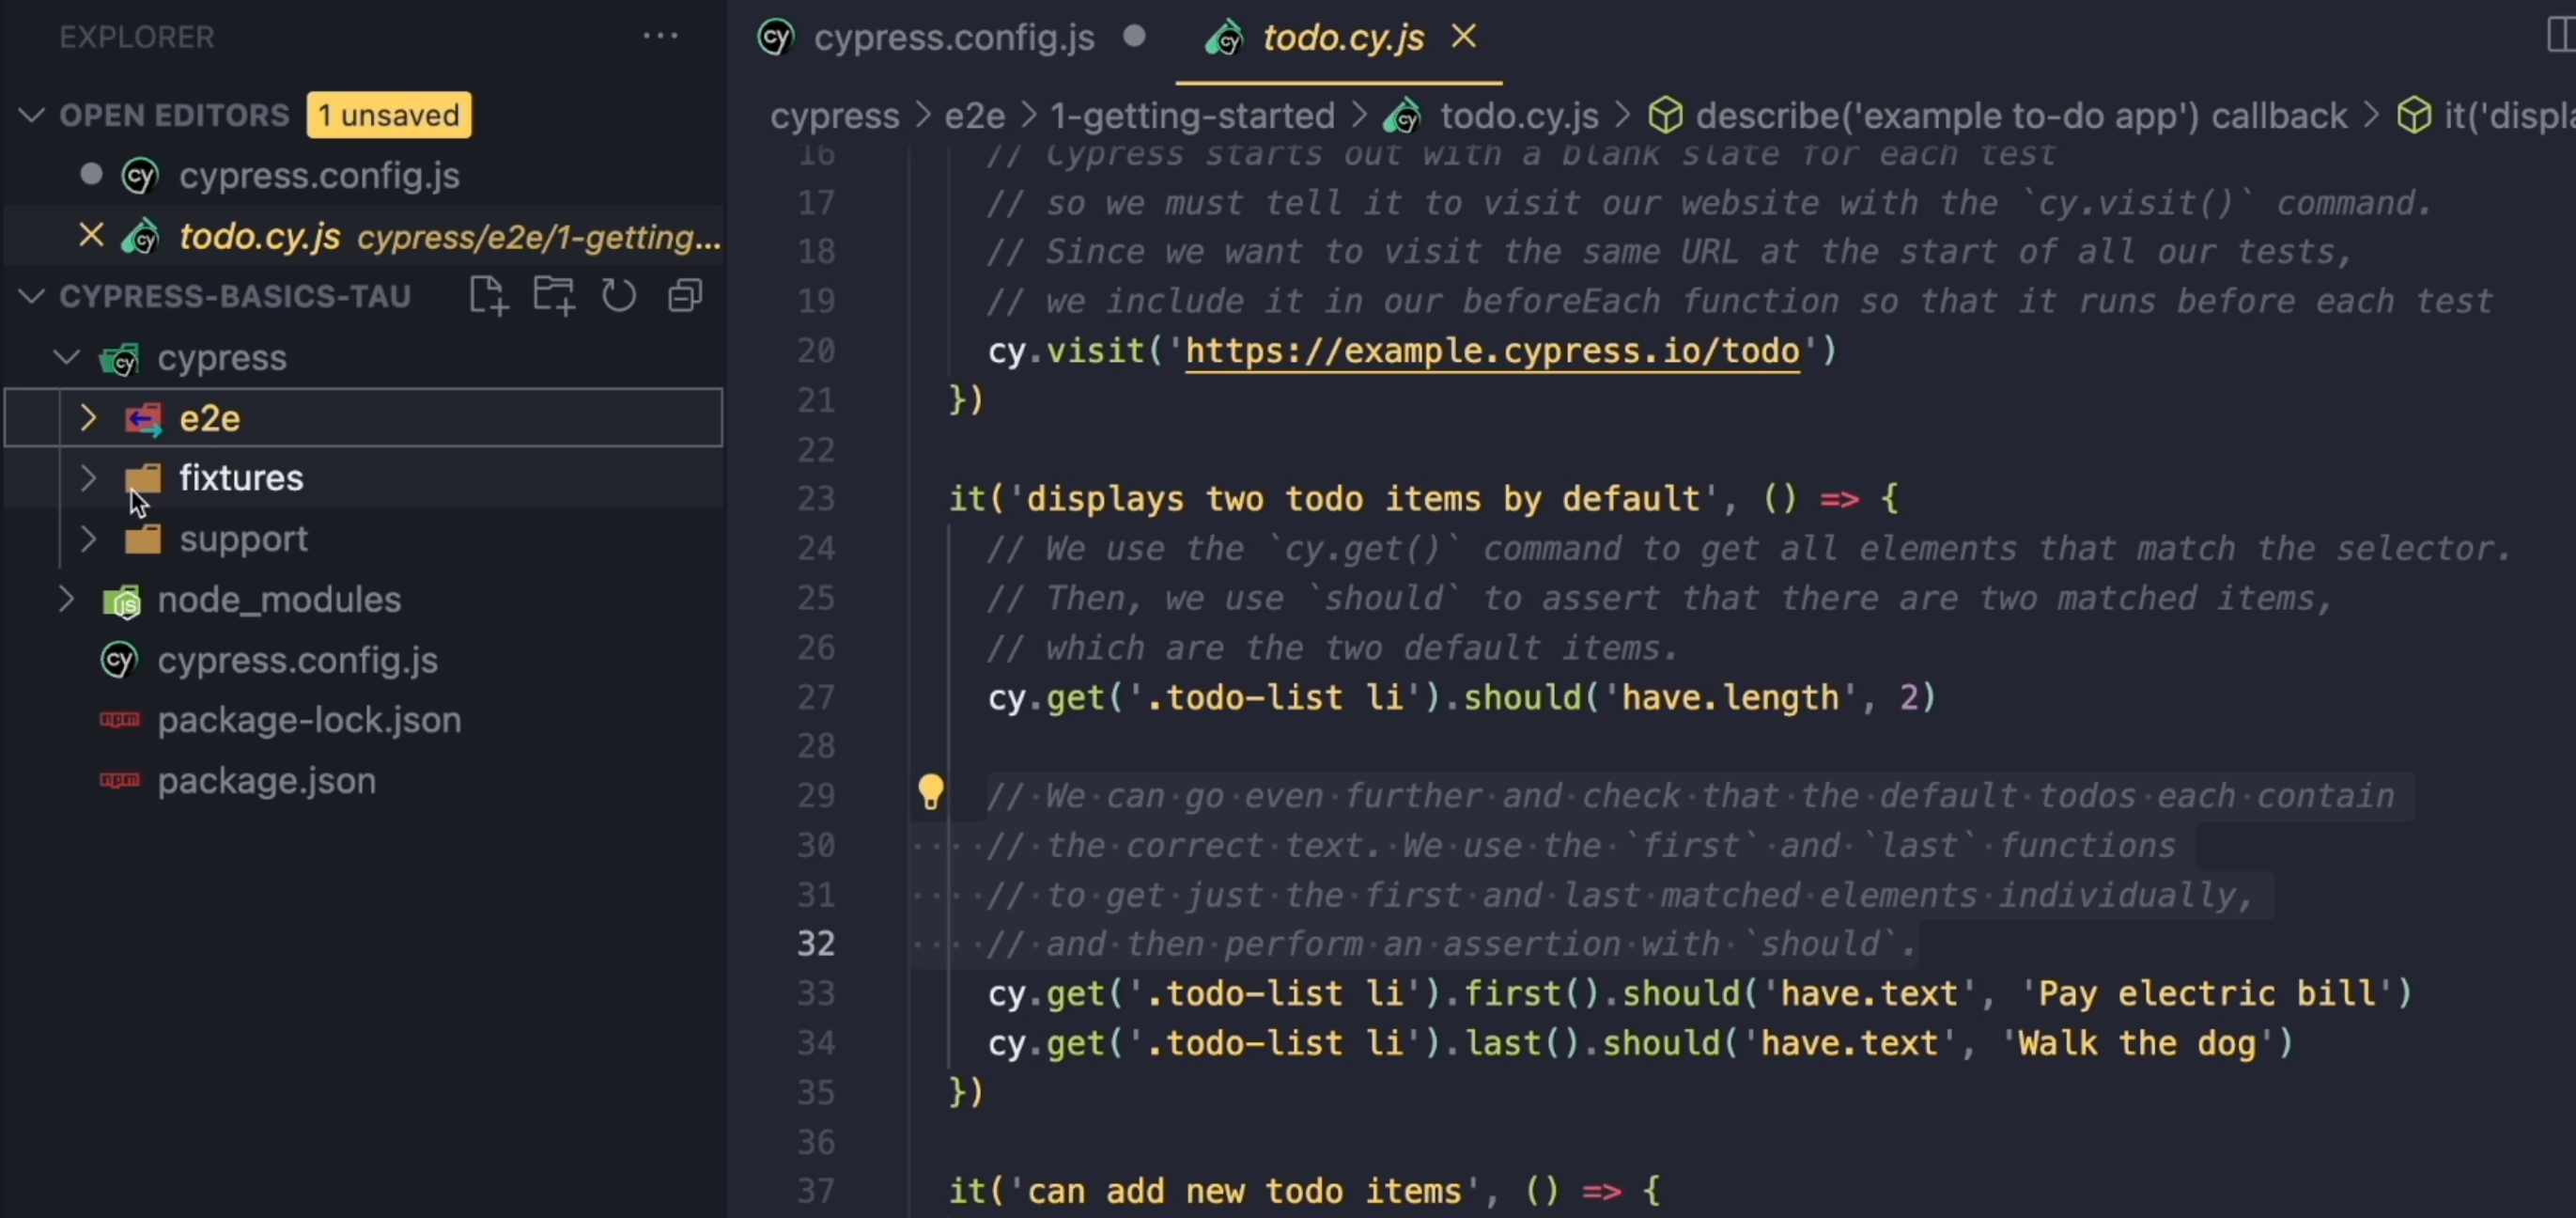
Besides the e2e folder, we have two other ones.
One is fixtures - that's going to contain all of the static files we need for our testing.
Then also the support folder, which is a place for our custom commands and for e2e.js, which is a file that will load before all of the tests are running.
This is a place for adding plugins or setting up some global stuff.
Along the course, we will be taking a closer look into this project.
Resources
- Detailed resources on Cypress installation
- Node.js homepage where you can download and install node
- VS Code - the code editor that I am using
- Documentation on "npm init" command
- Detailed view of Cypress App
