

Transcripted Summary
Welcome to Chapter 5.
In this chapter, we are going to learn how to use the reports, how to use the UI mode and what advantages it has, and lastly, how to use the debug mode to troubleshoot our testing issues.
I hope you enjoy it.
Let's open the file demo-todo-app.spec.ts file that is under test-examples and let's go to the line 24.
TODO_ITEMS[1] // intentionally changed here to fail the test
Make sure you have this value here as 1 instead of 0.
And let's go to line 201 and make sure you remove the .nth(1) from this line.
const todoItem = page.getByTestId('todo-item').nth(1);
I duplicated this line so we know what the previous value was, but in this case, I needed to remove this part of the command.
This way we are going to make the test fail and we can explore.
Let's go to the Terminal and run the command:
npx playwright test tests-examples/ --project=chromium
We are going to run only the test under this folder for Chromium.
It's going to run all the tests in this file, and at the end, it's going to retry a few times because we selected this value in the Playwright config file.
As soon as it finishes, it's going to open the report.
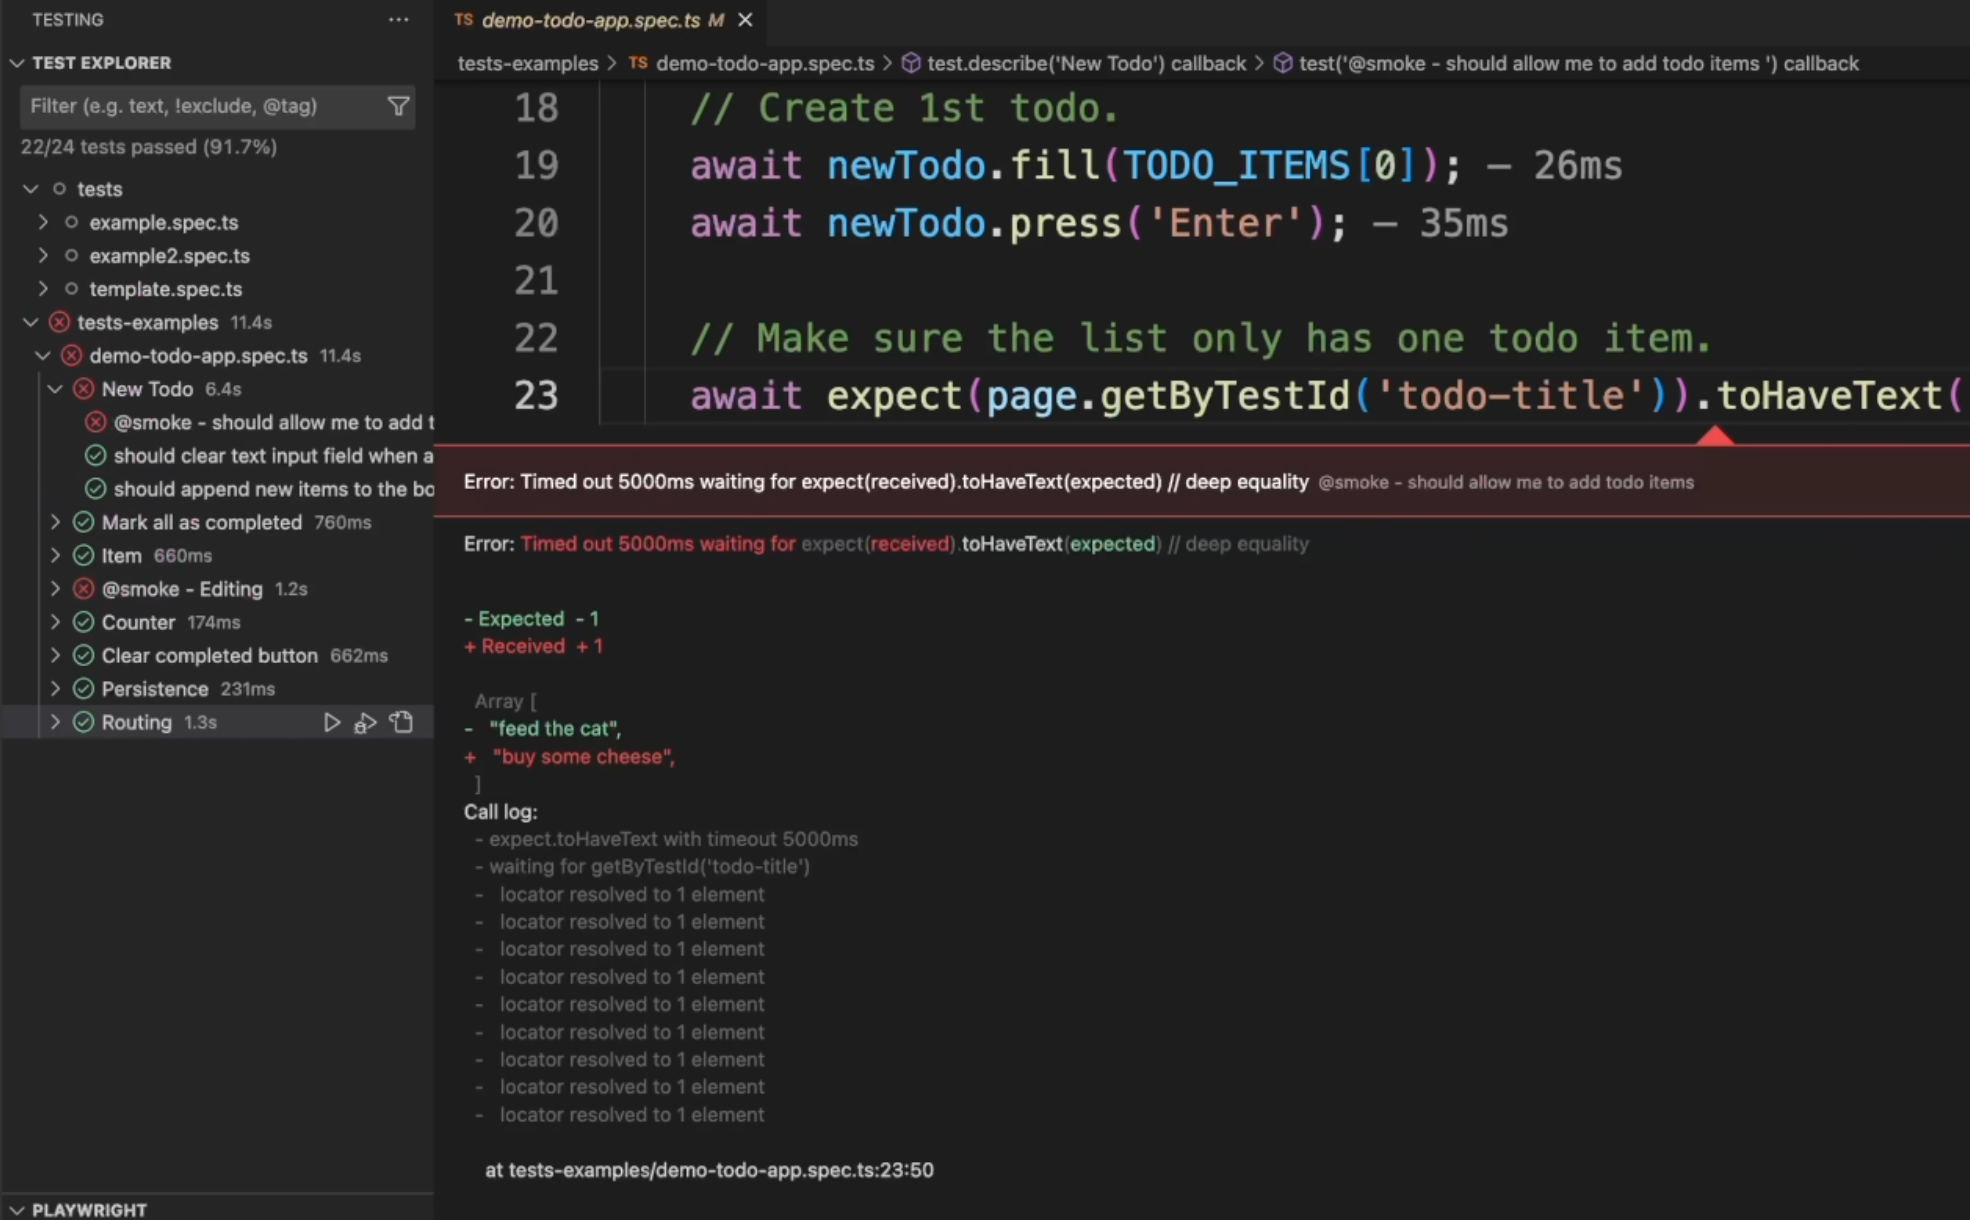
As soon as the report opens, we do have two tests failing as we expected.
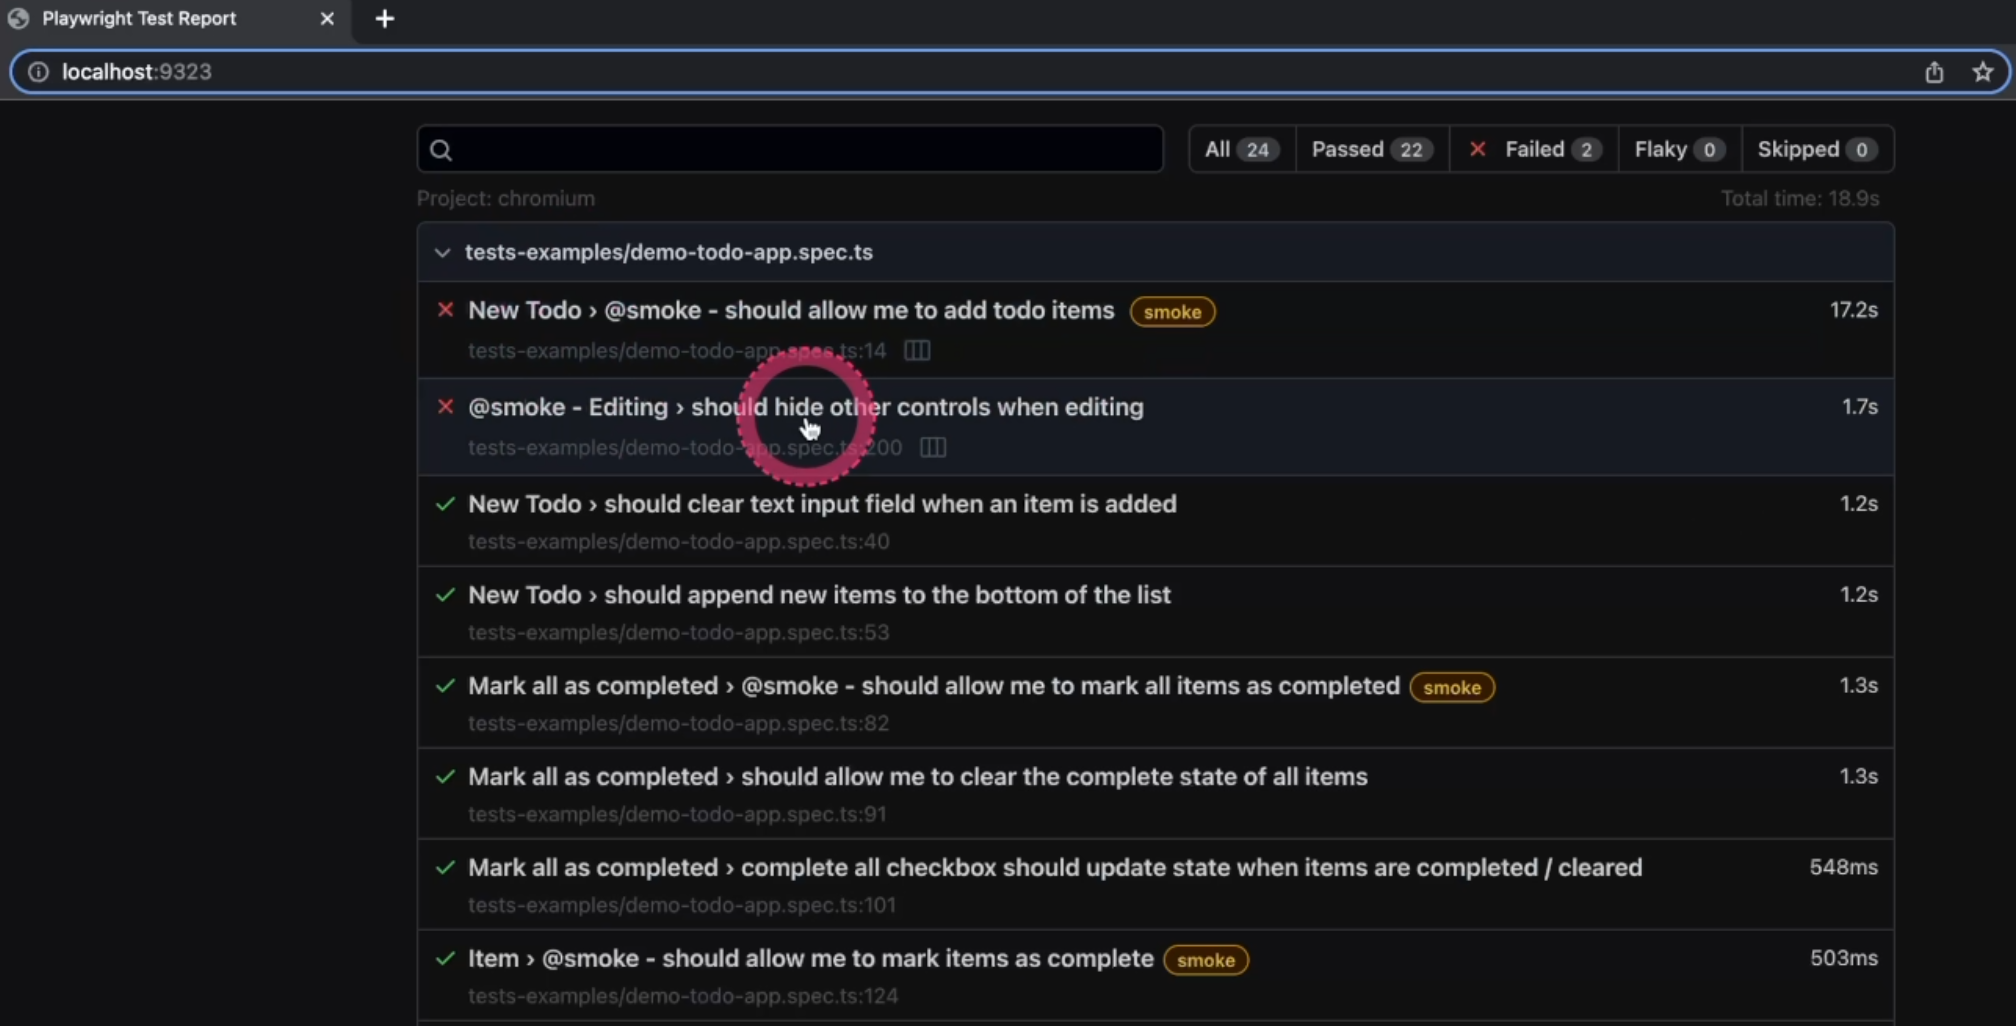
Let's go take a look at the second one first.
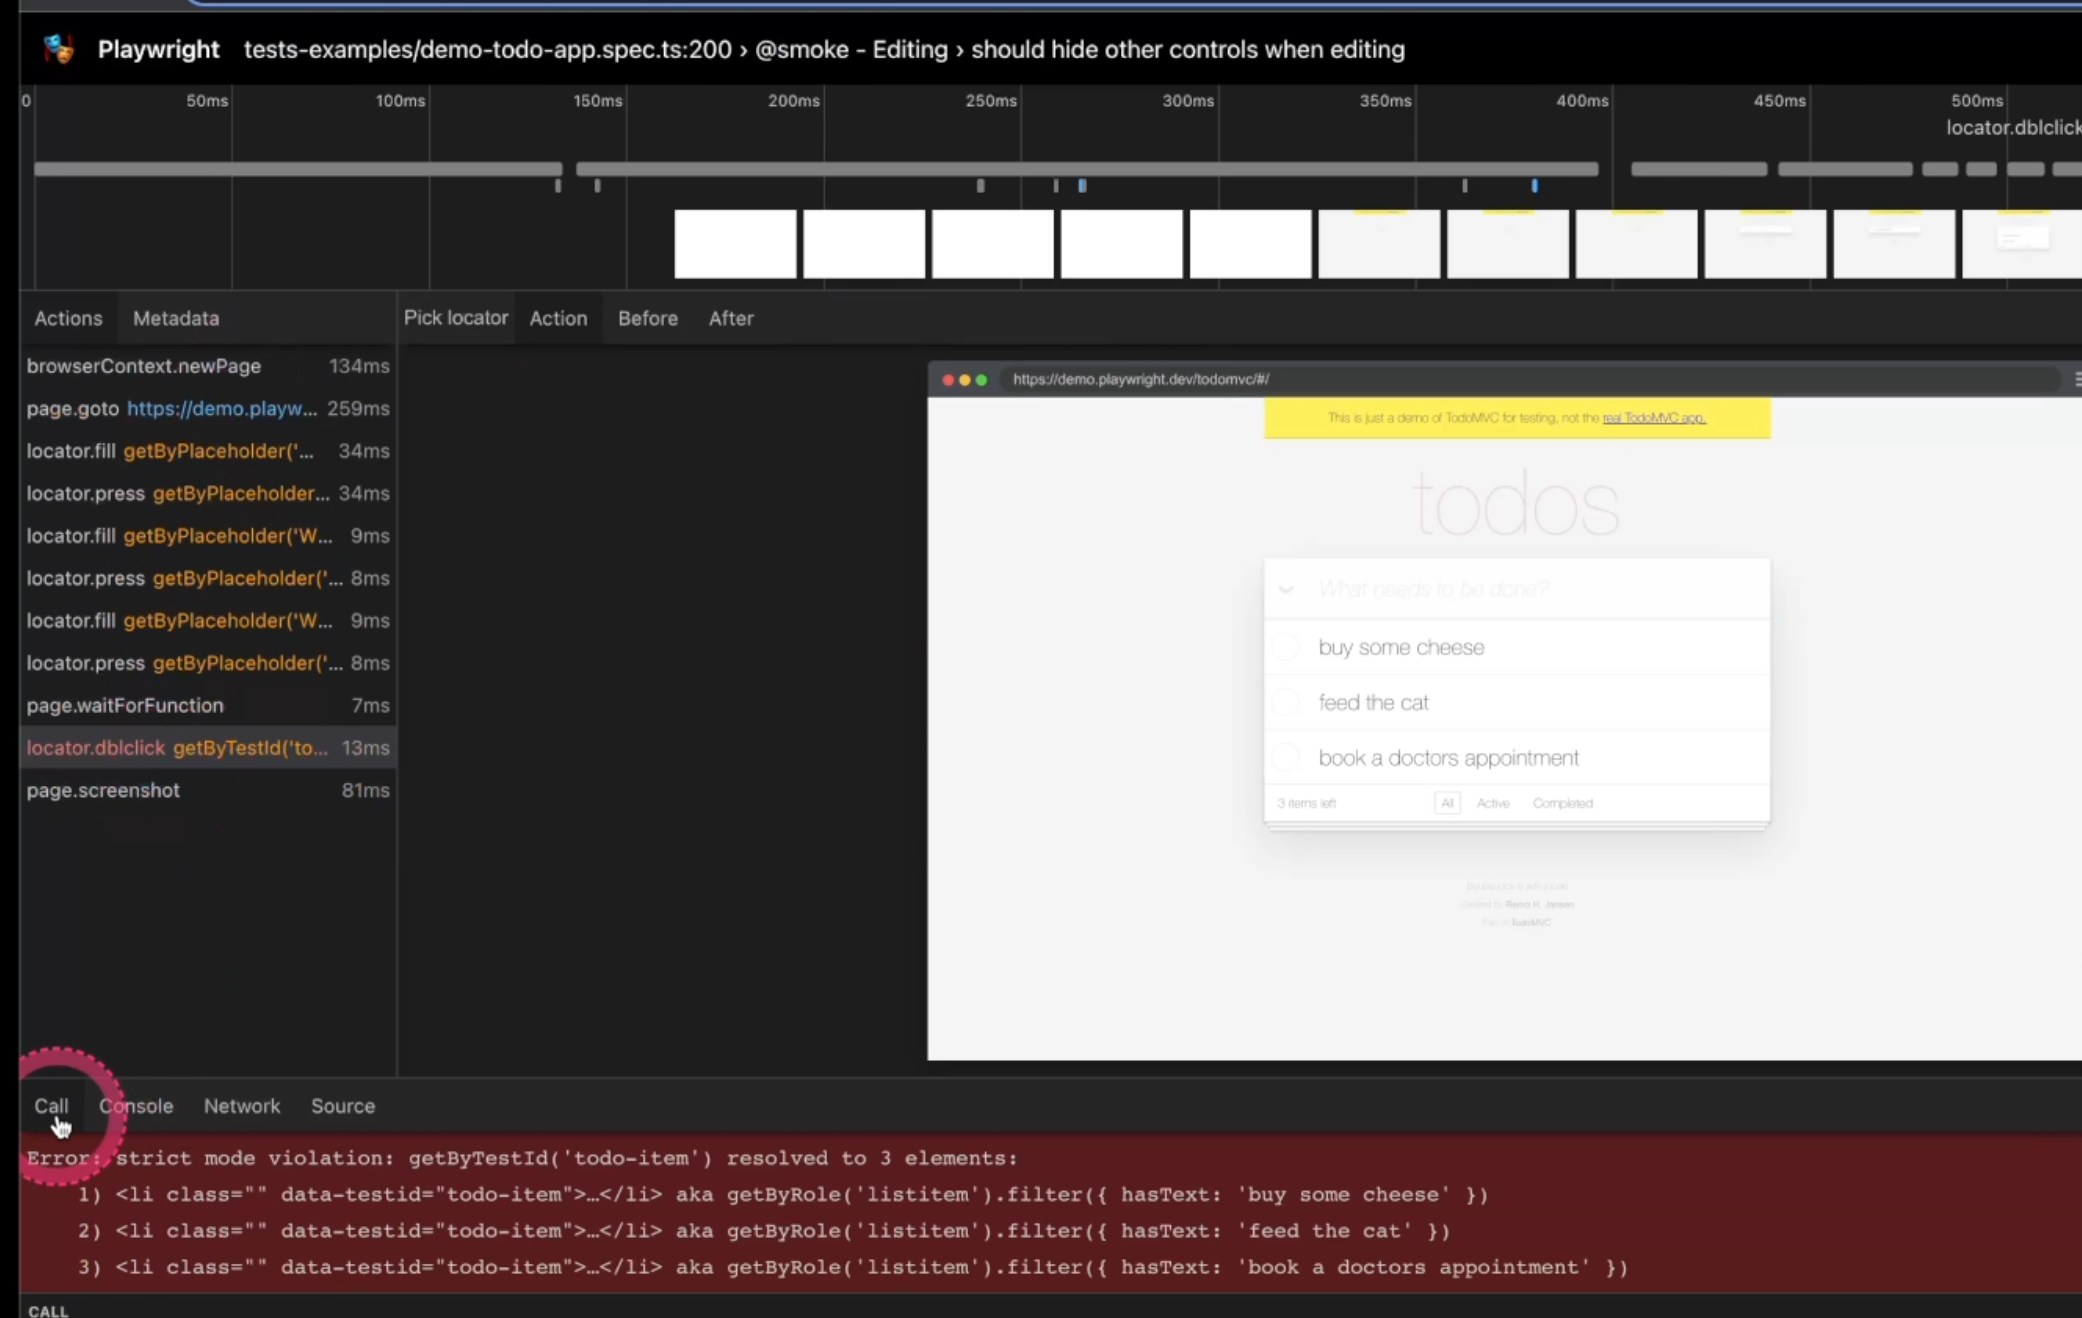
In this case, you can see that the error message says that this locator resolved to three elements, and here you can see that it gives you a suggestion of which locator to use.
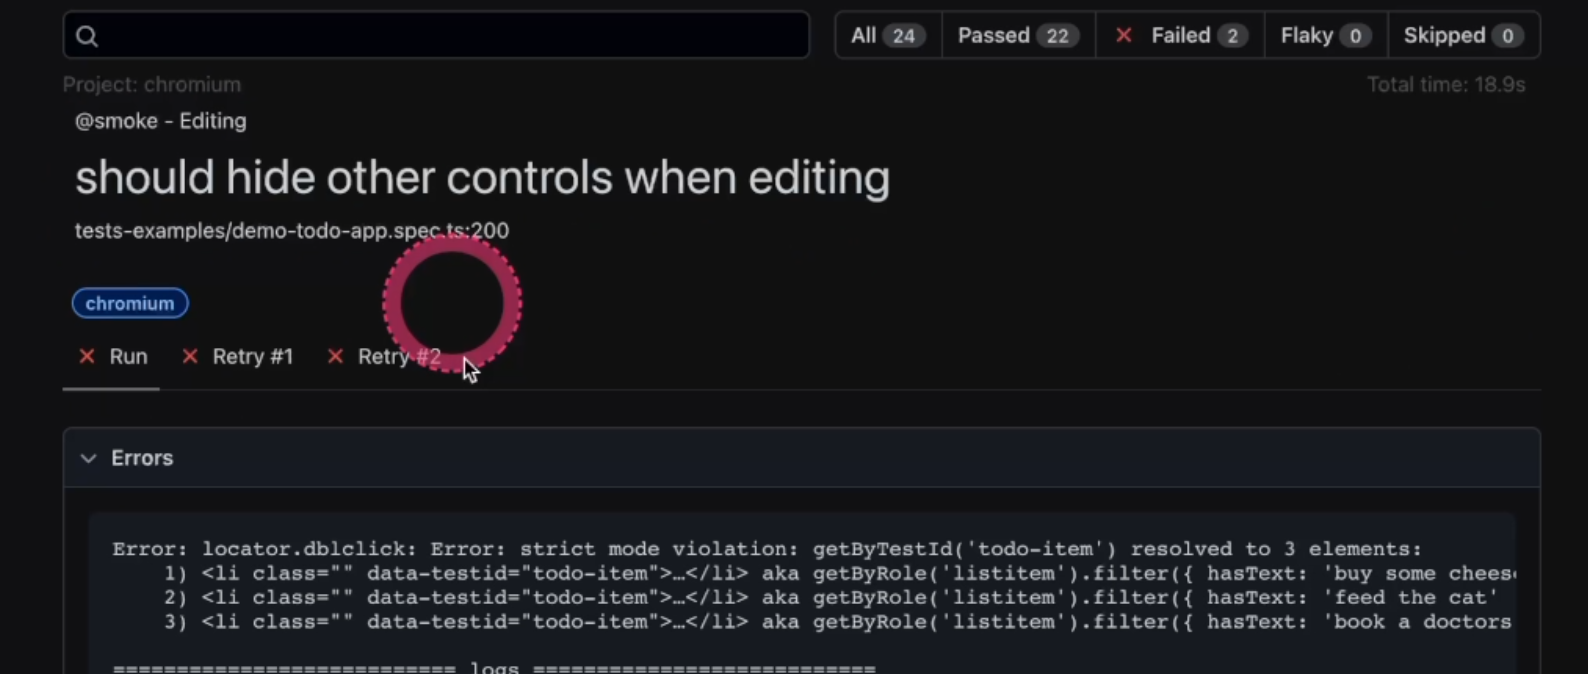
If we go back to our code, we'll see that that's not exactly the locator we are using, but you can use that.
So keep in mind that Playwright will offer you some solutions for your locator's problems.
You can use whichever solution you prefer, but they will offer you some options.
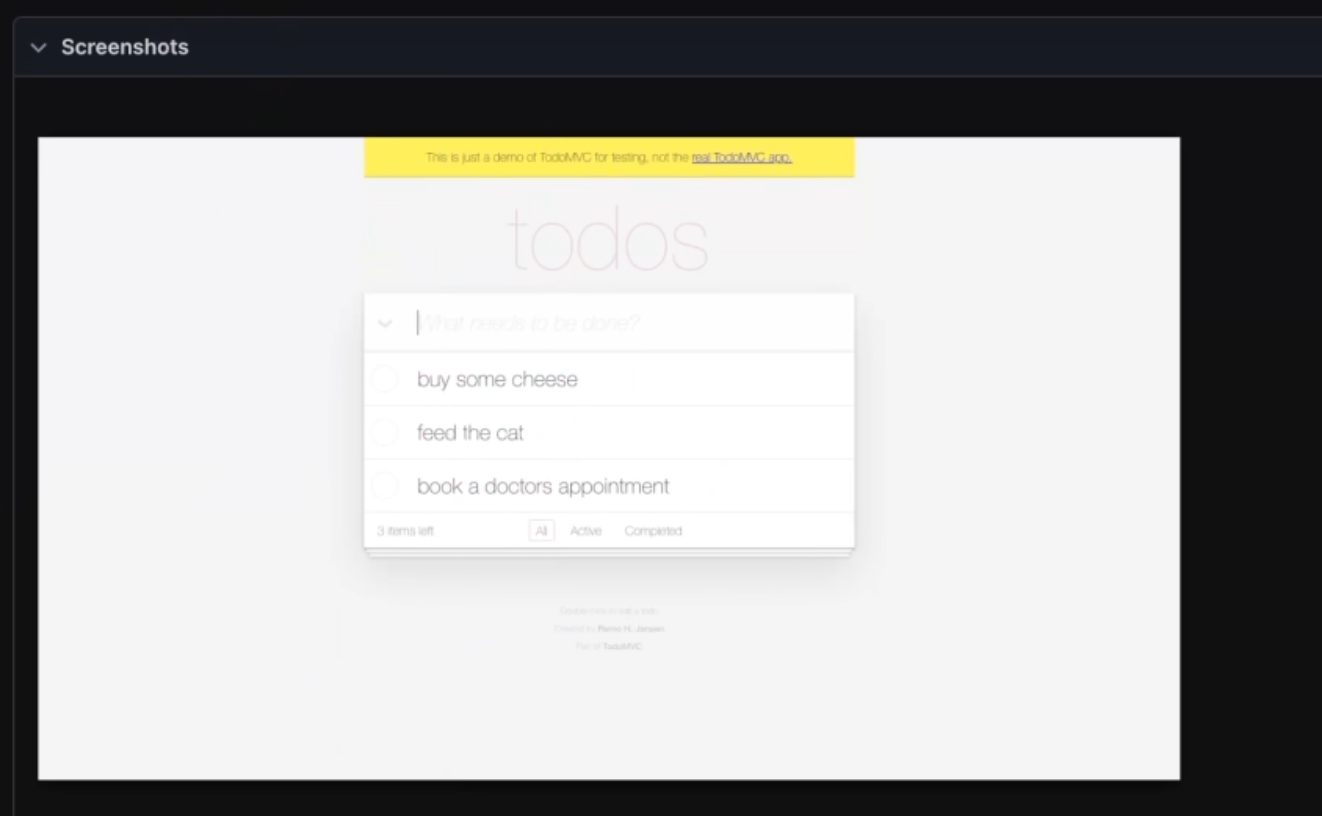
You can also see that because in our Playwright config file, we do have screenshots and this is the screenshot that it took at that exact moment.
You can see here as well that the test failed on this step, and here is the line of code that it wasn't able to execute.
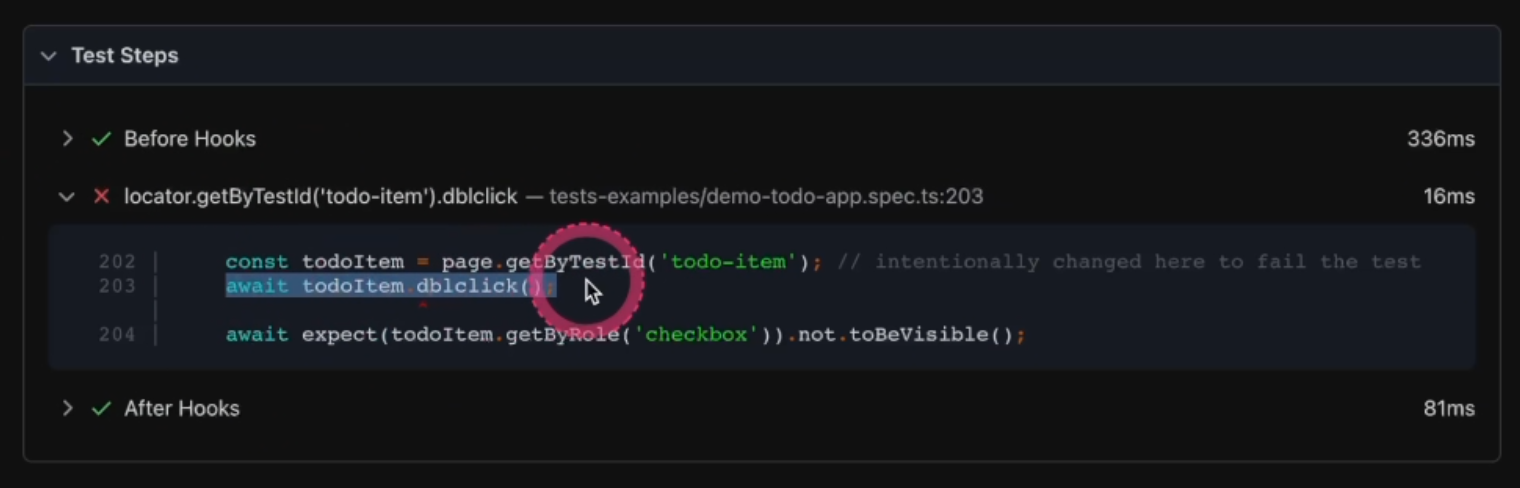
Sometimes, the error will happen on the previous line, so keep in mind that you need to understand what's going on with your application so you can provide the correct fix.
And because we also informed in our Playwright config file that we do want to trace the errors, first Retry tab - "Retry #1" - we can see that we have the trace.
If you open the trace, this is what you see.
You see the list of commands each step has here on the left side and you can see the call that threw the error here.
You can see the browser console. You can even see the network tab, and in some cases, if you are using API tests or API calls, you can see what you sent and received.
You can see the state of each step when you mouse over, and it'll show up here on this big image and you can also pick a locator if you need by clicking it.
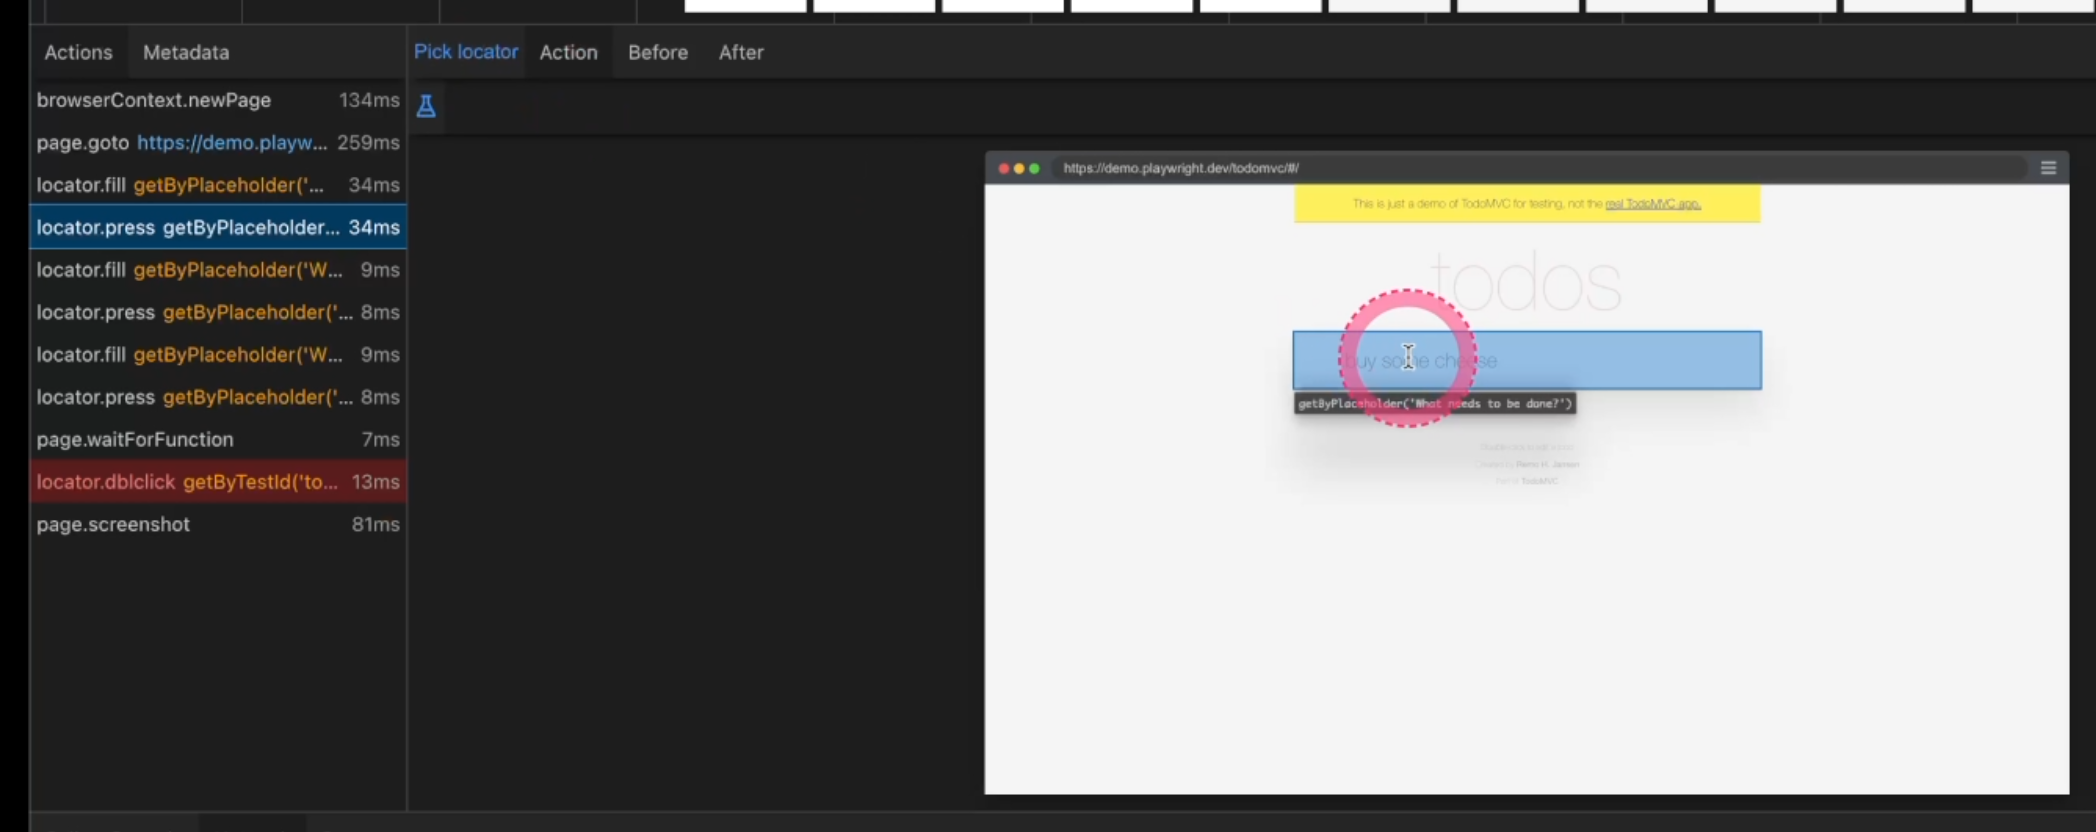
"Pick locator" and mouse over the element and it will going to show up.
Here you can also see the "Action" and "Before" and "After each step.
And here, you also have the timeline of each command.
Back to the report.
You can filter your tests here by Status.
"Flaky" is going to be when it fails one time, but passes on the retry so it'll be marked as "flaky".
"Skipped" if you used .skip, "passed" of course the passed ones, and "failed" the ones that failed.
We can note that on "Retry #2", we do not have the trace, and again, this is because of the parameters we configured here in our Playwright config on-first-retry.
You can change it to whichever value you prefer, and also you can remove the screenshot if you are using the trace.
This way your application will be lighter and it will consume less space in your server.
Another important setup is the reporter.
Here we are using html, by default from Playwright, and the numbers of retries.
That is the information required to run a nice report.
And back to the report one more time.
We can see that the other test that failed was not due to a locator issue. It was due to a result issue.
You can see here that you have the command expect and toHaveText - this is what was expected and this is what it was received.

So, Playwright will also inform you whenever a test fails due to expected results and you can also see which line it failed.
If you scroll down, you can see the same test steps, the screenshot, and on the first retry you can see the trace.
You just click at the image, it will load, and you can see the same things we saw on the other trace.
Another way to troubleshoot issues is through the Playwright extension.
You see this icon here on the left side, and if you click it'll show a list of all the tests.
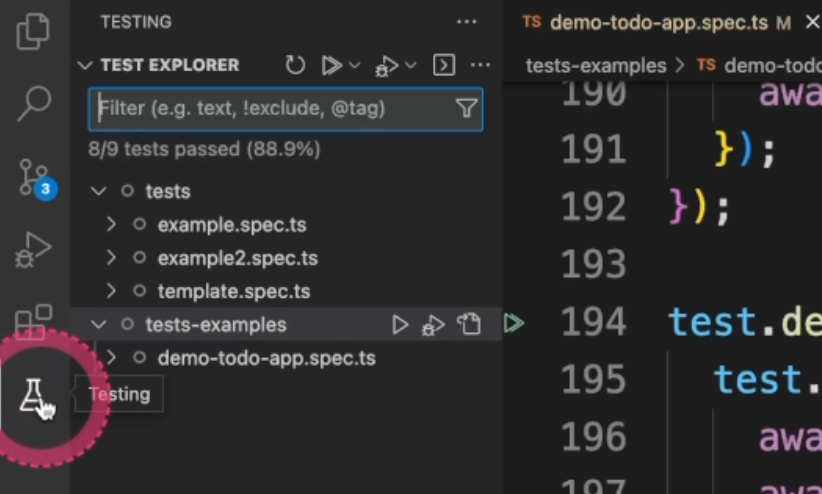
You can filter, you can run them all in all browsers or by browser projects that you have in your Playwright config file.
You can debug the same way as running individual tests.
You can, down here, see a list of a few options available such as "Pick locator", "Record new", "Record at cursor", "Reveal test output", and "Close all browsers" when you finish your tests, and a few other commands here.
Once you run the test via extension, it will run the test for you and you can find a solution faster for your problems.
Still, inside the Playwright extension, you do have the option to debug.
You can add breakpoints by clicking on the left side here.
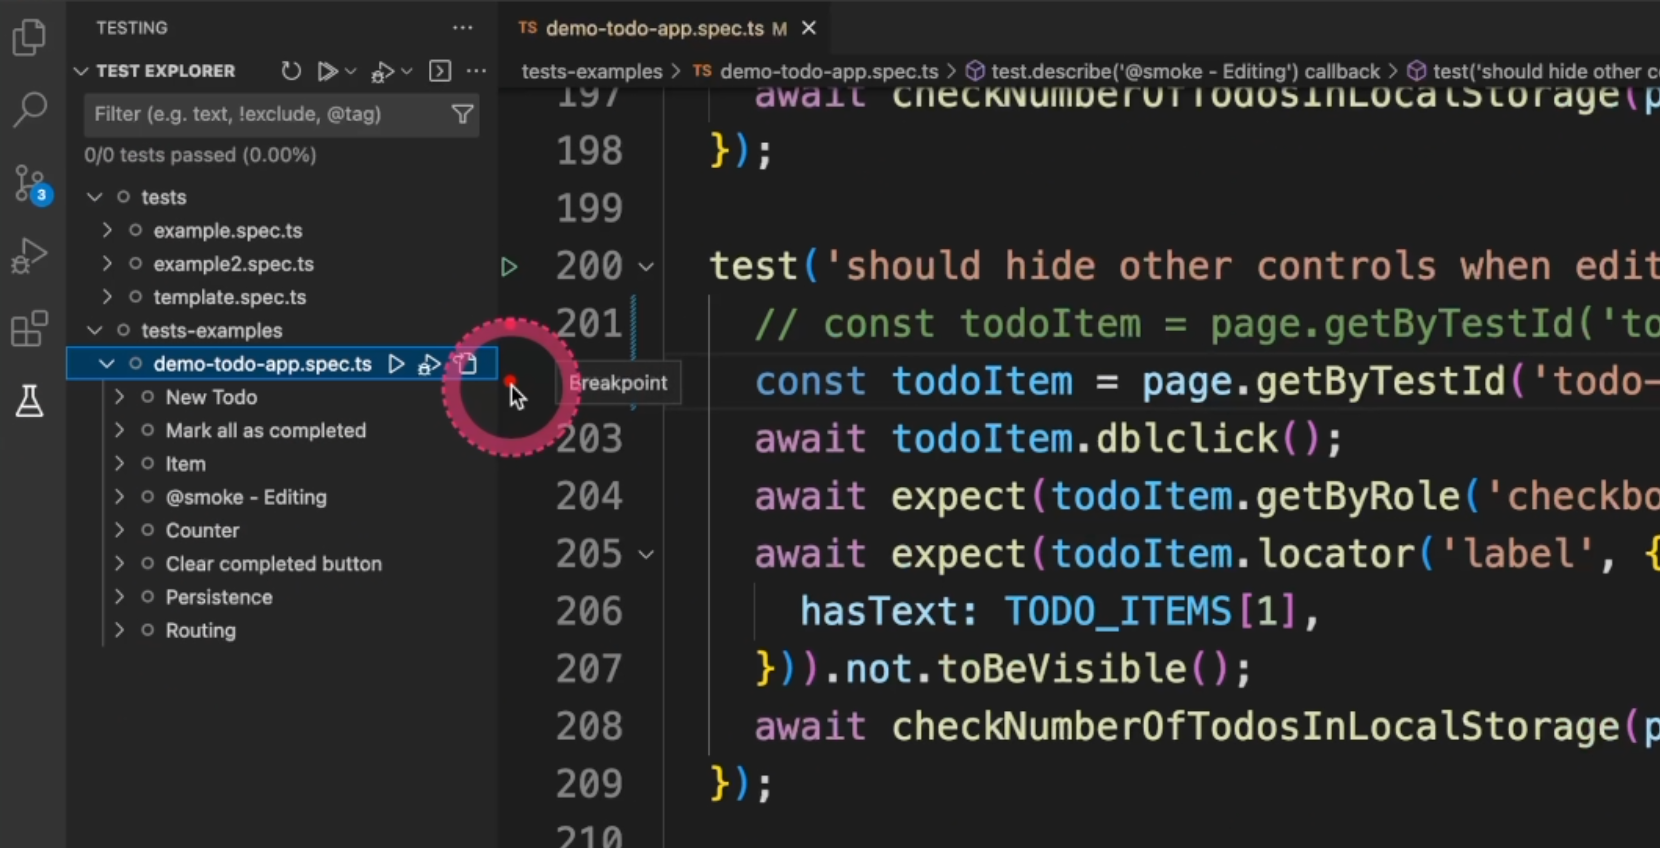
If you click, you add a breakpoint and if you click again, you remove a breakpoint.
You could also go to this tab and manage all your breakpoints down here.
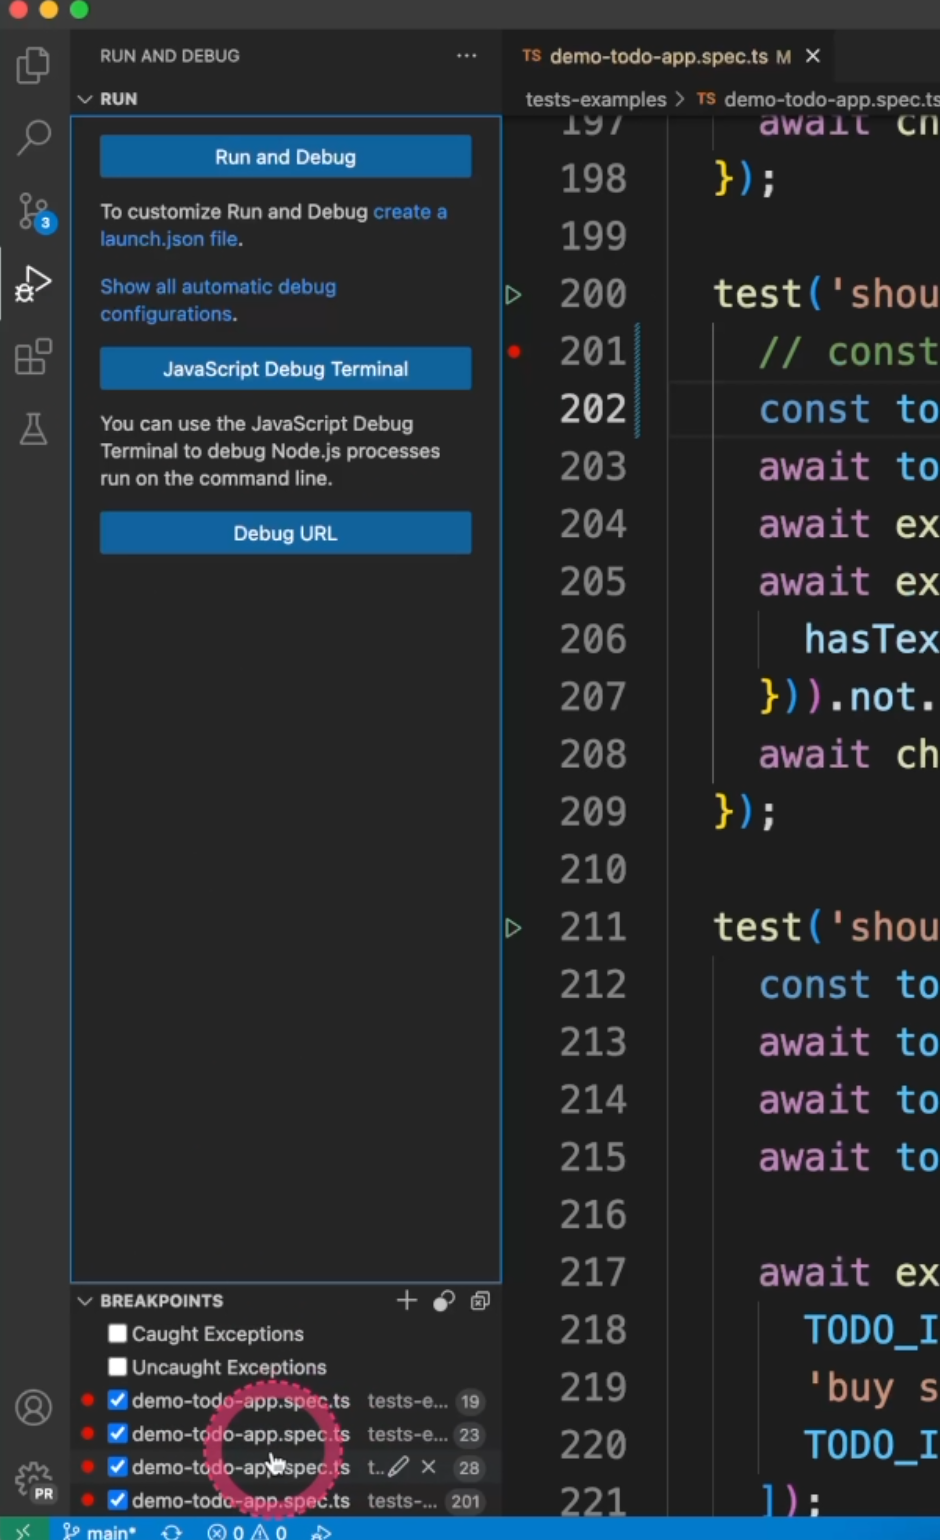
You can skip one or you can skip all.
You can delete all at the same time.
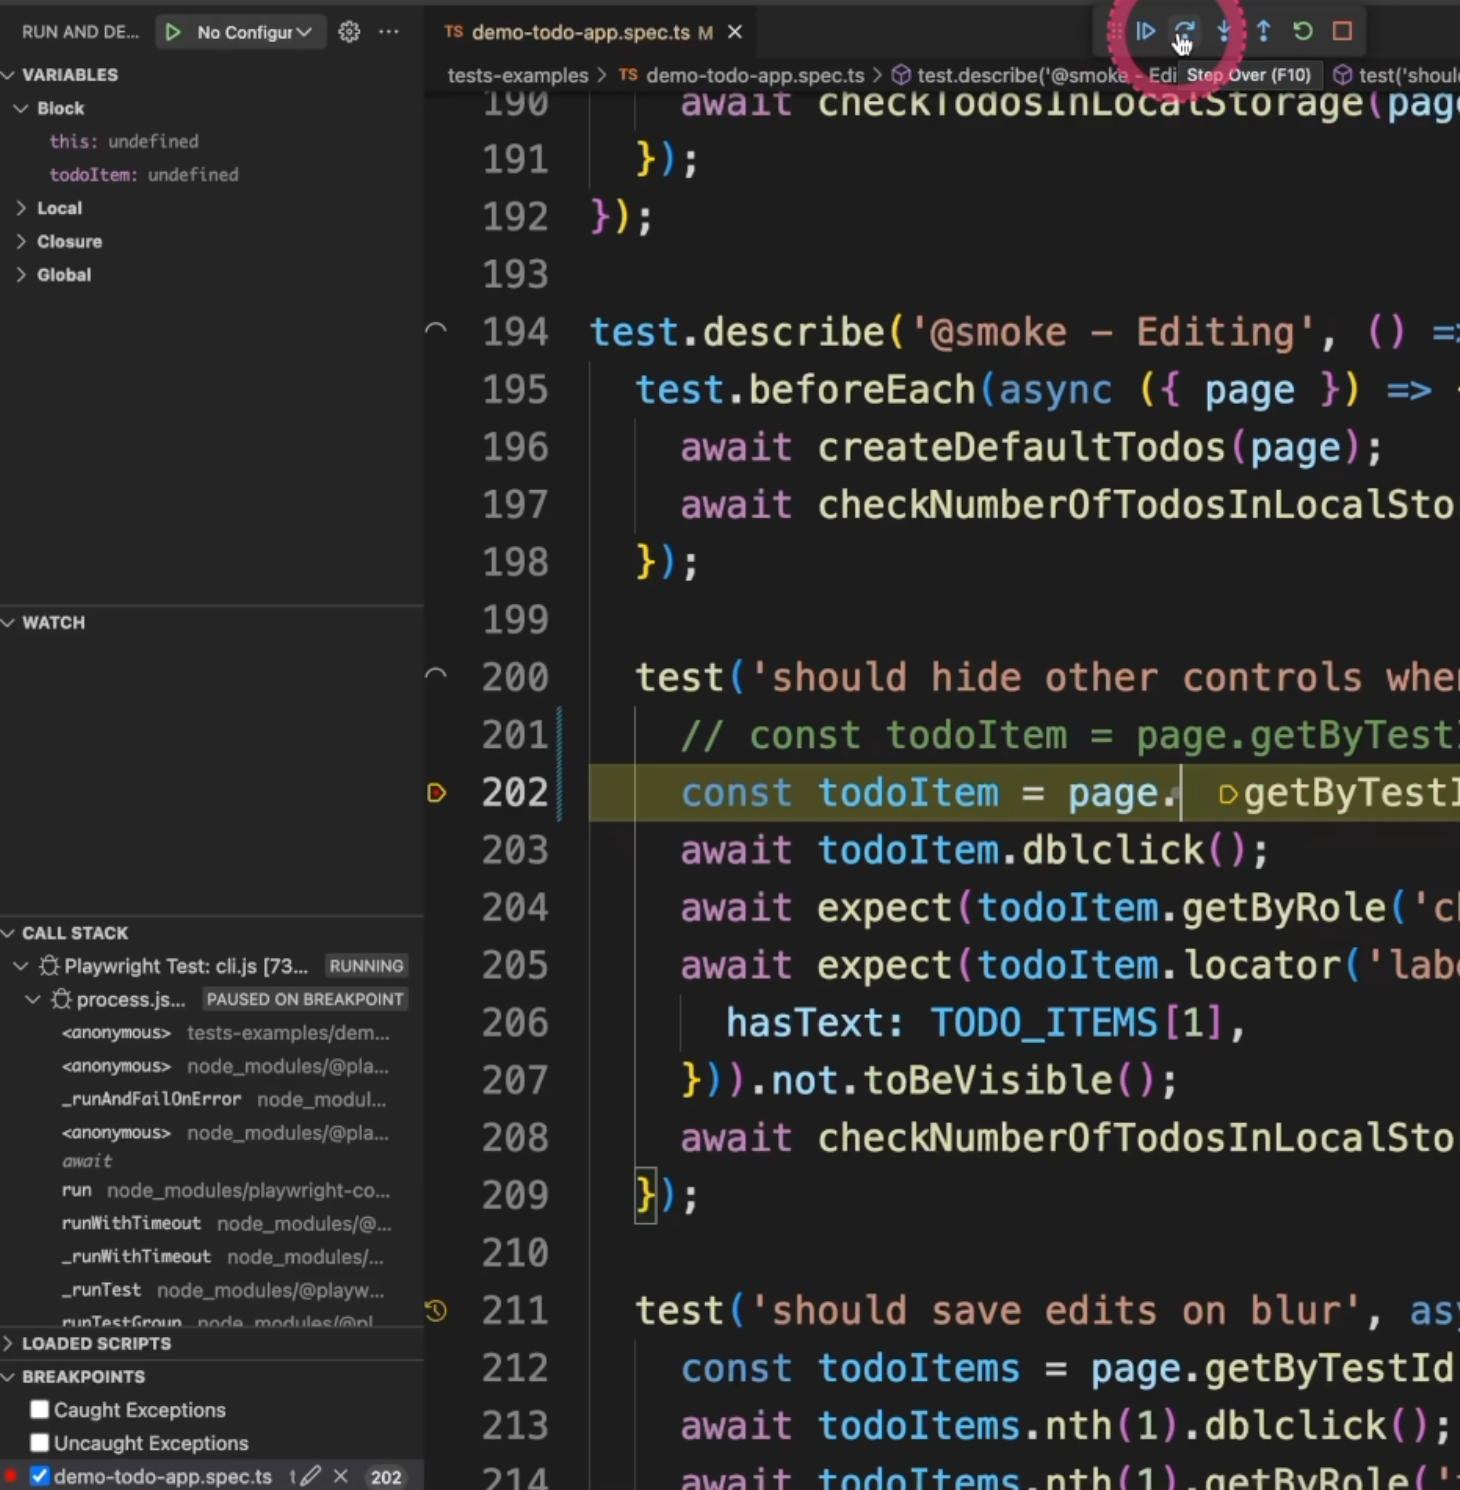
So let's add a breakpoint here, go back to the extension, and by clicking at this play icon with the bug, you will start the debug mode.
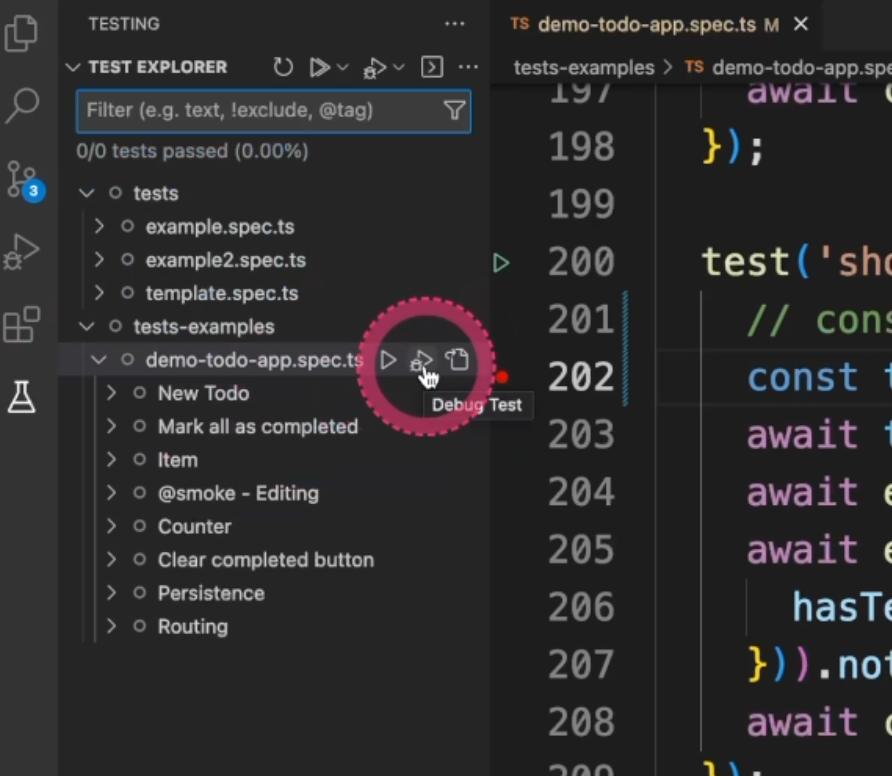
It will run the test for you and stop where it fails.
In this case, we want to go to the next one, so we'll just hit "Play".
It will show the error message, and it'll stop at the breakpoint you wanted.
You can "Play" and "Continue".
You can "Step over", "Step into", "Step out", "Restart", and you can "Stop" the debug mode.
Here you can see the list of variables, you can add watchers if you want, and you see the Call Stack here as well.
It will show the list of problems here, and show the failing test on the left side.
You can delete the error message to clean your test and refresh the test session so you can get a new start.
You can have access to both experiences via command line too.
You will type in:
npx playwright test tests-examples/ --project=chromium –-debug
You can add --debug to run in debug mode or --ui to run in UI mode.
Make sure to check the documentation and the external resources to have a full understanding of these functionalities.
They are pretty helpful and with this, we complete our introduction to Playwright training.
It has been a huge pleasure to me and I hope to you as well. If you have any questions or would like to connect, you can find my information on my website, testingwithrenata.com. I'll see you around. Happy testing.
Resources
- Introduction to Playwright - GitHub repository - Branch 5
- Chapter 5 - Extra Exercises
- Chapter 5 - Extra Resources
