

Transcripted Summary
Welcome to part two, where we'll be giving a Postman tour.
Now, if you're someone who's used Postman for some time, you might consider it as just a tool for ad hoc or exploratory API testing.
Of course, it does do that fantastically well, but in recent years, Postman’s added loads of new features that will really help you take your automated API testing forward.
Let's take a really quick tour.
When you start the app for the first time you'll land on the home page.
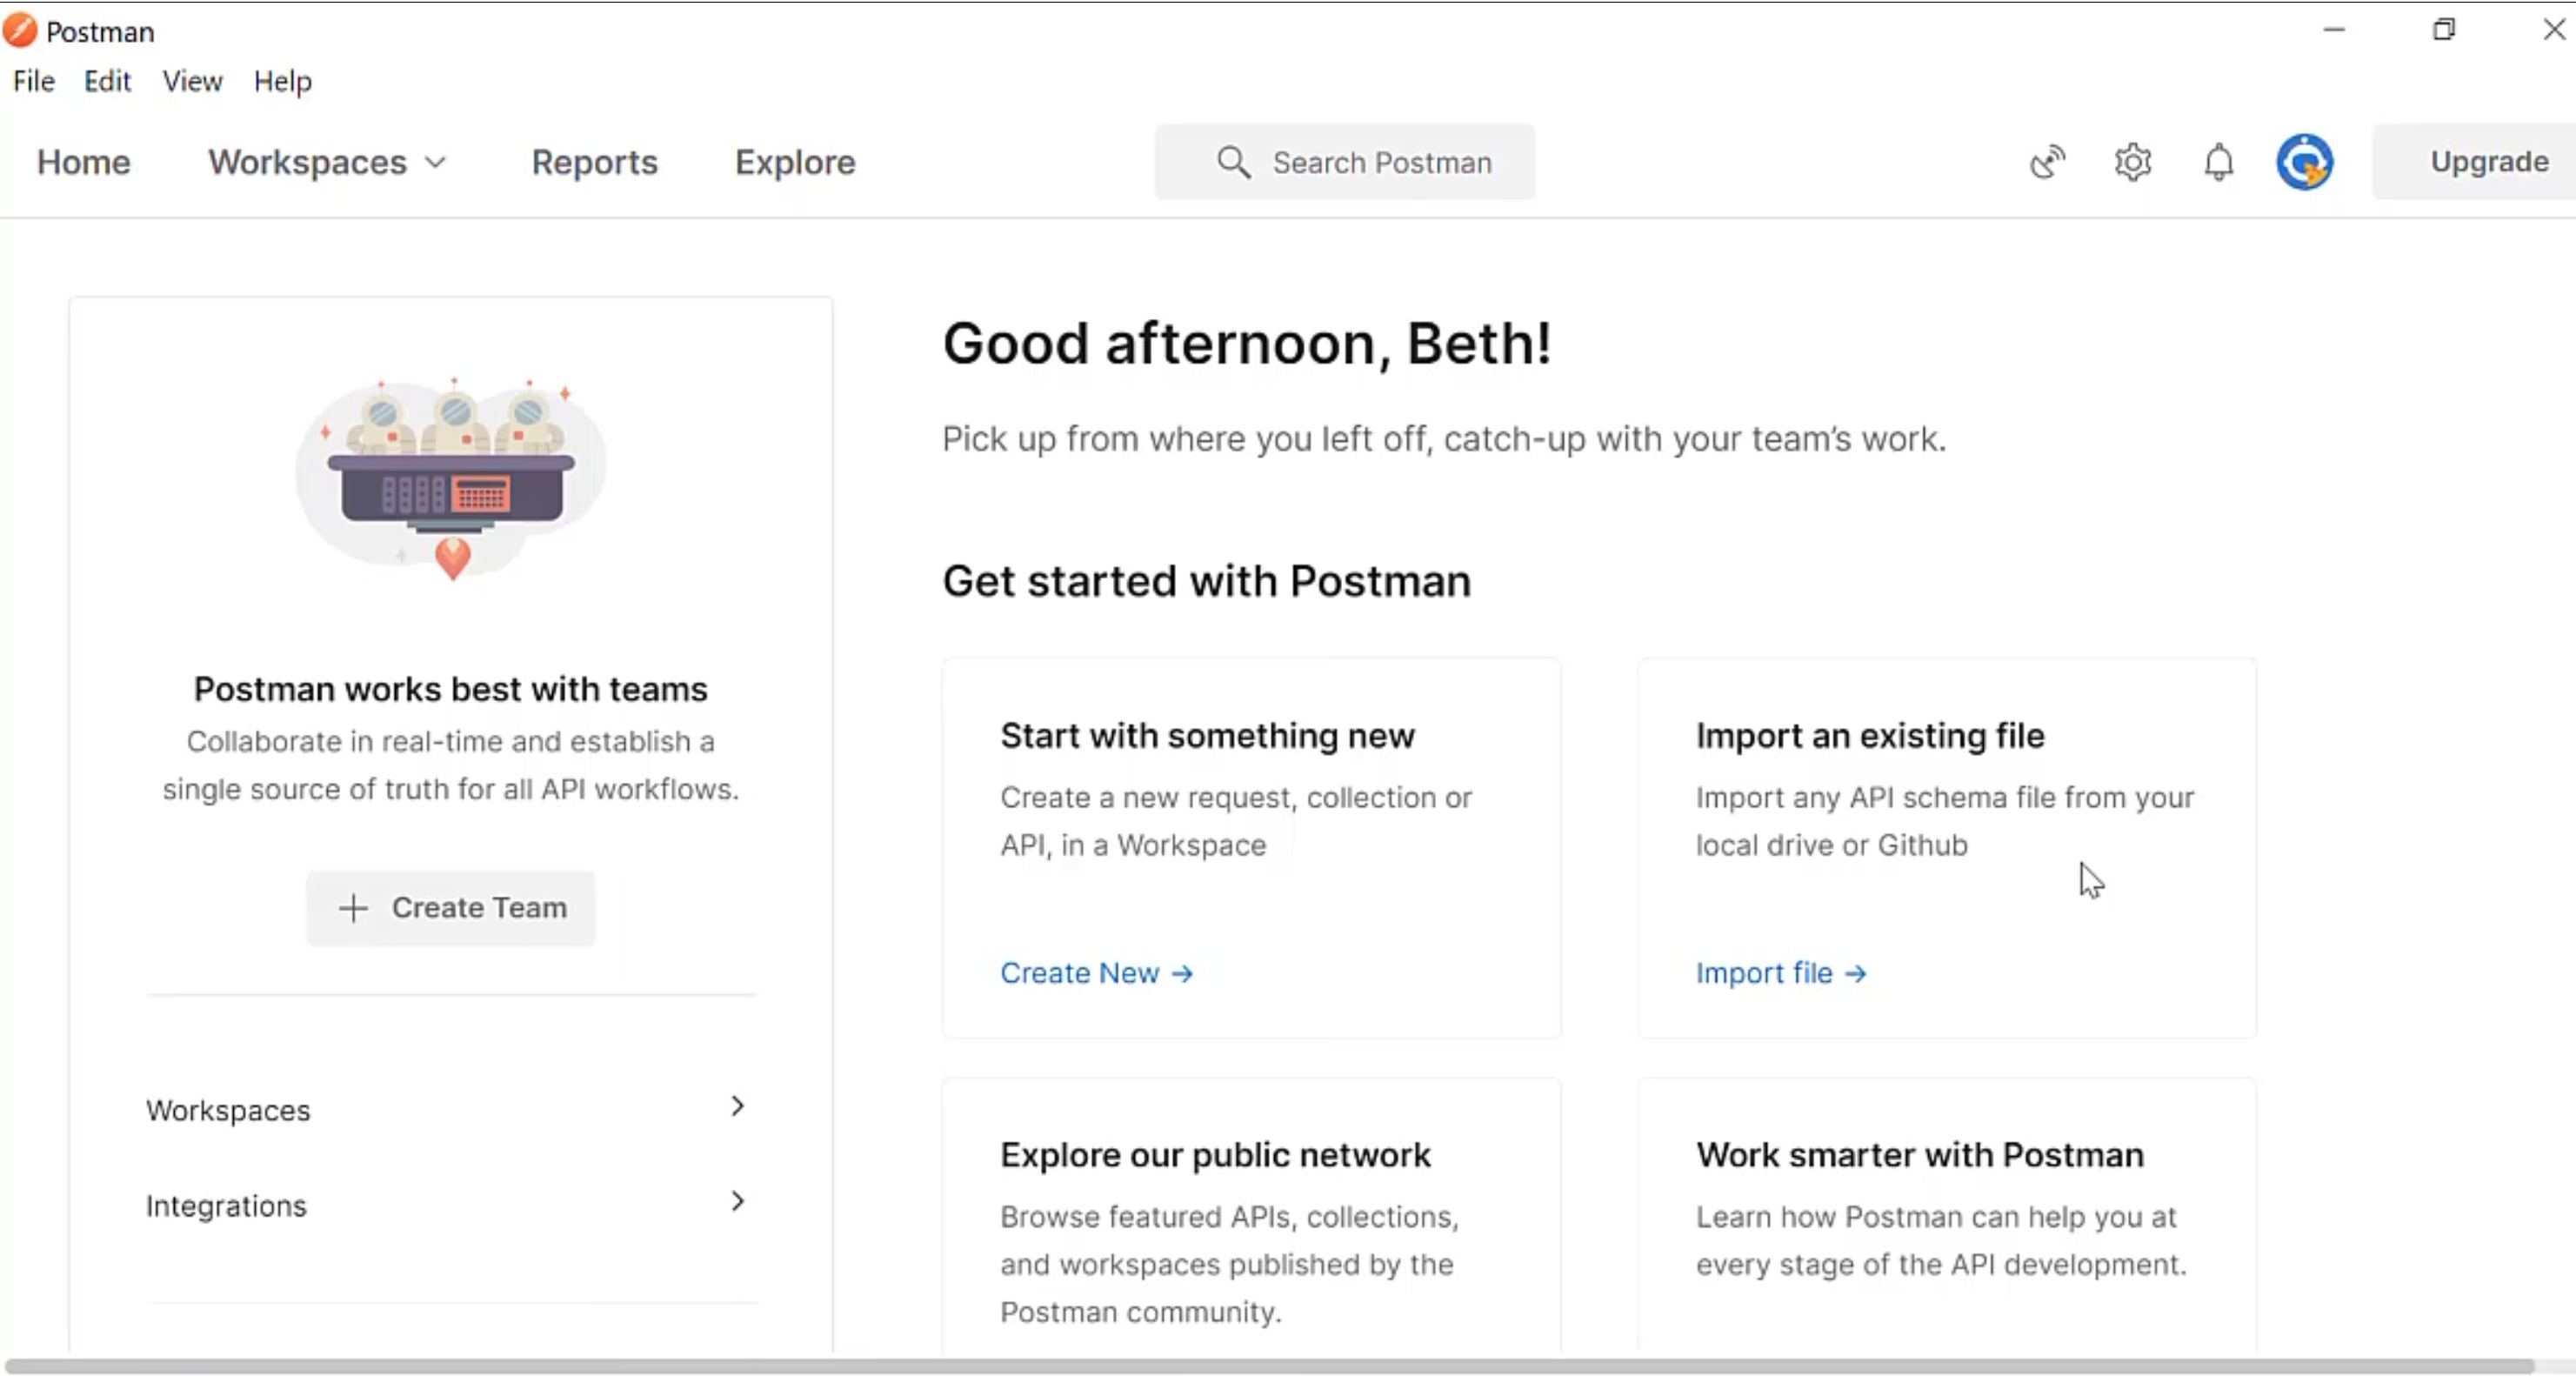
This gives you some inspiration of where you might want to start - whether that's creating a new request, importing code or looking at public APIs.
Don't worry if some of this confuses you.
We will cover all of these things later on in the course.
For now, let's hit "Workspaces" and take a look.
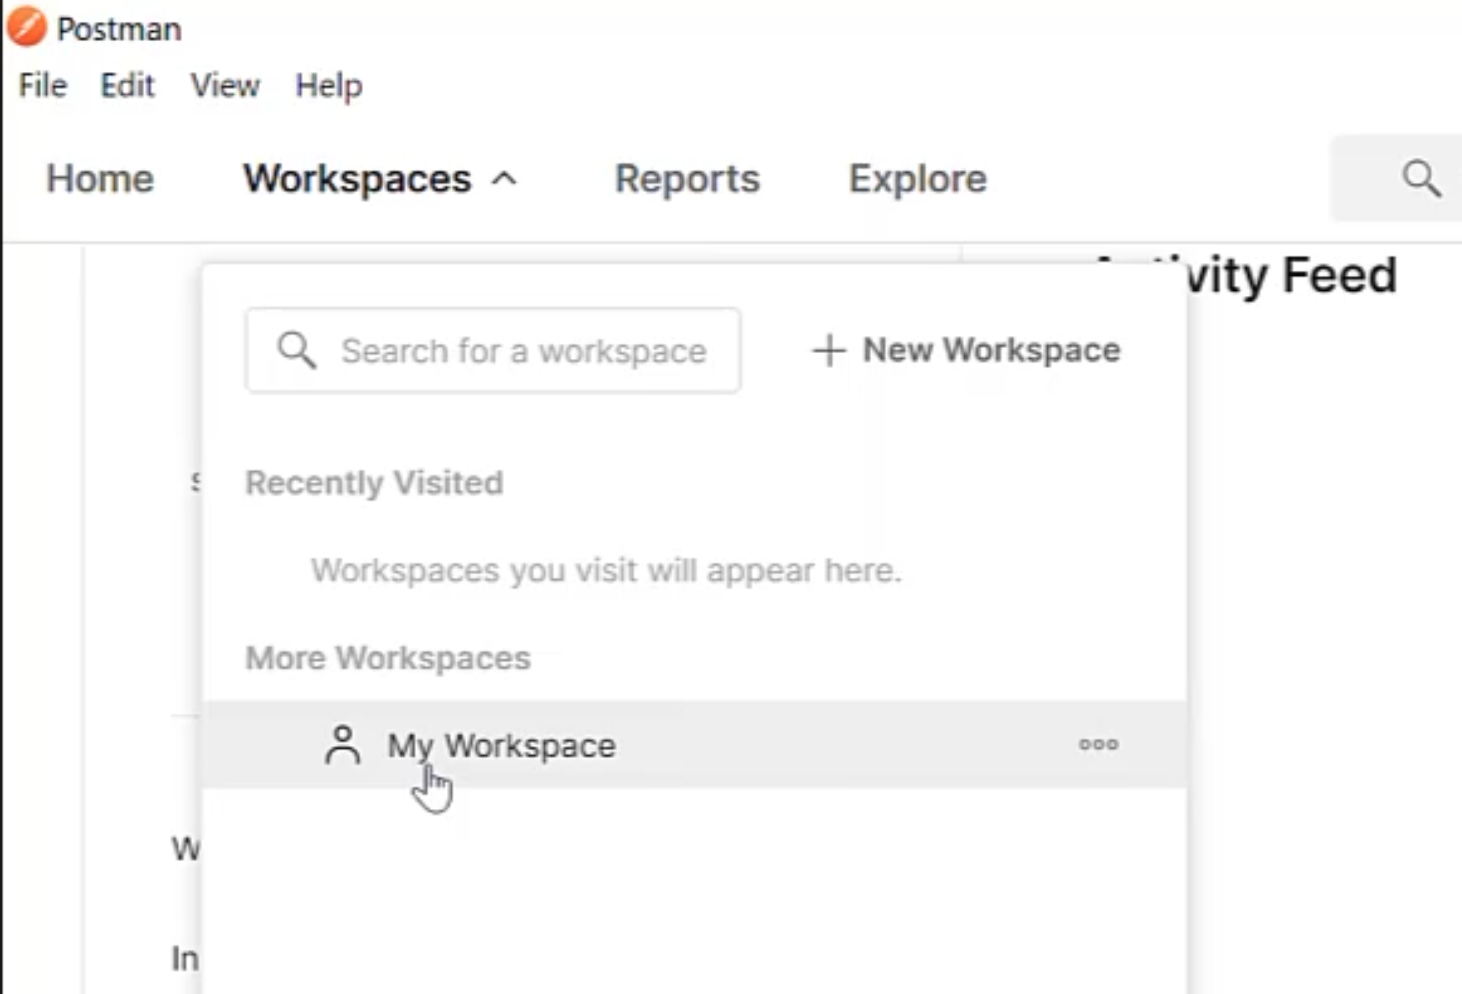
This is, as the term implies, the space where you will do your work.
Think of it as a folder; it's where you see a high level view of your APIs, and it can be private to you, or it can be a team workspace that you share with other people.
On the left hand panel are all of the key features of the Postman platform.
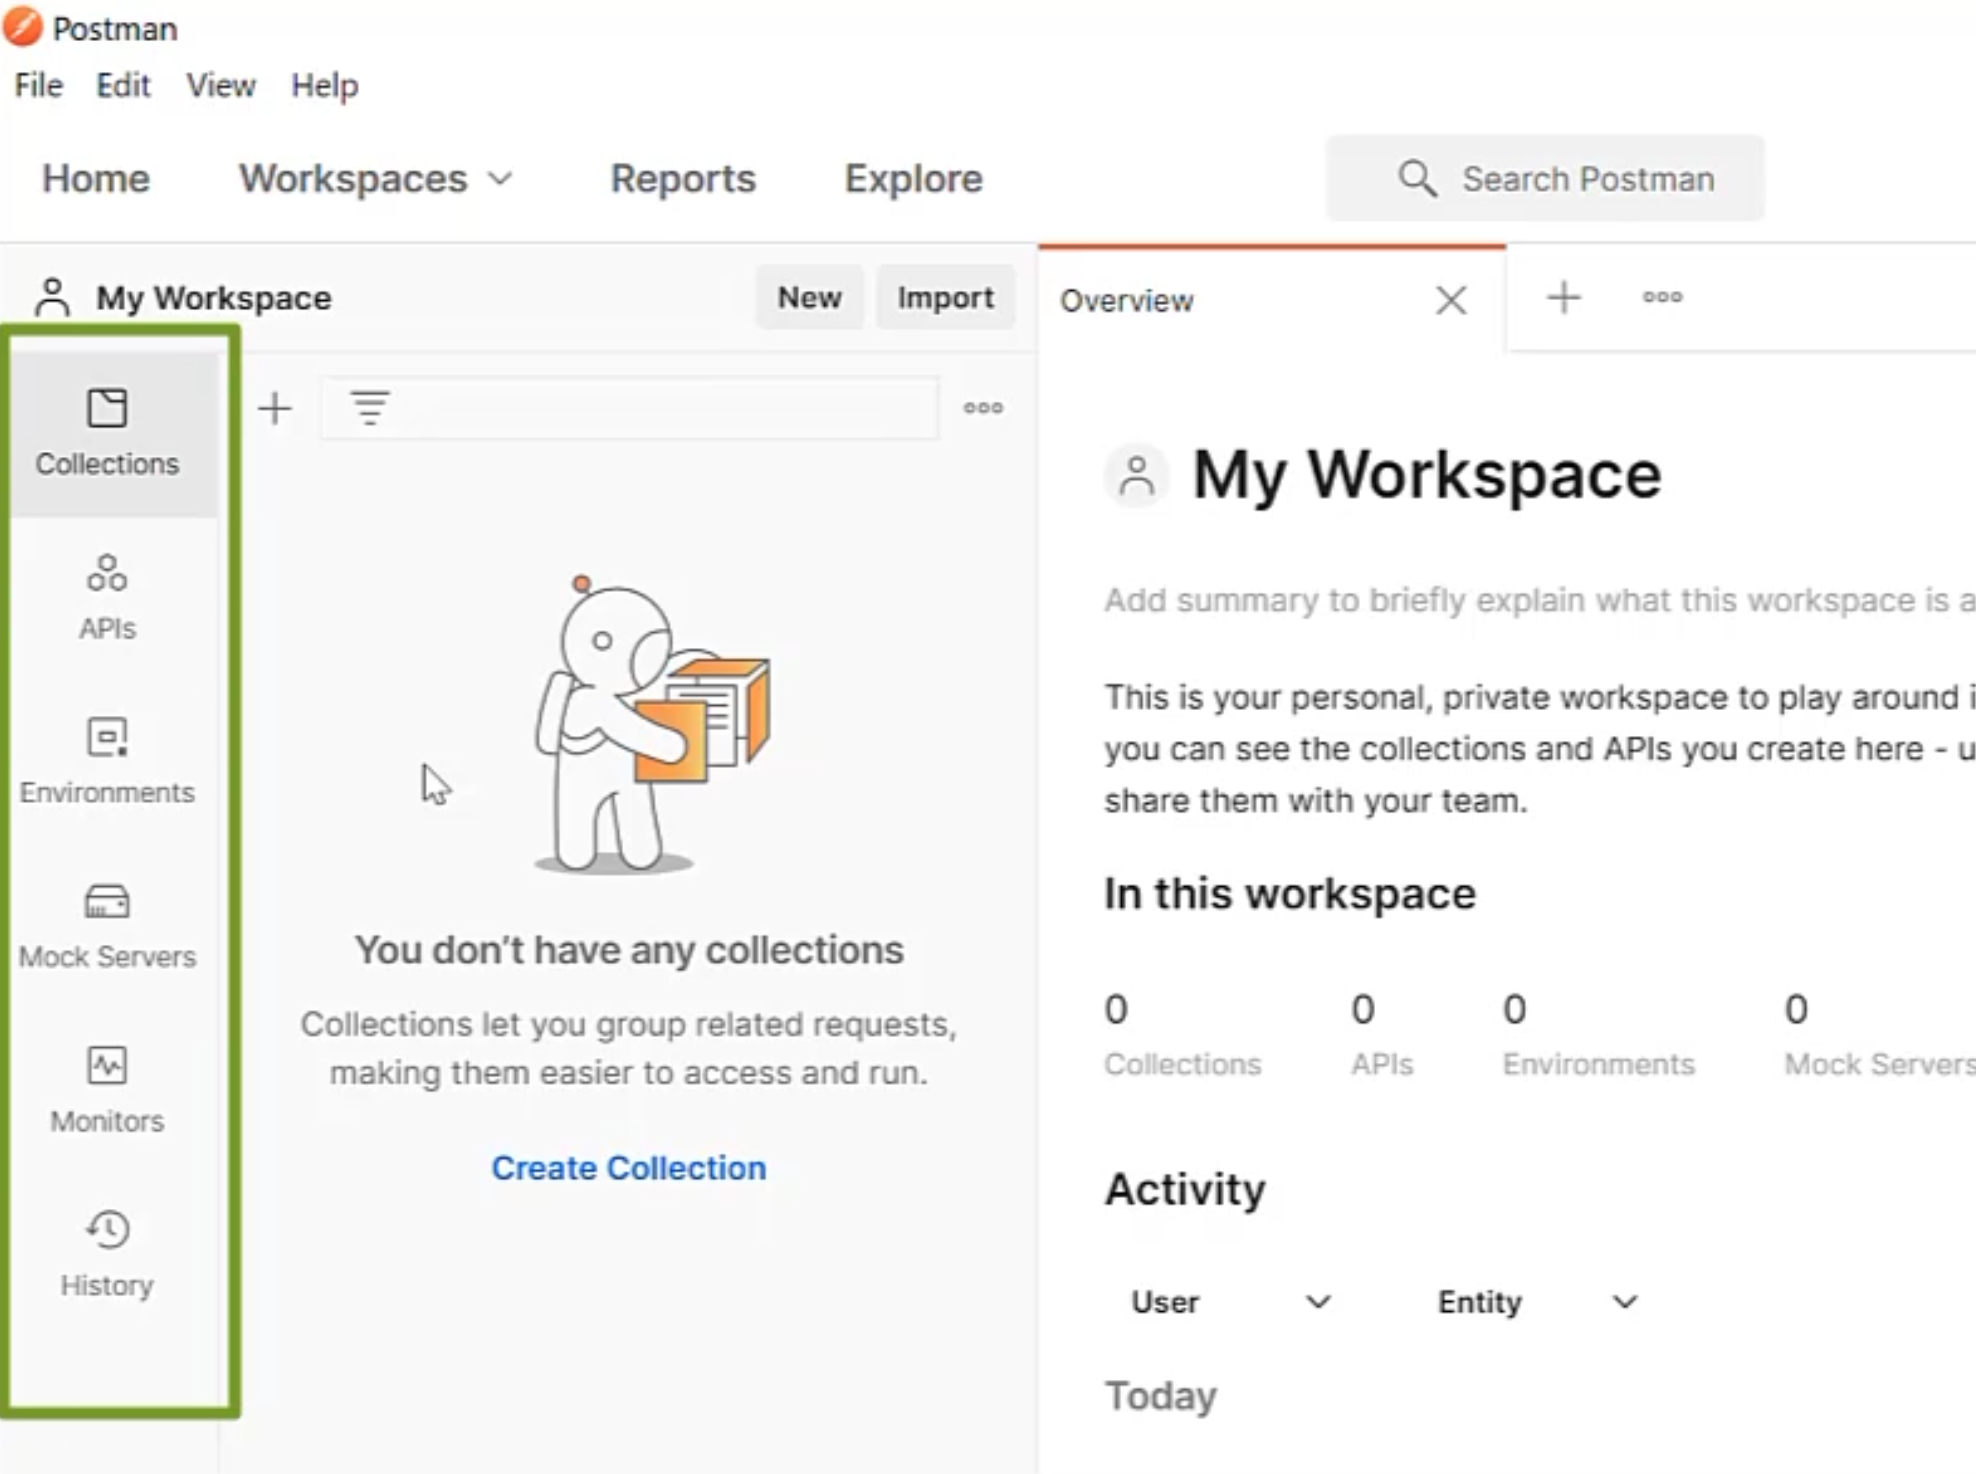
"Collections" are where you organize your APIs into groups.
"APIs" show you all the APIs that you're working with.
"Environments" are really important. This is where you can group your variables according to the environment you want to run them in. Whether that's Prod, Dev, QA, etc.
We'll look at "Mock Servers" in a moment, but for now it's enough to know this is where you go if you want to look at anything created to mock endpoints.
Any "Monitors" you set up will be accessible here.
By the end of this course, you should have something populated in all of these sections.
Finally, the "History" section, which is an audit log of all the requests that you've sent. It's empty because - you guessed it, we haven't run any API tests yet.
Should we do something about that?
Quiz
The quiz for this chapter can be found in Chapter 1.3
