

Transcripted Summary
In this chapter, we're going to be talking about monitors.
Monitors are a very useful feature in Postman because they help us to understand what's going on with our APIs and really quickly respond to issues if the performance or health of our APIs isn't as it should be.
For example, if an API is released to production, we can tell by using the monitor if that API is available, or if it's gone down for some reason.
In this chapter, we'll cover the whole life cycle of a Postman monitor.
We'll show you how to create one, how to select specific requests and tests in order to tell the monitor what information it should track, and how to run a monitor on a schedule.
We'll then go through how to check the results of a run using filters to drill down into the details.
Finally, we'll delete the monitor, and that's a really handy thing to do as a free Postman user because you can only make so many monitor requests per month - the current limit is set to 1000.
It's really important to stay under that limit and clearing out any unused monitors is a really good way to do that.
# Create A Monitor
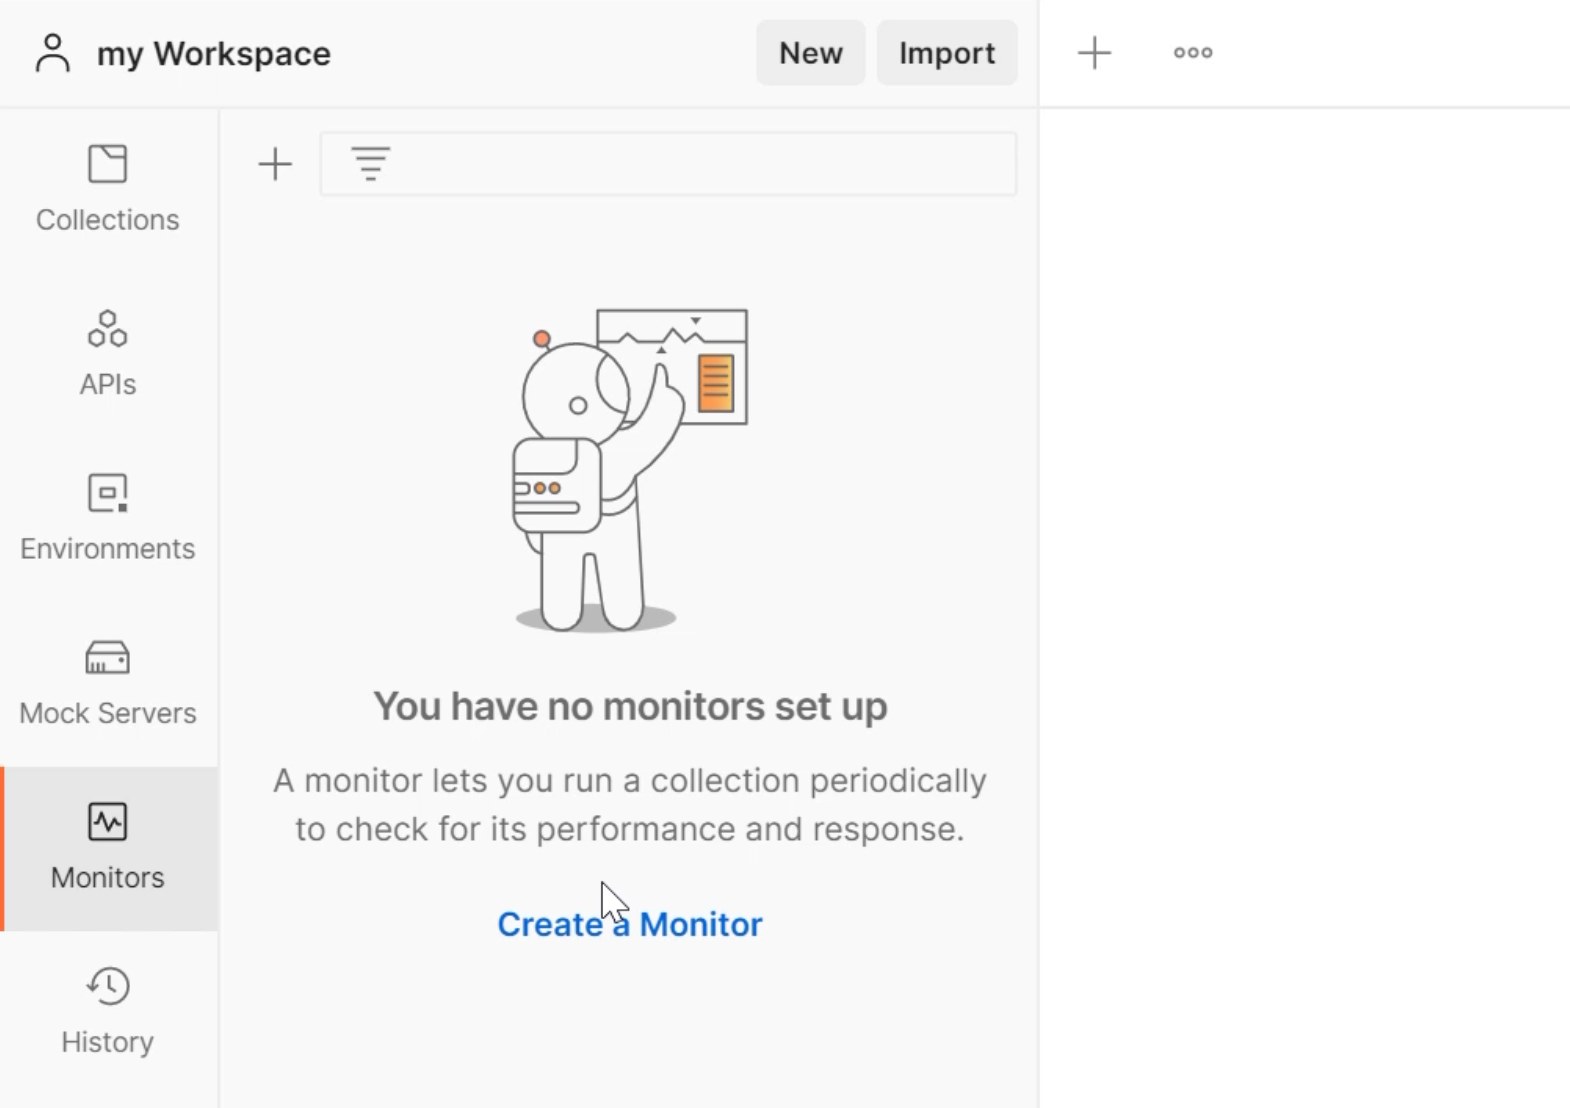
First things first, how do we set up a monitor?
In the left-hand navigation panel here, if we click "Monitors", we can see there are no monitors set up, so we can either create a monitor from scratch or in a very similar way to the mock servers, we can add a monitor against an existing collection.
That's what we'd like to do.
We'd like to add a monitor to our Restful Booker BVT collection.
Hit "Collections" up here, and then in the ellipsis menu, drill down to "Monitor collection".
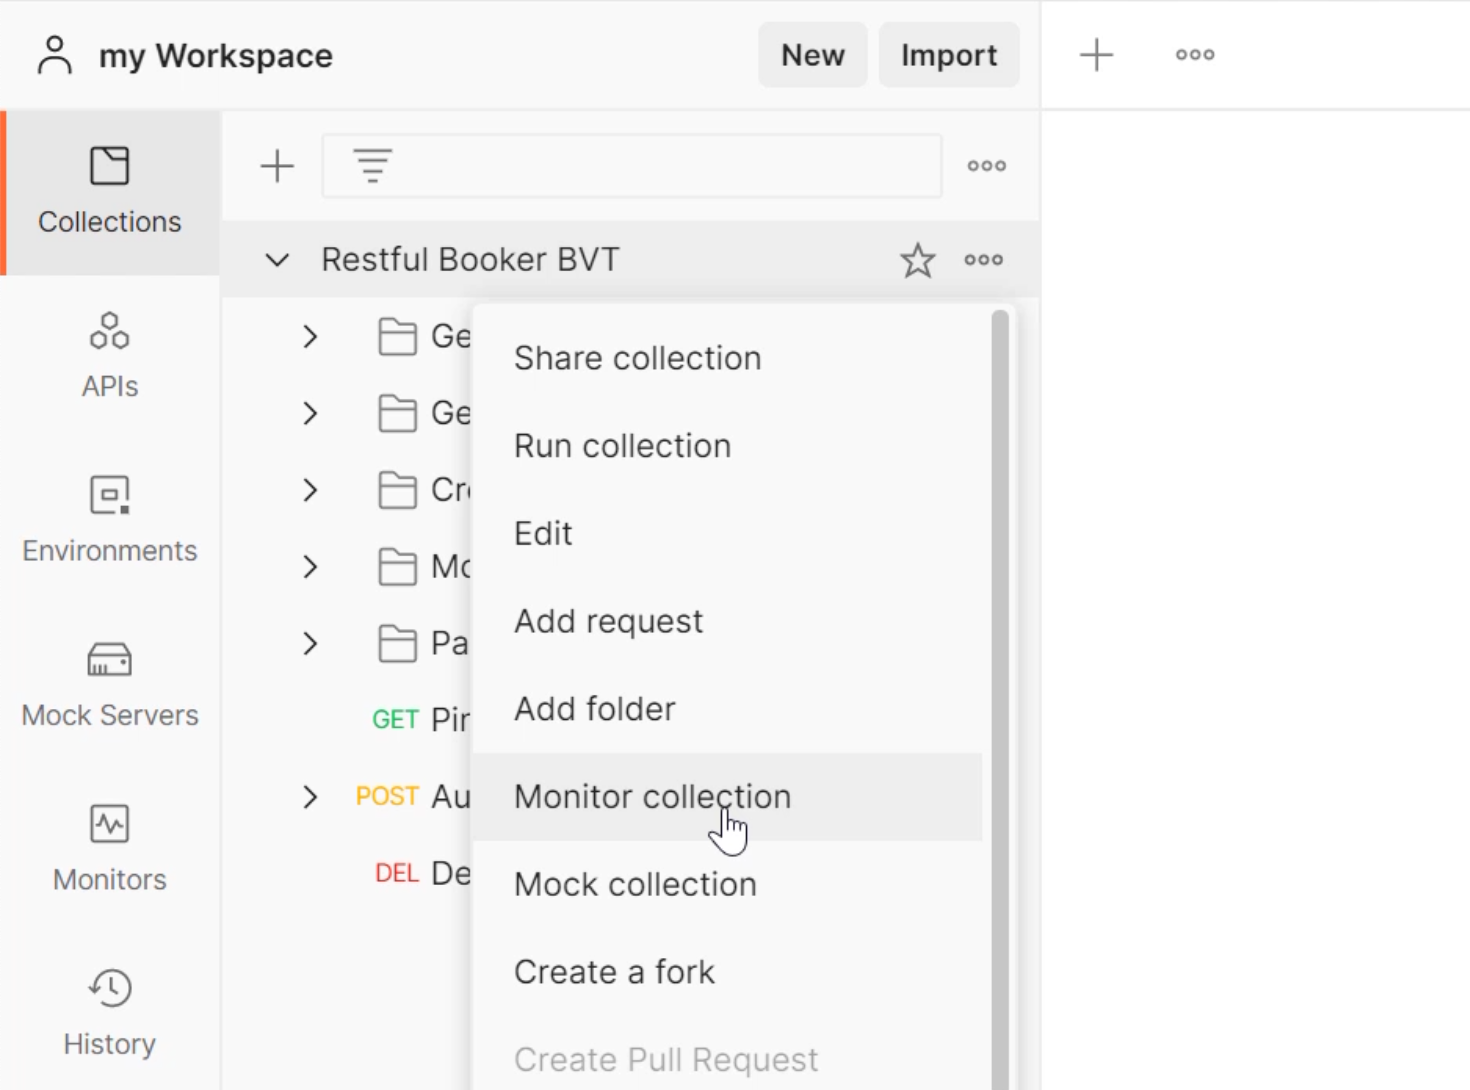
That brings up this "Create a monitor" form here.
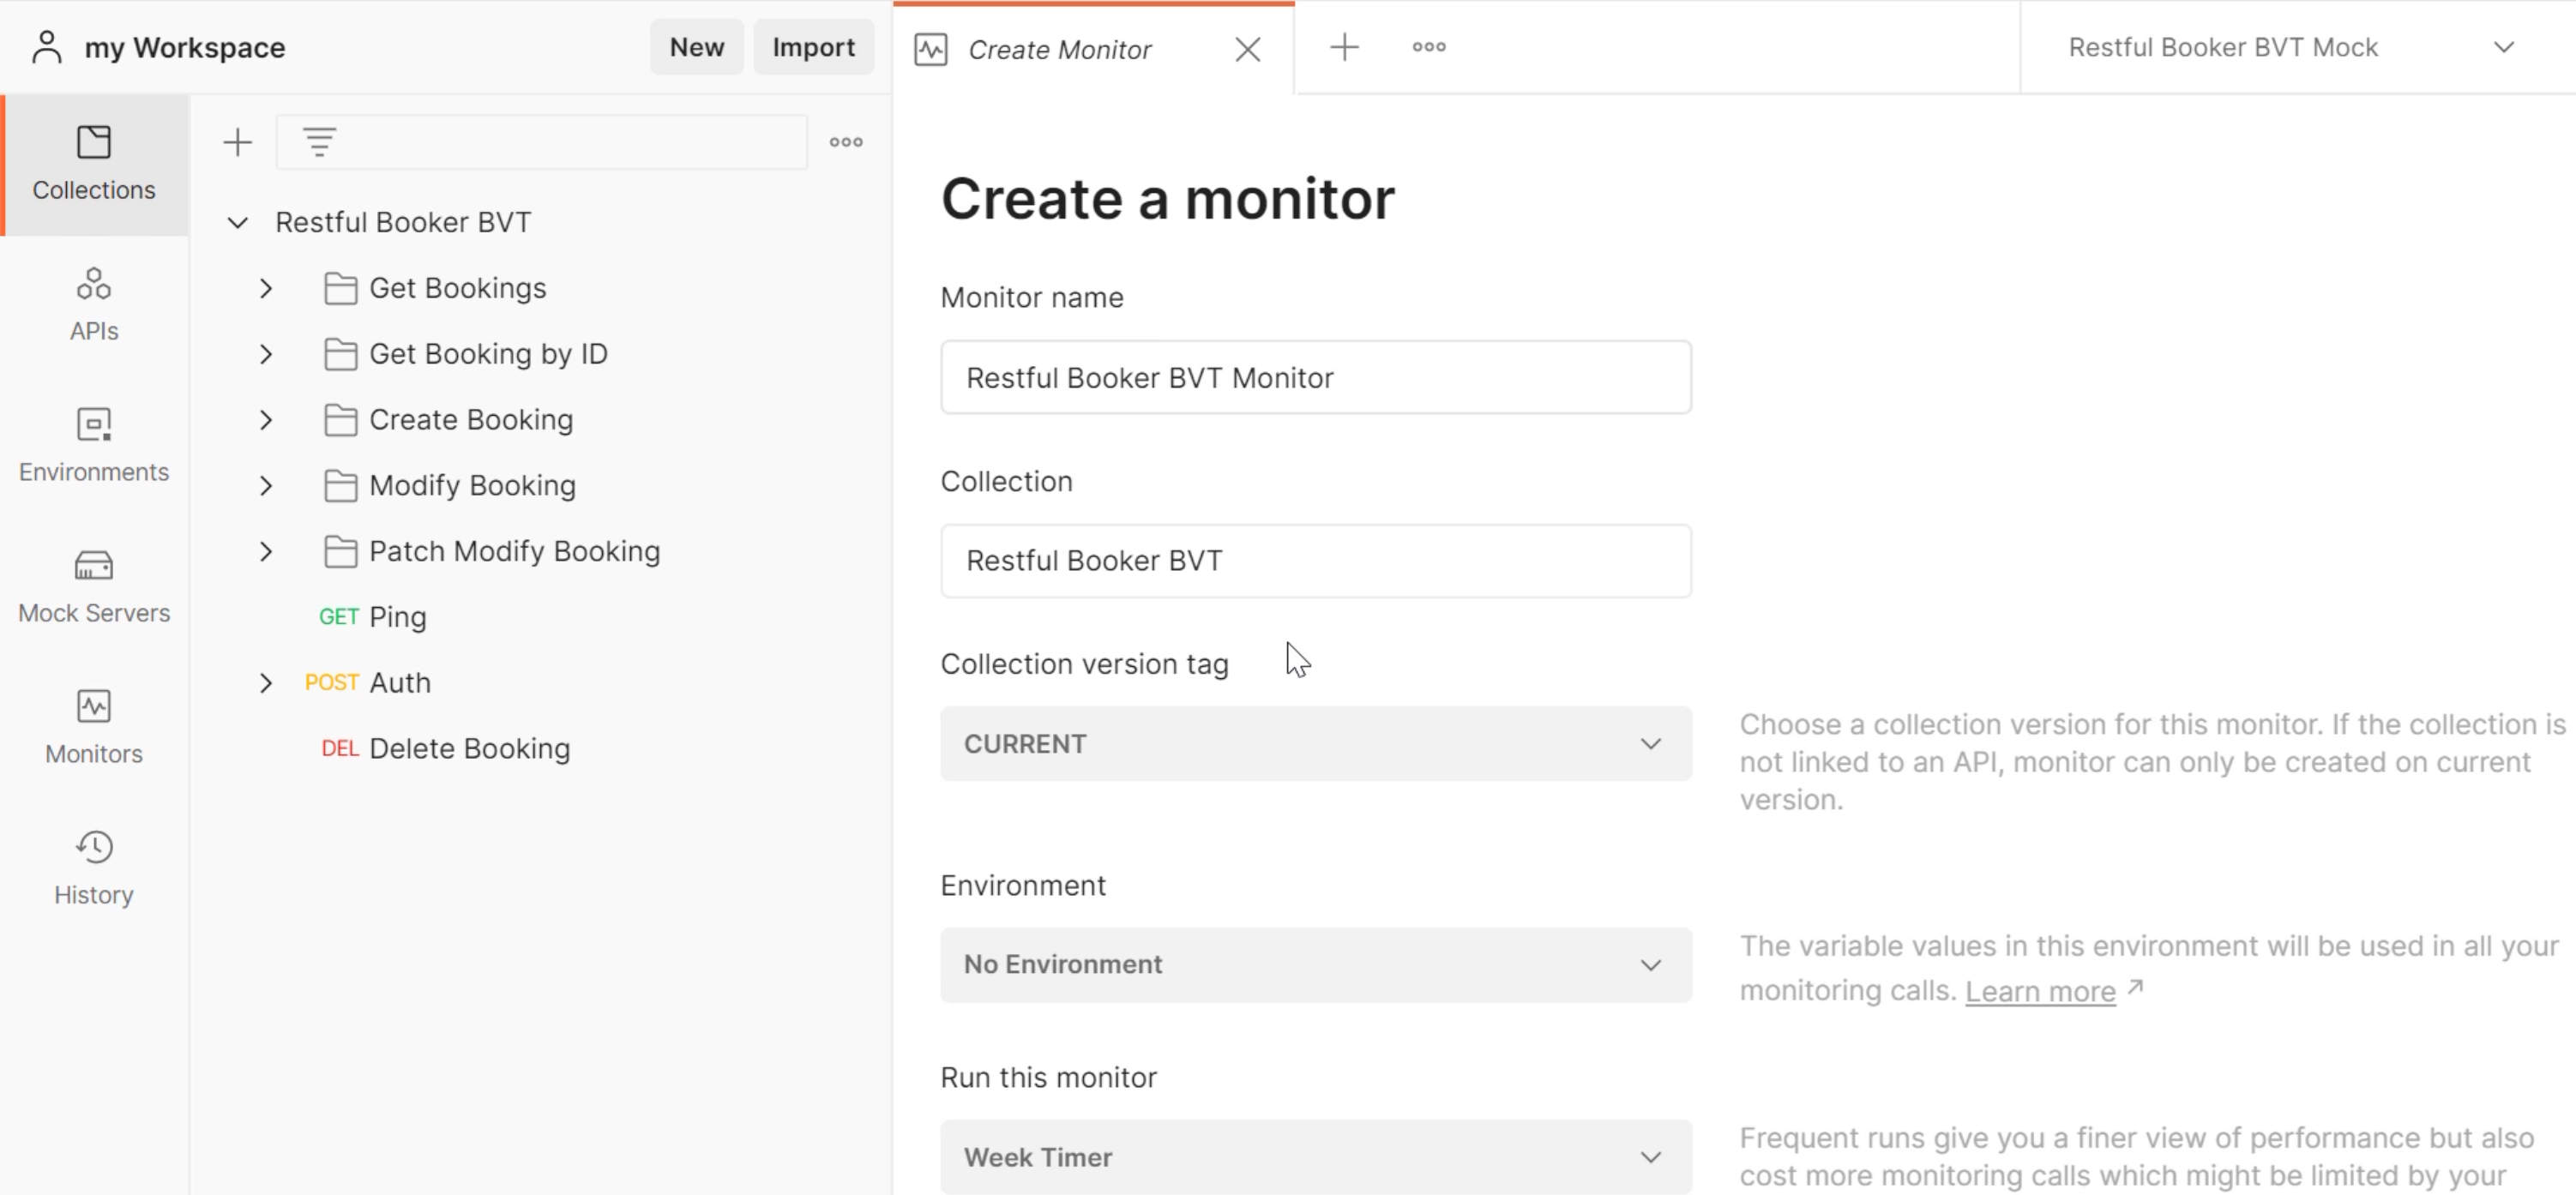
I'm going to give it the name of "Restful Booker BVT Monitor".
We don't need to worry about the collection version - we're only using the "CURRENT" version in this course.
We want to check the monitor against "Production". We don't need to check our mock server.
I'm going to enter "Production" for the environment that we want our monitor to execute against.
This is where you can schedule your frequency of how often you want this monitor to automatically run.
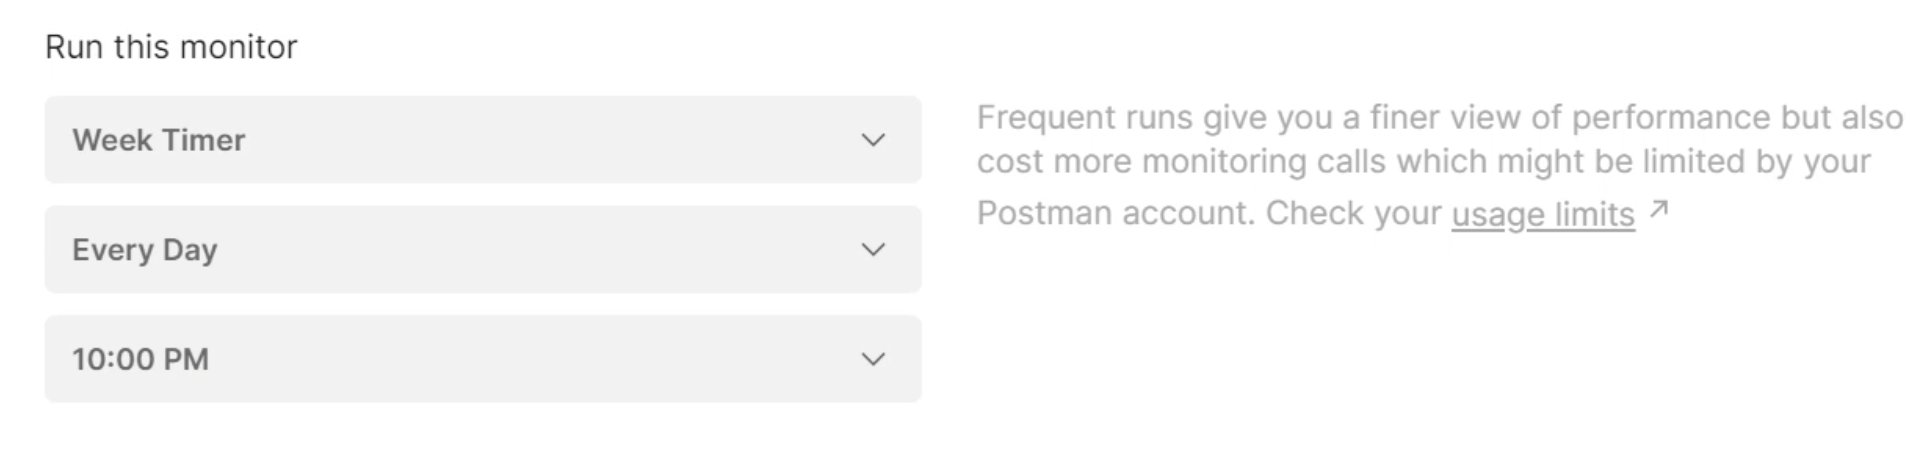
You might want this to run overnight so you can check it in the morning, or be notified when you check your emails to see if something has gone wrong, or you might want that to be way more frequent.
We're going to just set the generic weekly timer - we want it to run every day at 10:00pm.
You can play with the regions if you care about the latency of the API calls, and you're playing around with that.
I'm going to go ahead and receive an email notification for run failures and errors, and just ensure that box is ticked and put your email there.
You can also add another recipient email of other people in your team if you wish.
I'm going to keep all of these unticked, but I'll add a link so you can explore what these mean in detail in the Postman documentation.
Let's create our monitor.
It's as simple as that, and we get a little notification that the monitor has been created.
If we go to our Monitors section, we can see it is now populated.
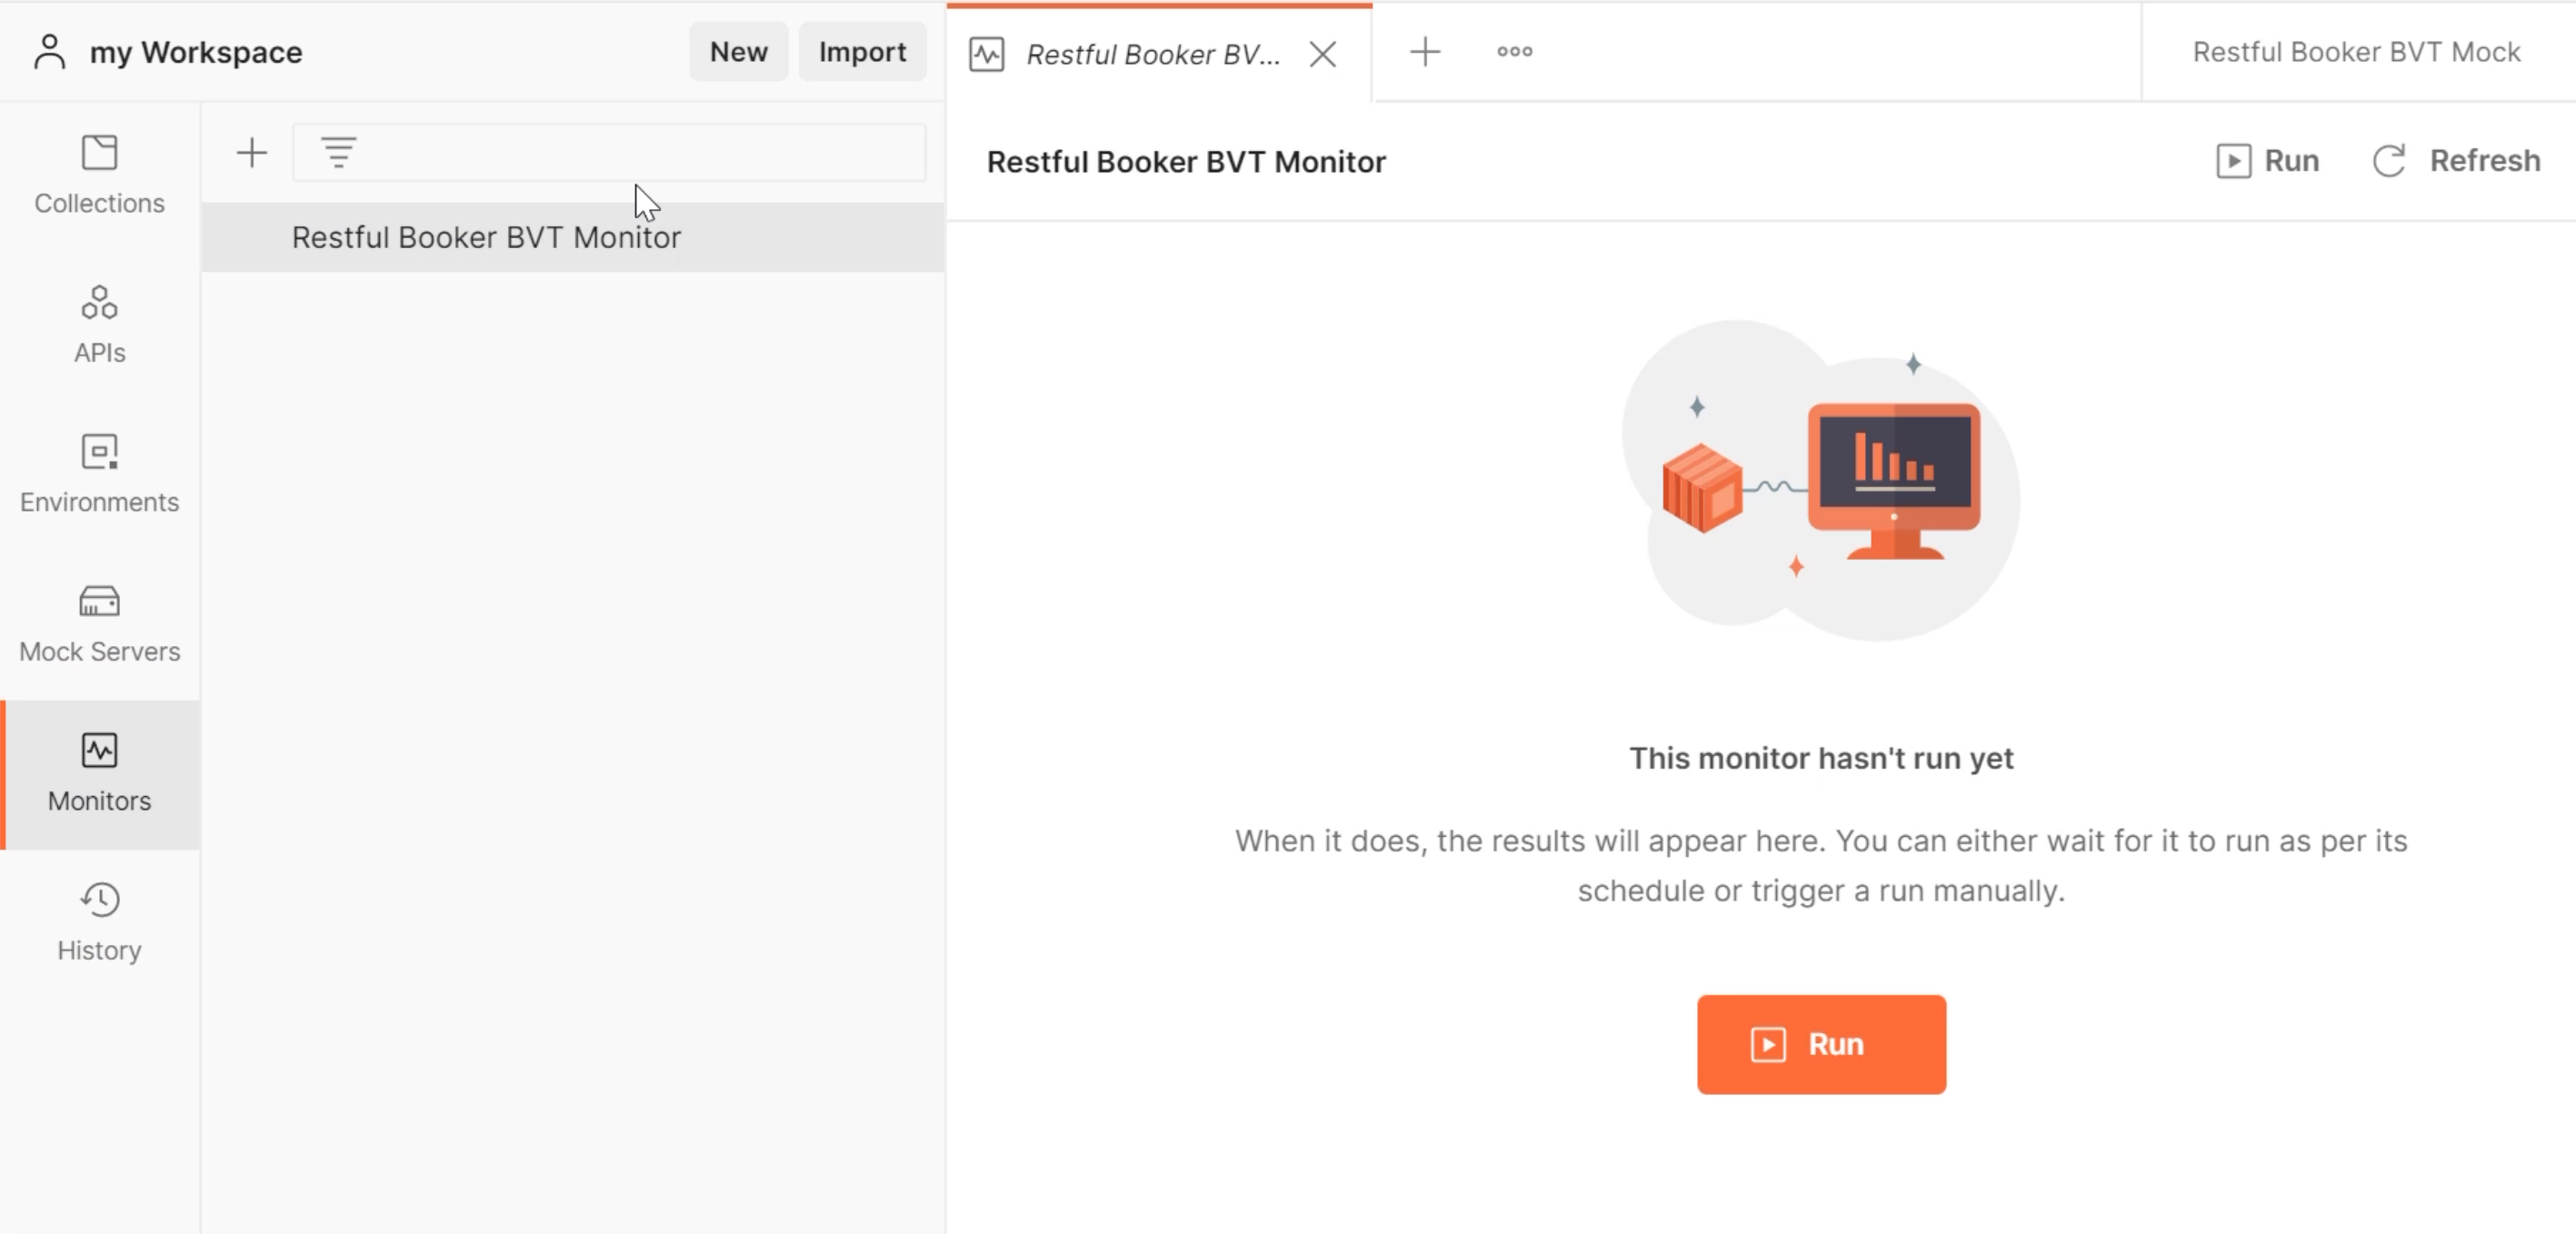
# Configure a Monitor
If we were to hit "Run", we would see that it would execute all of our test cases, and as we know for this collection, some of these test cases fail and that would lead to failure of this monitor.
How do we update this collection to say that we only want certain tests to run?
We do that via a feature called setNextRequest().
Postman has a logical order for what sequence it wants to run your tests and endpoints in when it runs the monitor.
The first thing it's going to do is find the first folder, and find the first request and run that.
I'm quite happy that I want that to be run because that's going to be a generic set of tasks with checks.
We can get all the bookings and there are a couple of tests against that, so that's great.
I also want to check the health of the API by running a "Ping" request, again, using the monitor to check that the "Ping" request returns a 201 so that comes back with a successful request.
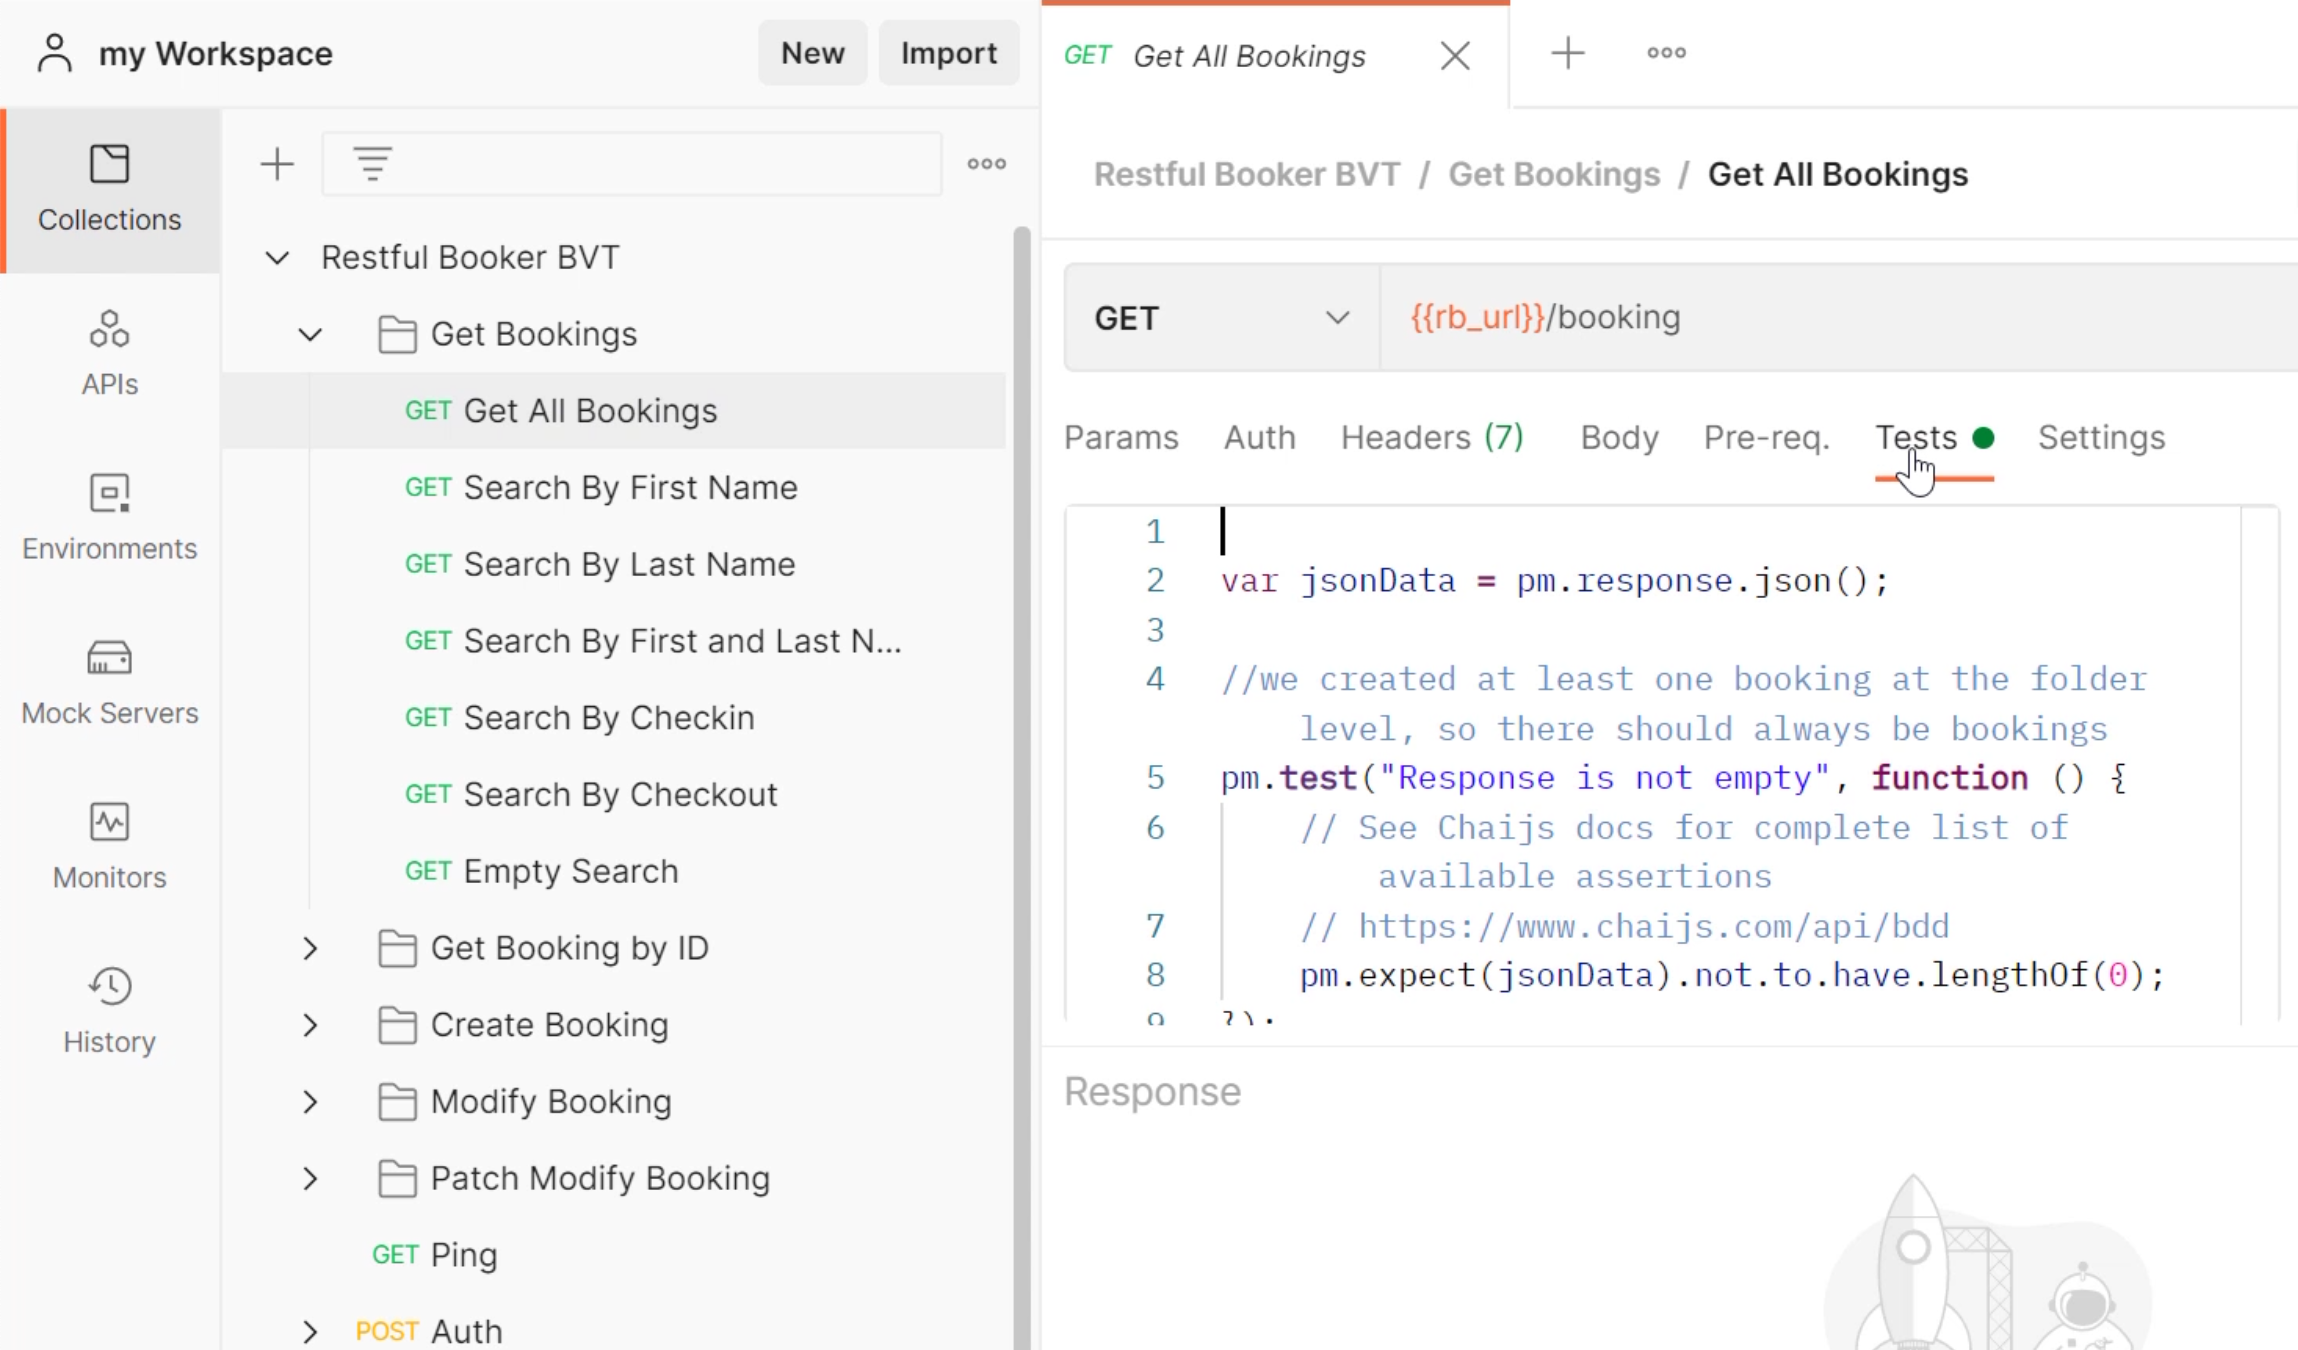
If you open up the "Get All Bookings" request, and you navigate to the "Tests" tab, at the bottom of that, you insert postman.setNextRequest() and this is where you can add in the title of the next test you wish Postman to run.
postman.setNextRequest("Ping");
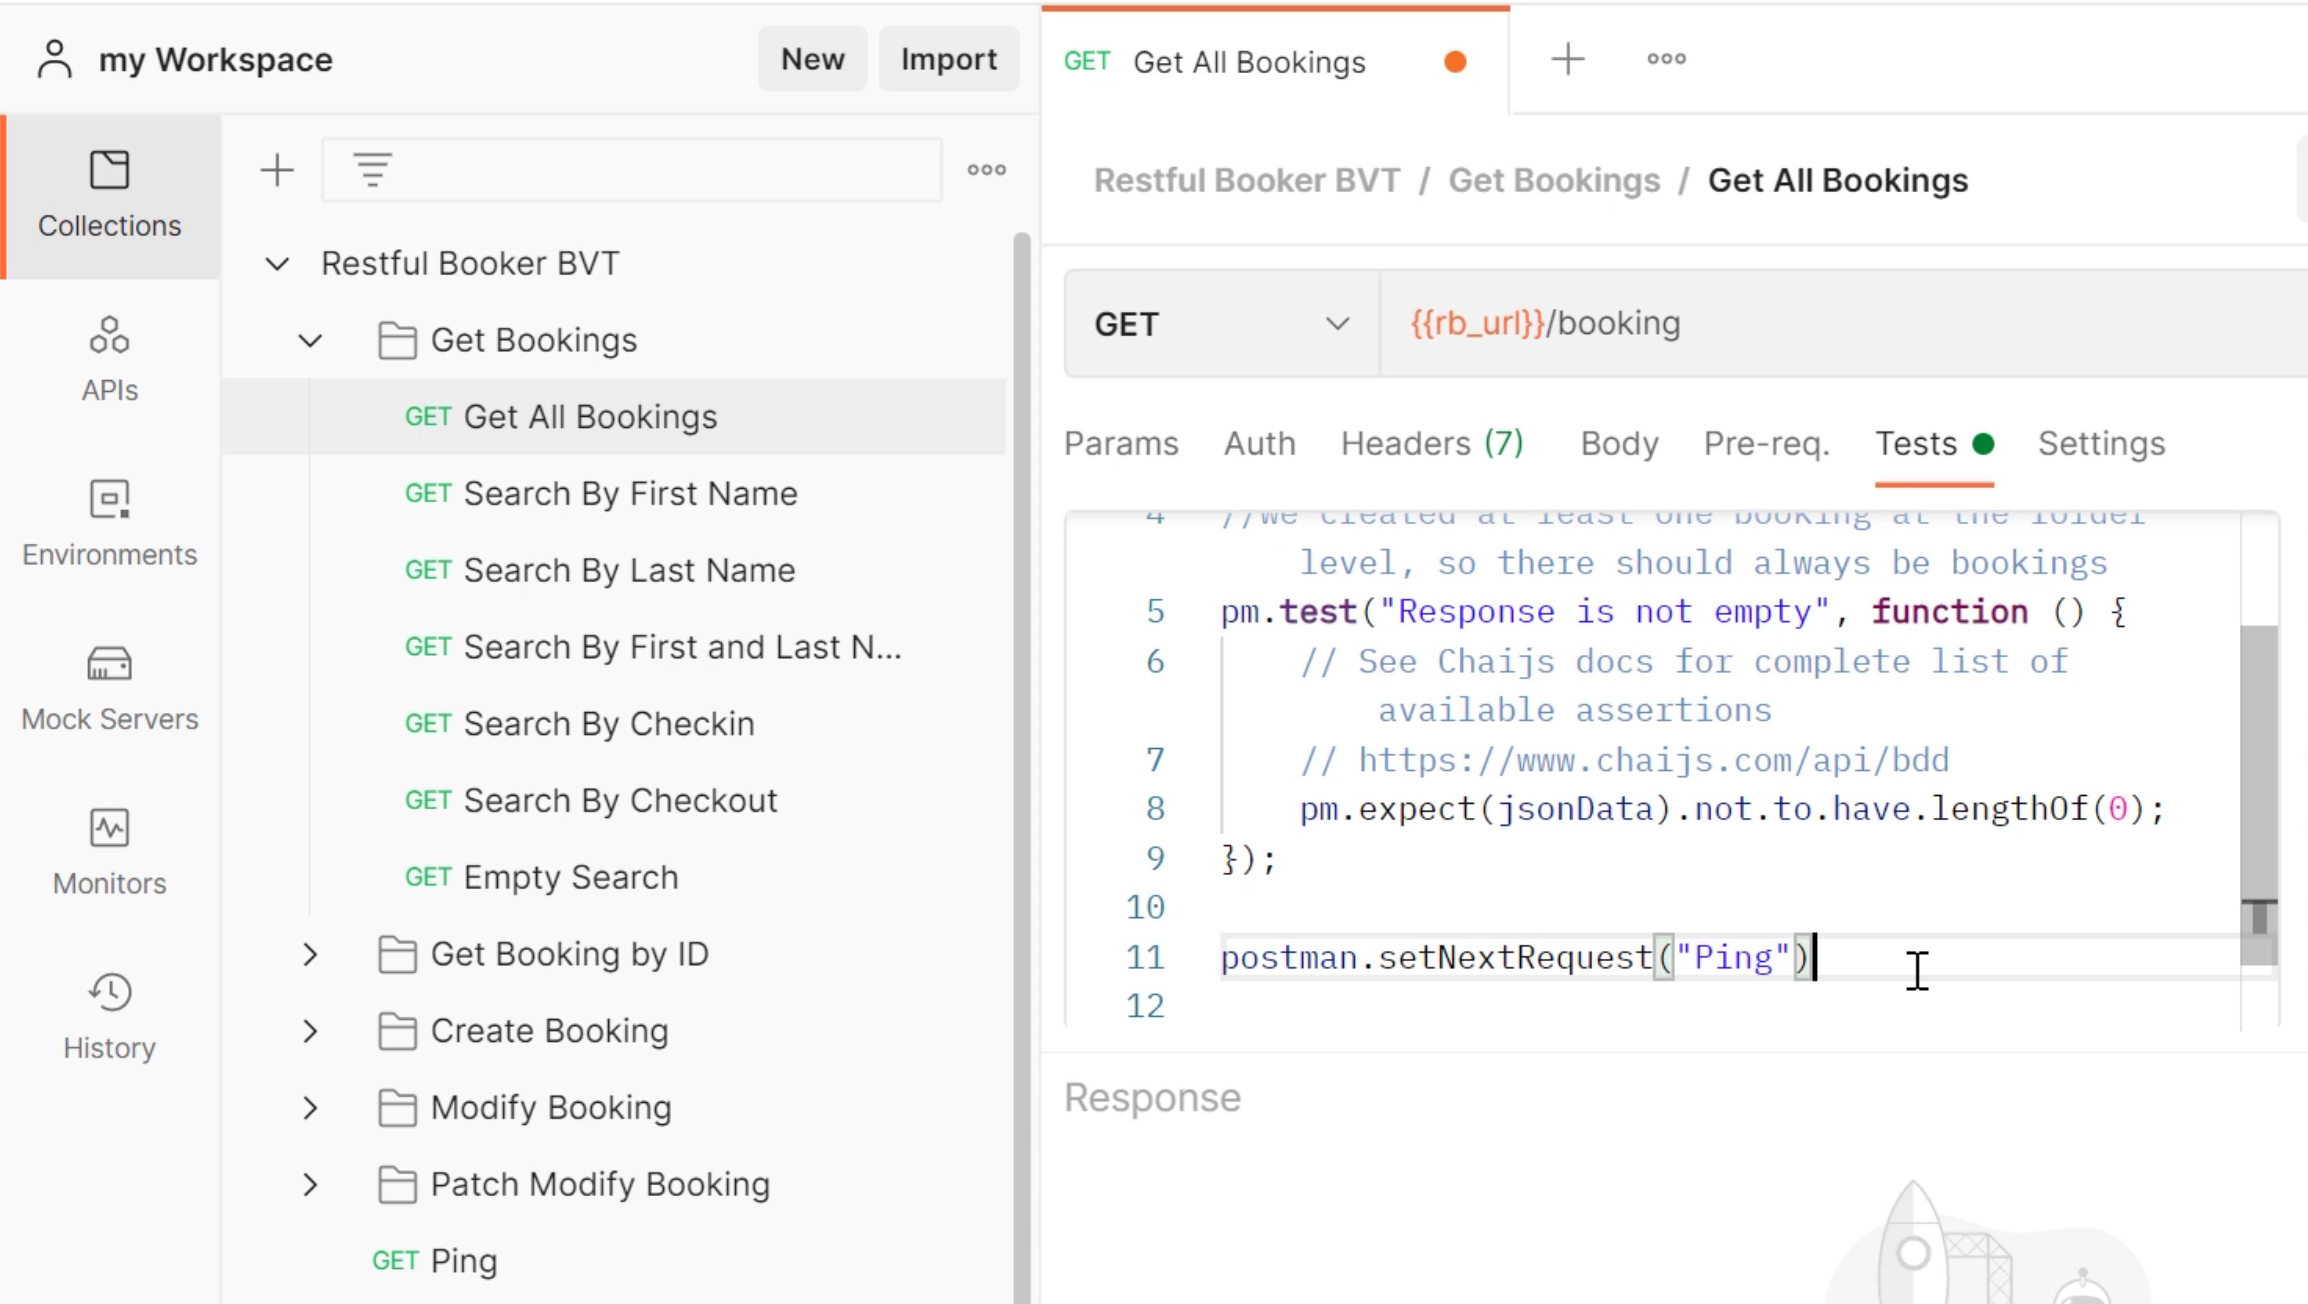
It's going to automatically run this set of tests, and then it's going to use this line to know it can ignore all of these test cases here and we just want it to execute this one.
How do we tell Postman that we want to stop the monitor from executing any other test cases?
We do that using the postman.setNextRequest() and enter the value of null.
postman.setNextRequest(null);
This tells us that we want to stop executing the monitor.
Go ahead - it's really important once you've entered this new information to hit "Save", otherwise the monitor won't pick up the setNextRequest() that you've generated, and you will very quickly find that that monthly allowance will be used.
# View Monitor Results
Let's close these down. We're going to go into our monitor, select our monitor, and hit the "Run" button.
We can see here very quickly that it has come back with a healthy notification.
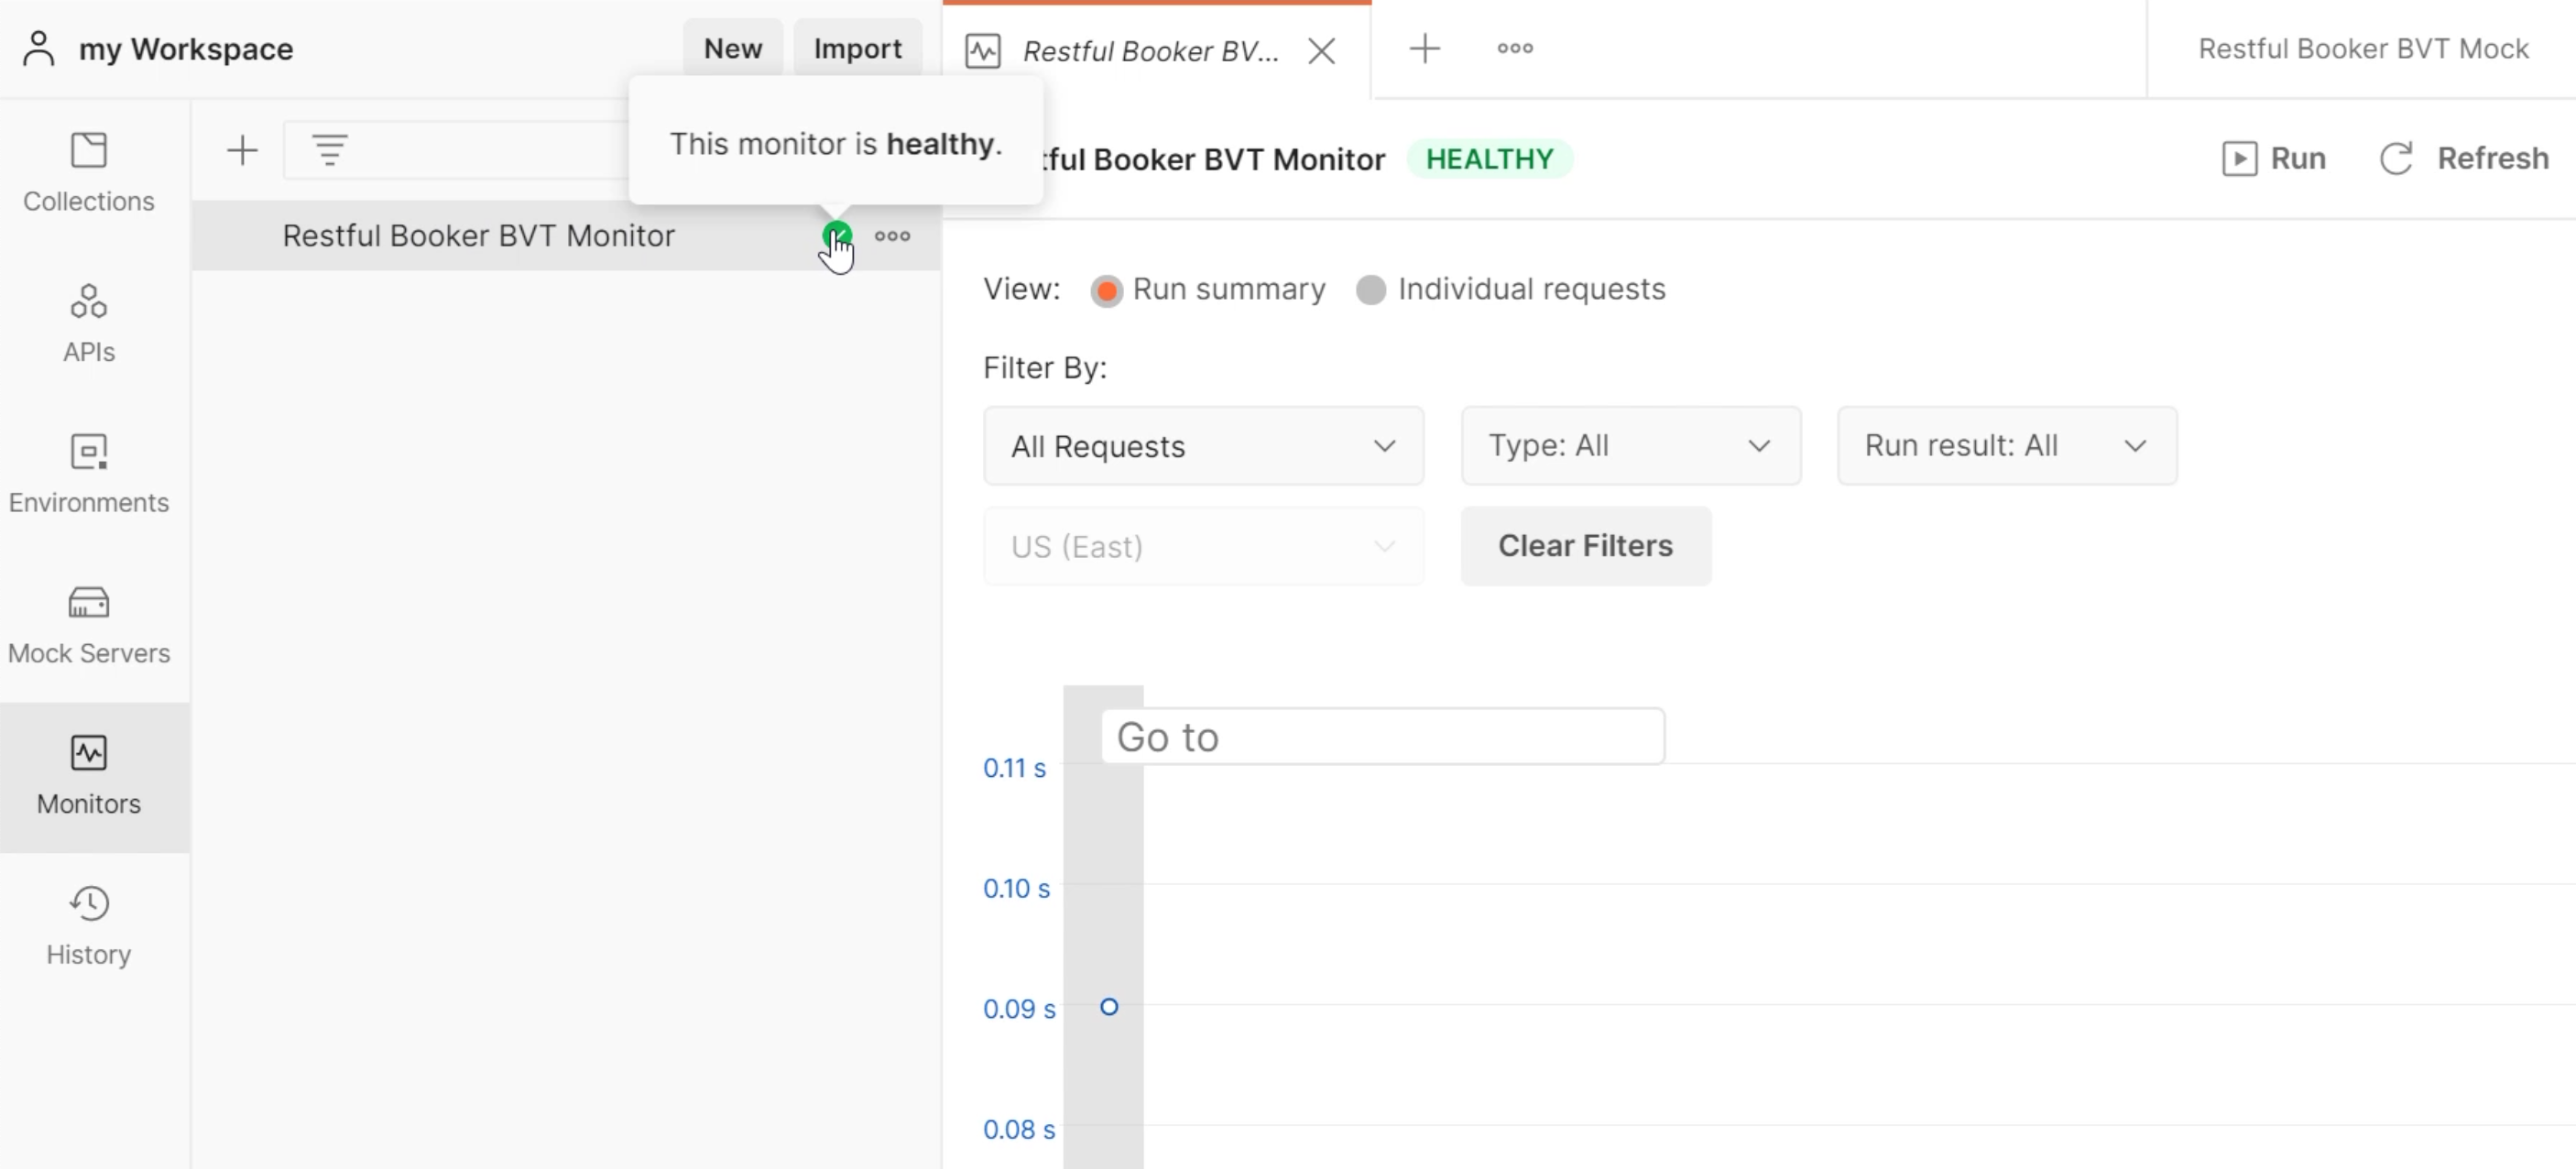
We've got a green tick box against there that indicates that the monitor is healthy.
We can view a summary of all of the requests that we've sent.
If we scroll down, this will tell us what has passed and what time the monitor was executed and the date there.
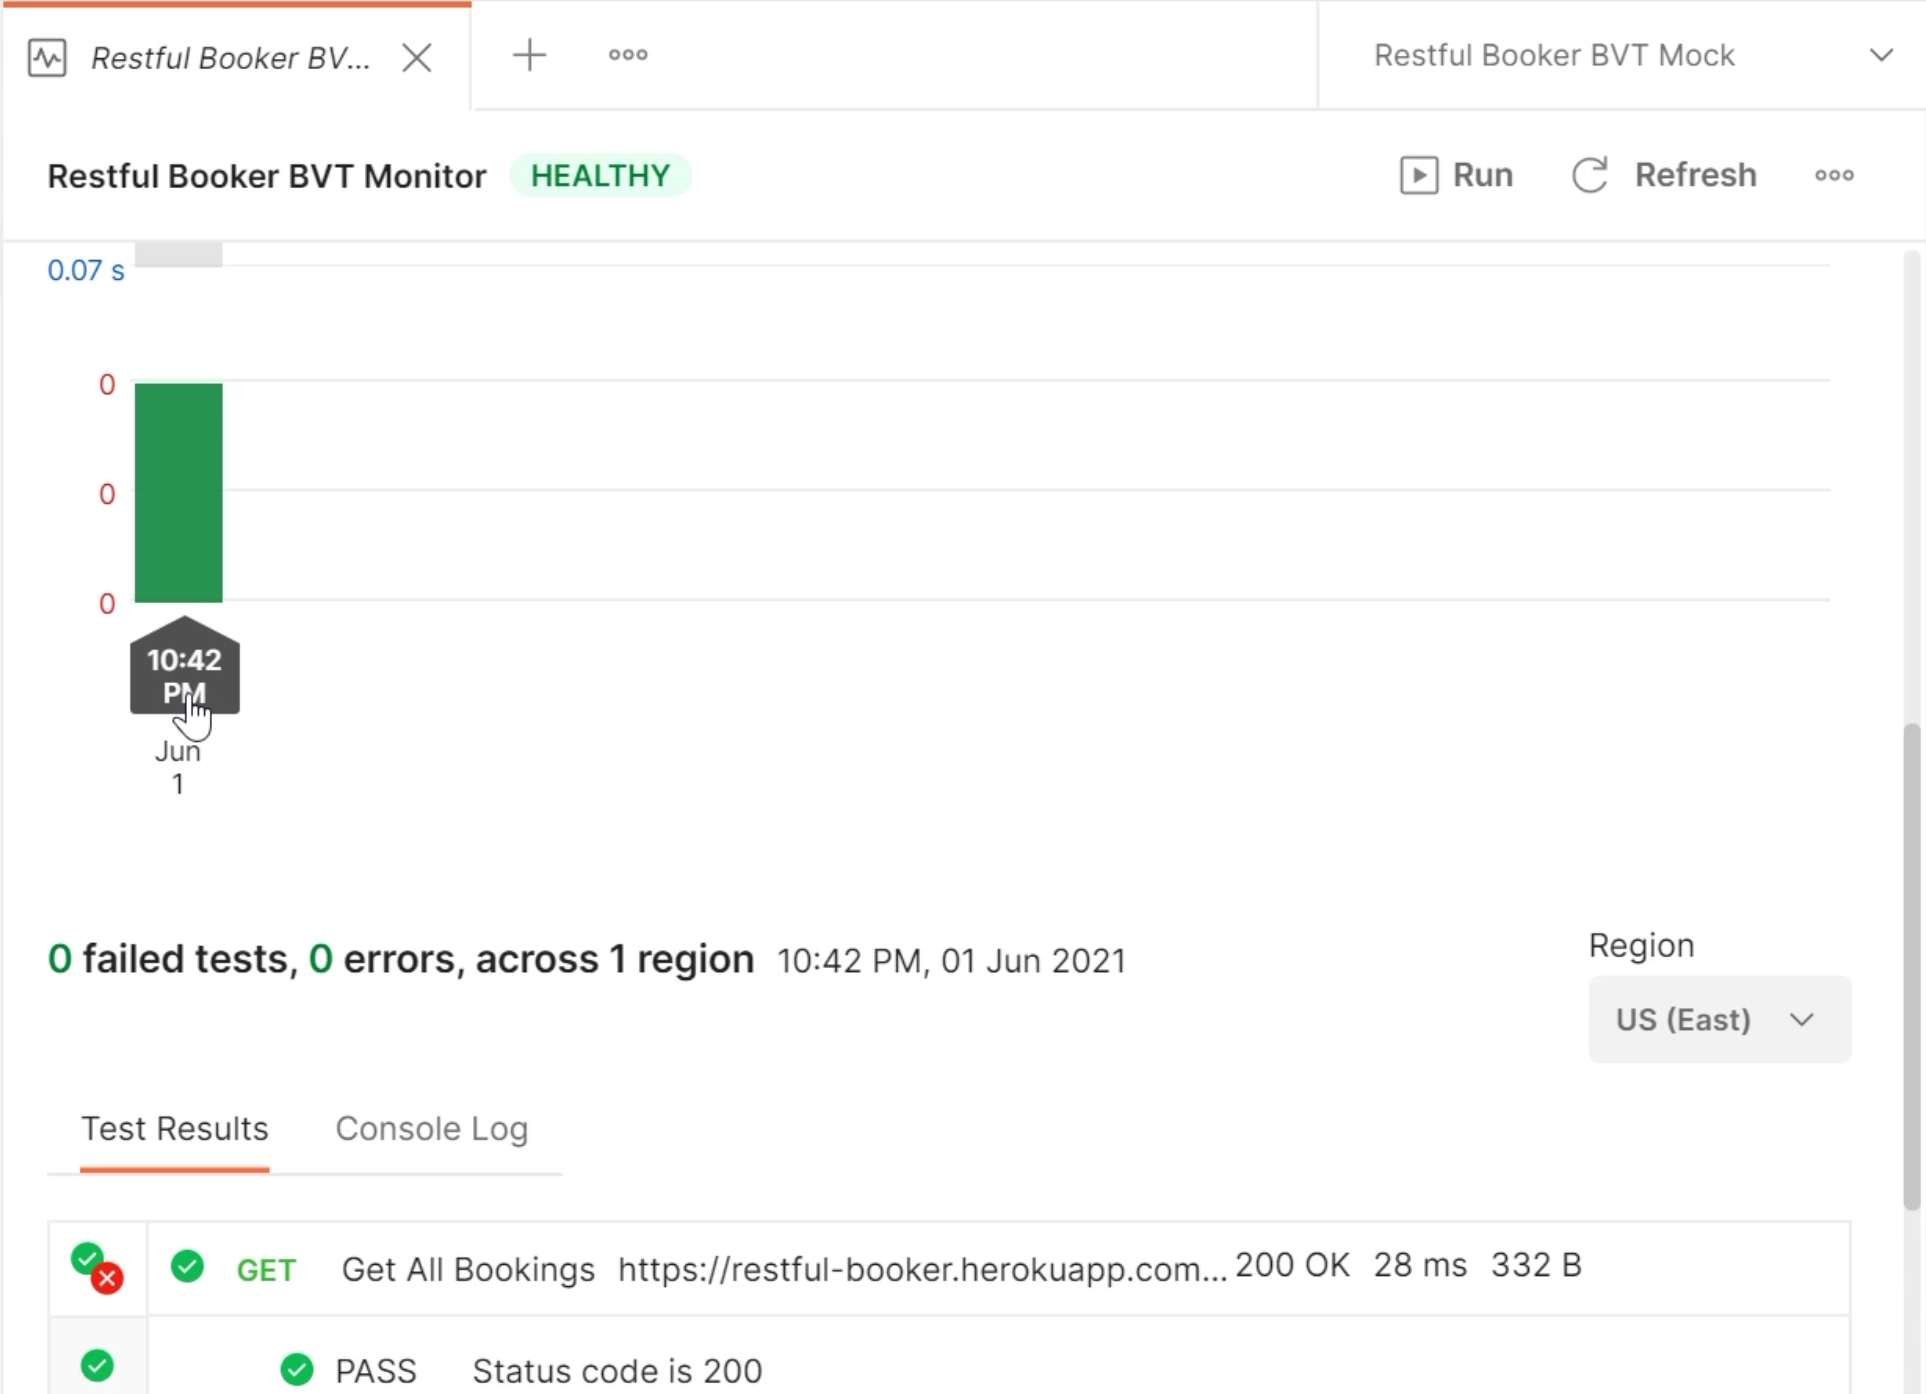
Further down here, we can expand the "Test Results" to see what was executed.
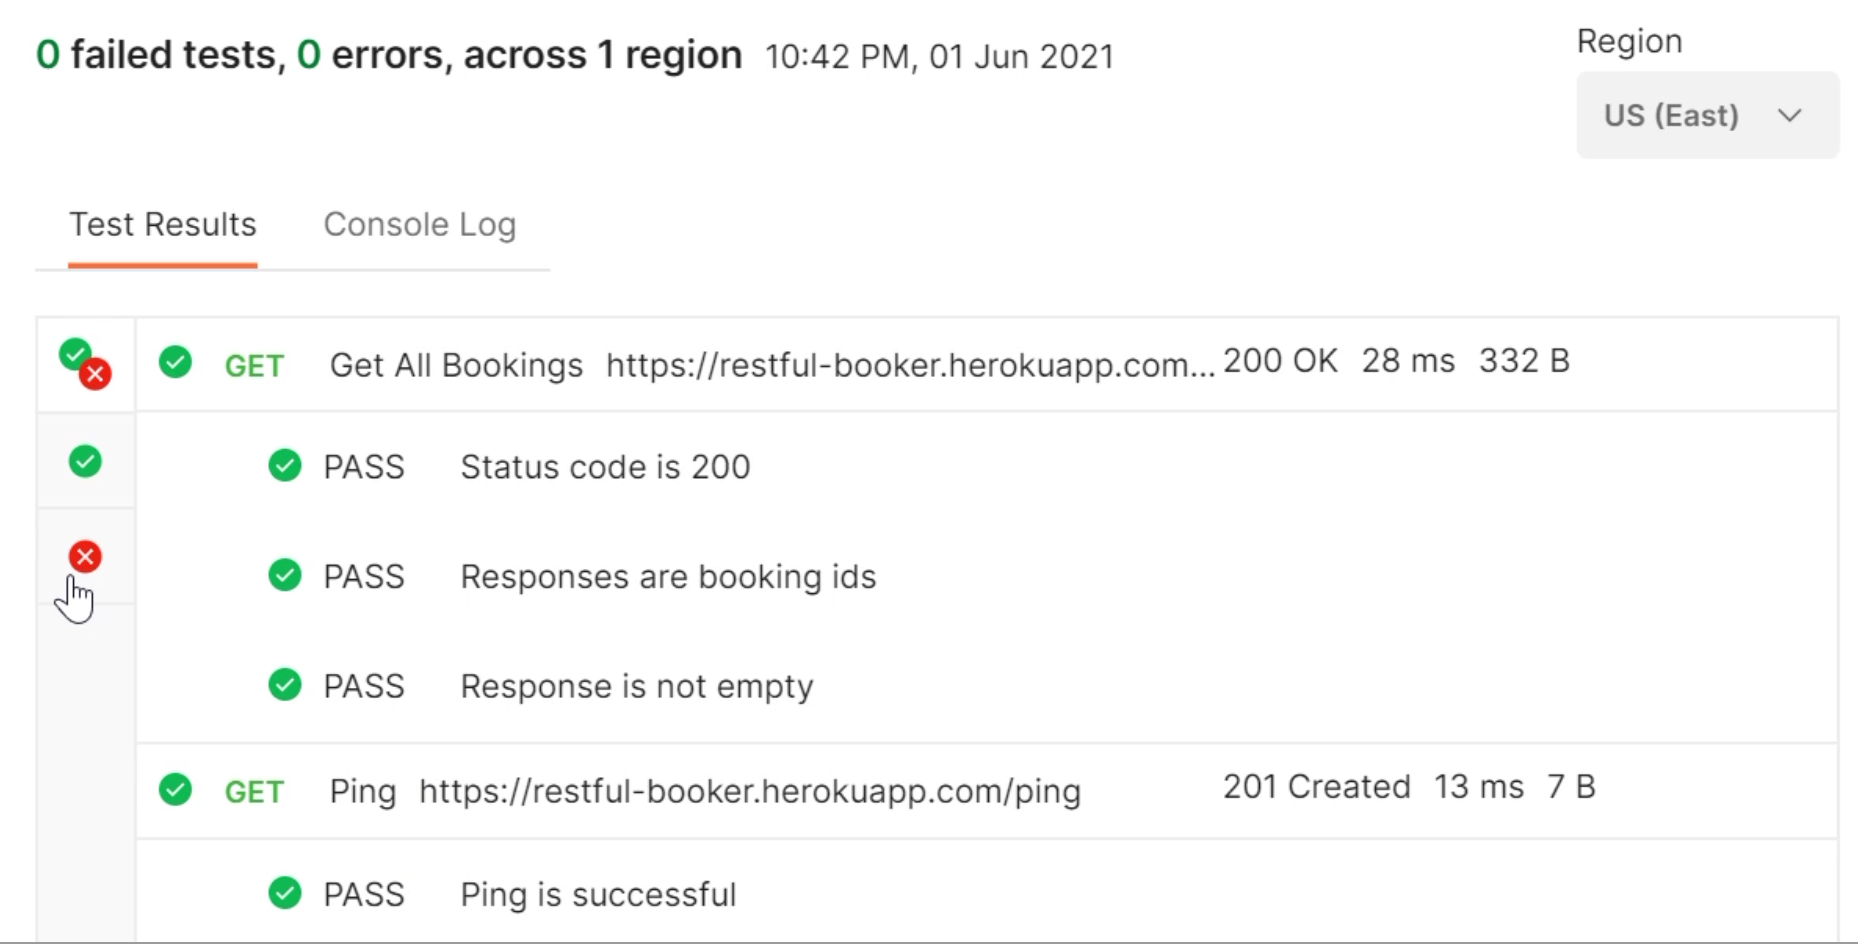
We know that the "Get All Bookings" request was executed and here are the "Test Results".
We can drill down further to see any failures, and we can also check the "Console Log".
If you have done any tests in any other region, you can select that here, and then that will filter the results.
Over time, this will give you a really nice set of charted data that tells you the health and the performance of your monitors.
If you want to drill them down by requests, you can.
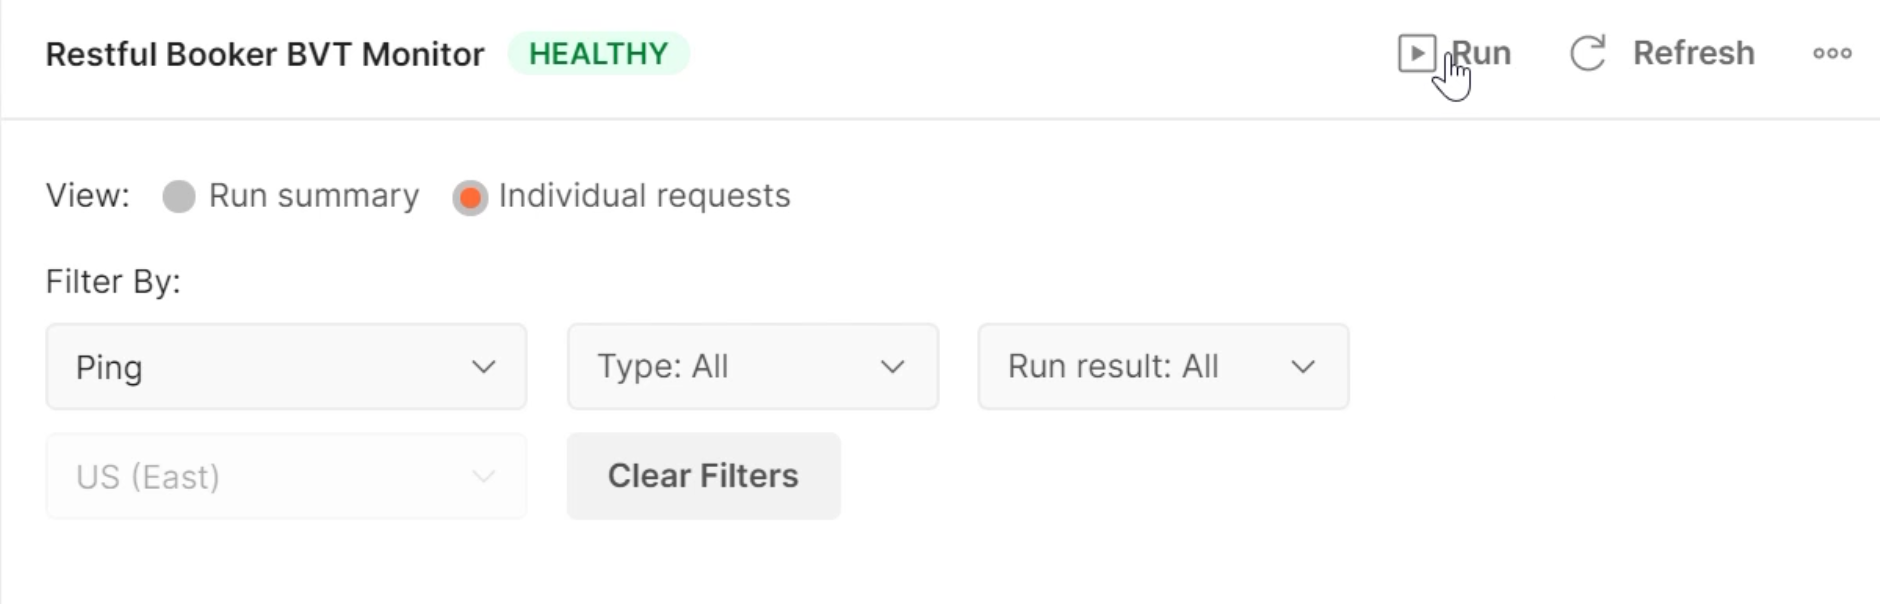
You can just say - for this I just care about the "Ping" requests and I want to check how long that has taken to execute.
You can do it by "Run result", or even the "Type" of run that you've executed.
Here is our monitor.
Again, if you want to rerun that, click the "Run" button here.
That's great. That will run on the schedule that we've set up.
# Delete A Monitor
I can go into the ellipsis menu within the monitor and click "Edit", or if you don't want it to run for a certain time period, just hit "Pause" and then restart it when you wish to.
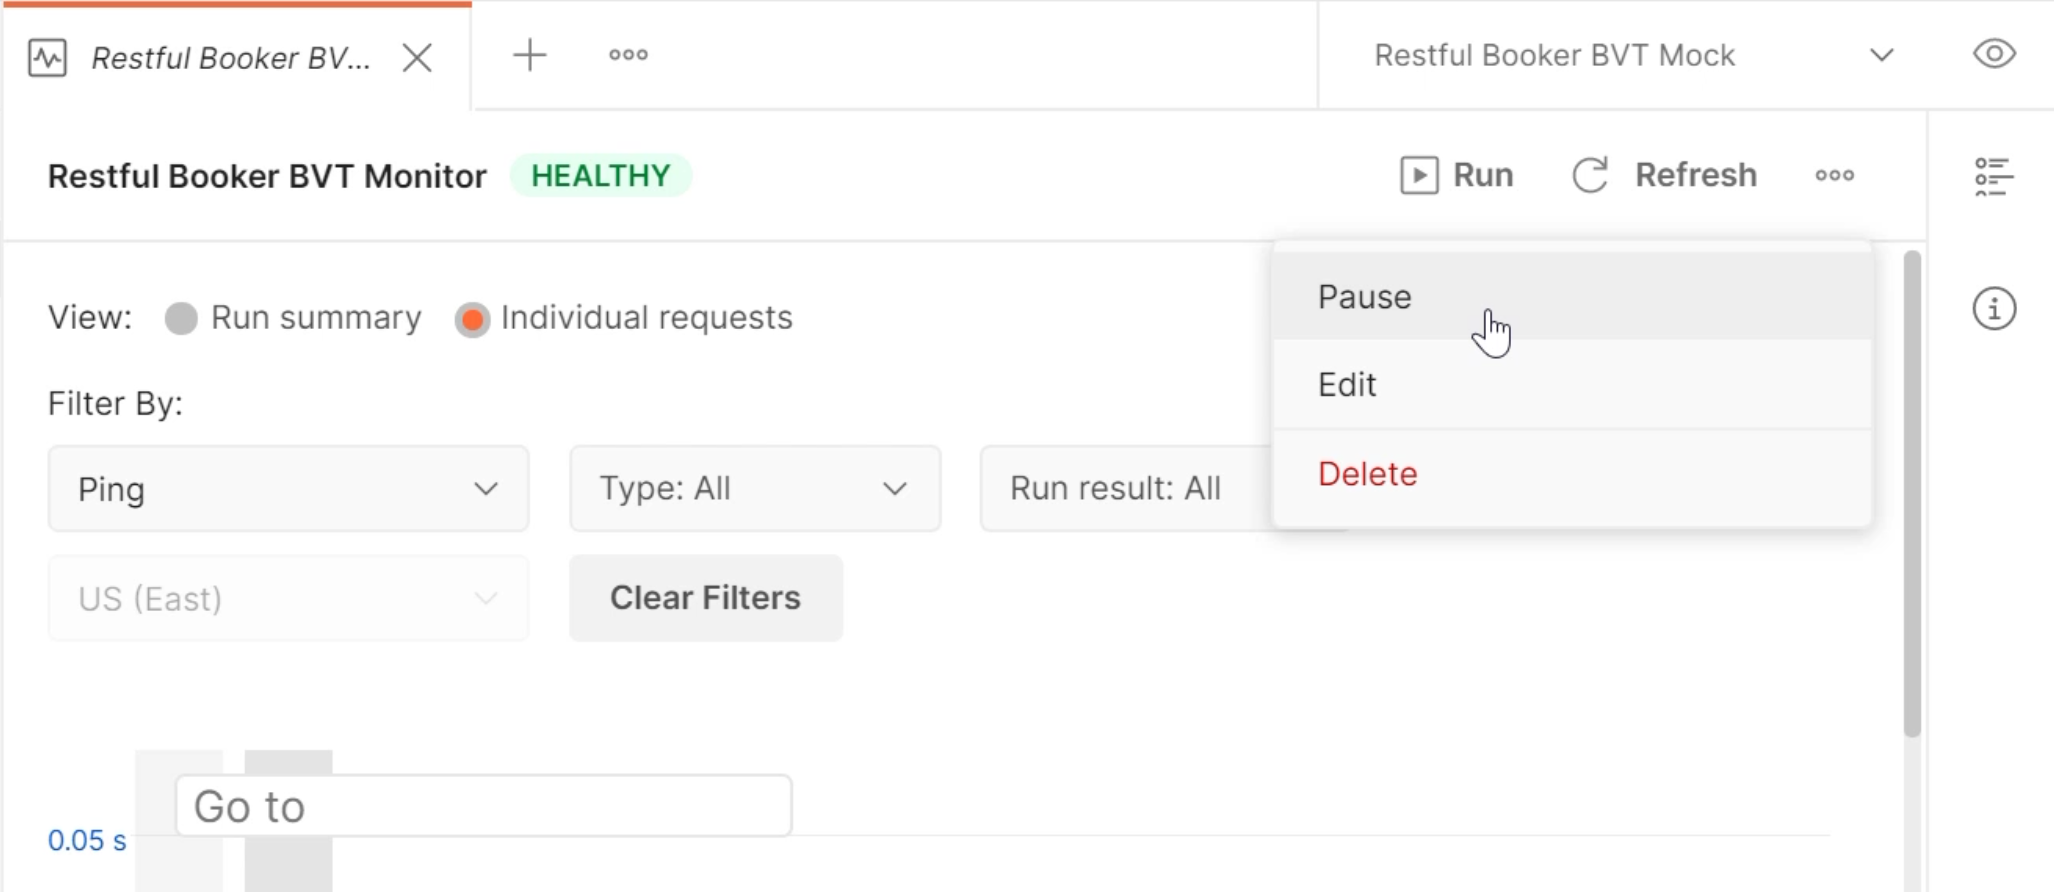
However, we've decided that we no longer need this monitor.
It's not valuable any more, so we're going to go to the ellipsis menu and hit "Delete".
"Are you sure you want to delete Restful Booker BVT Monitor?"
If you "Delete", that will be removed.
That is how we use monitors.
