

Transcripted Summary
In this chapter we're going to go over how to analyze our test results via the Applitools Test Manager. The Test Manager is a dashboard, a UI where we have control over all of the reporting of our tests and whether they passed or failed. We can also make other alterations to our baseline images.
Let’s go through the functionality of the Applitools Dashboard, starting at the top.
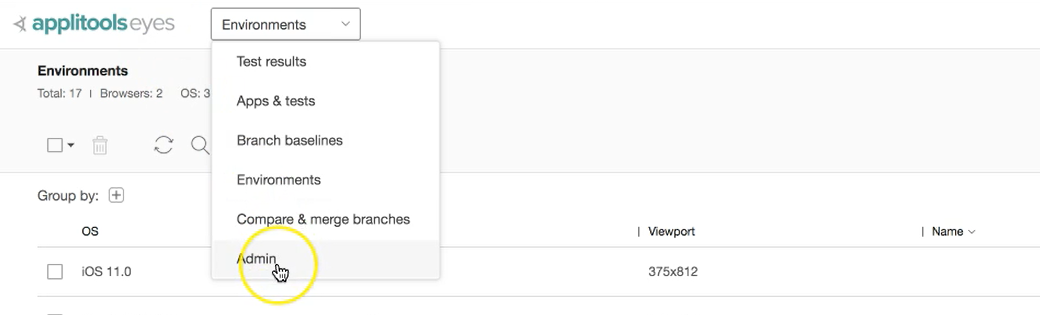
By default, the view is of our test results, but you can change this to view lots of different things. From the pull-down menu, you can access:
- Test results
- Apps & tests
- Branch baselines
- Environments
- Compare and merge branches
- Admin
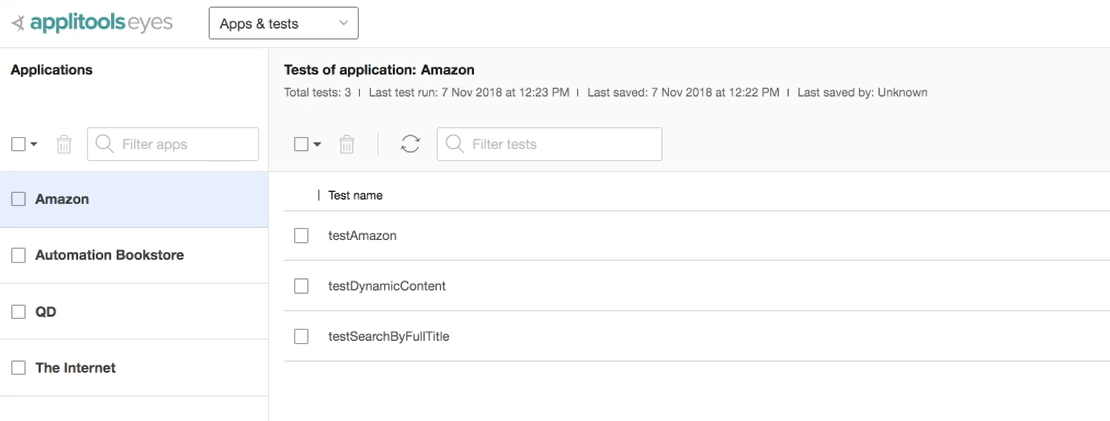
# Apps & Tests
Here are the different apps that I have worked with and under each one you can see a list of all the tests.
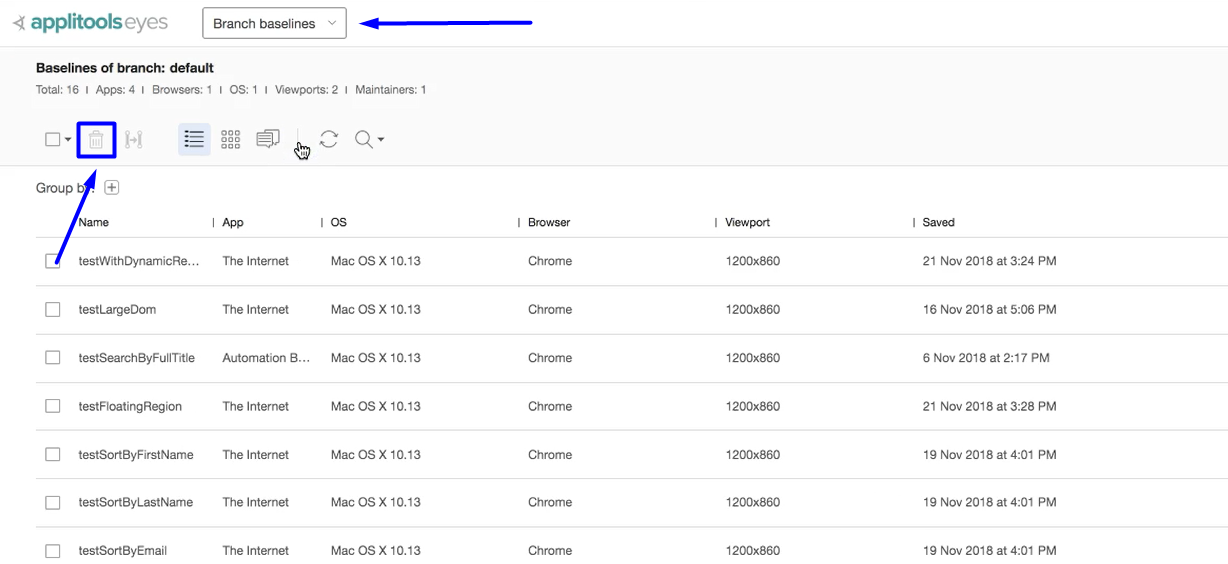
# Branch Baseliines
You can view your current baselines for all of your tests.
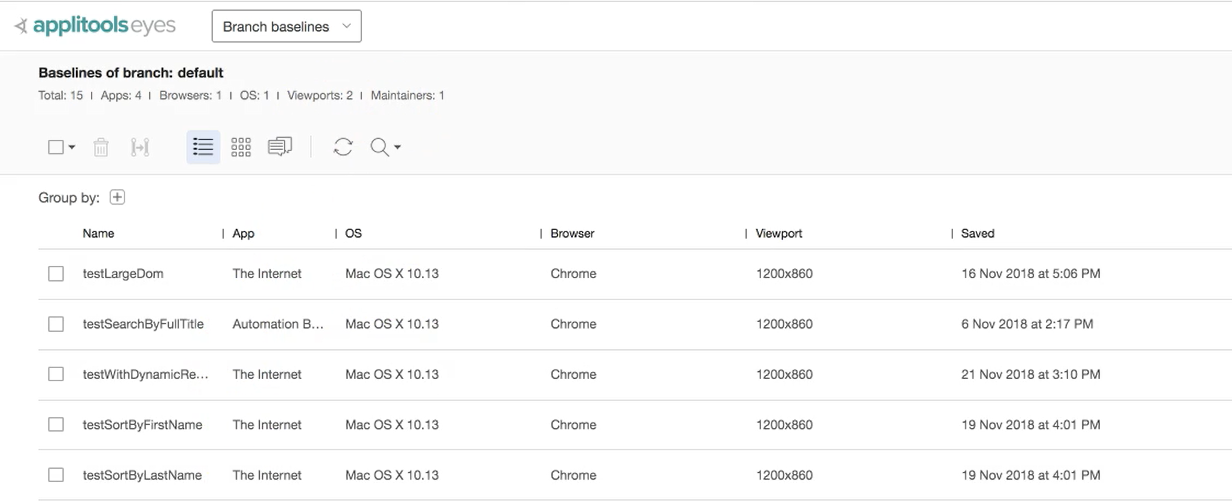
We can delete any of these baselines by using the trash can icon.
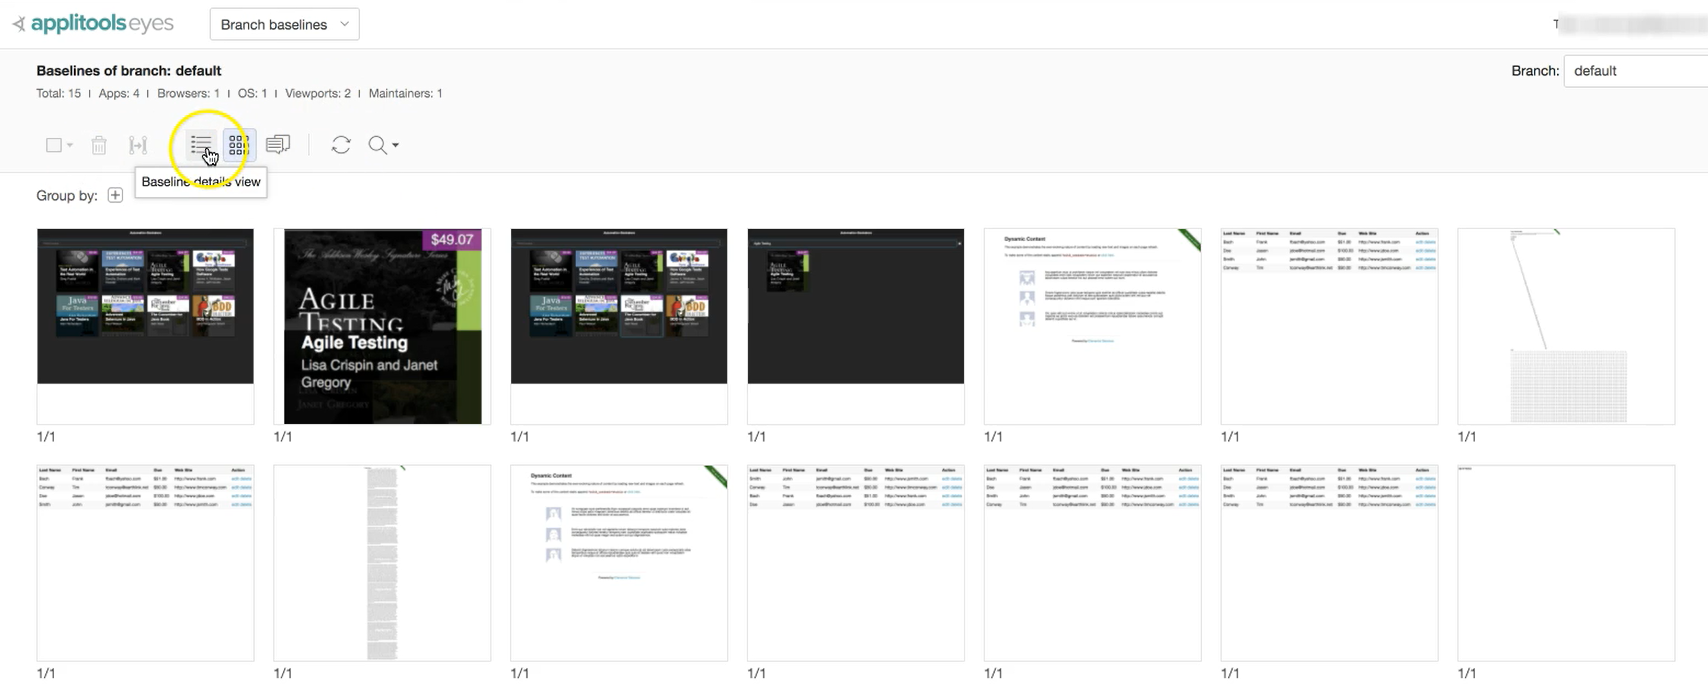
We can also look at our tests in different views besides list—by-details or by grid, for example:
# Other Views
We can also see environments, compare merge branches and access the admin panel (where we can create more teams and assign users to the team).
# Overview of Test Results Options
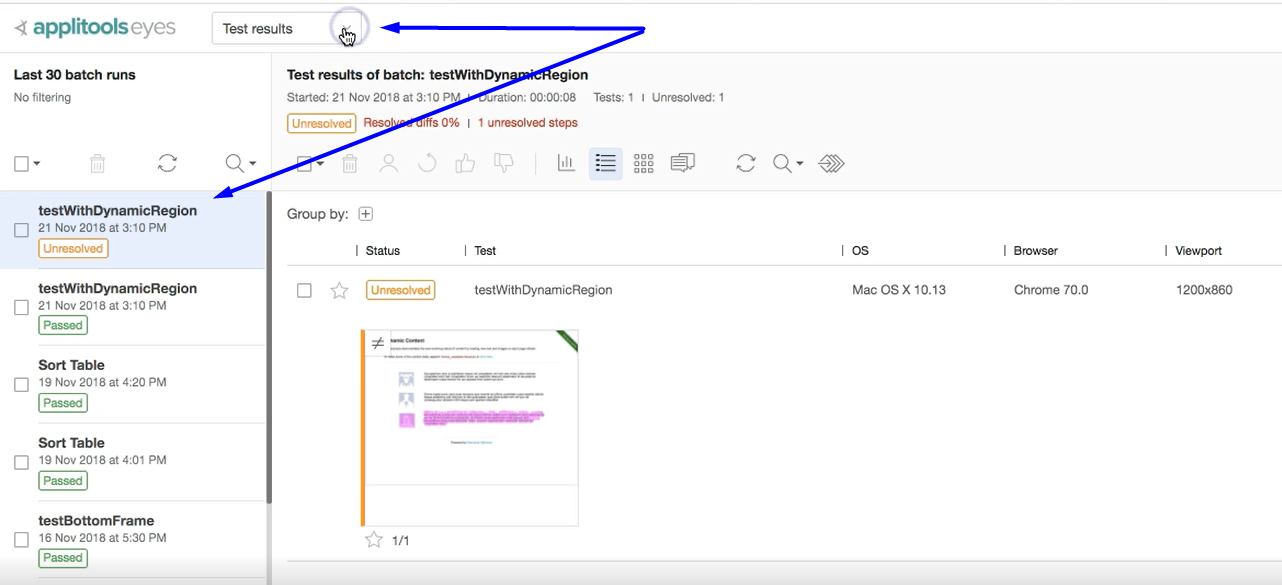
Let’s take a closer look at the options available in the Test Results option (selected from the top pull-down menu).
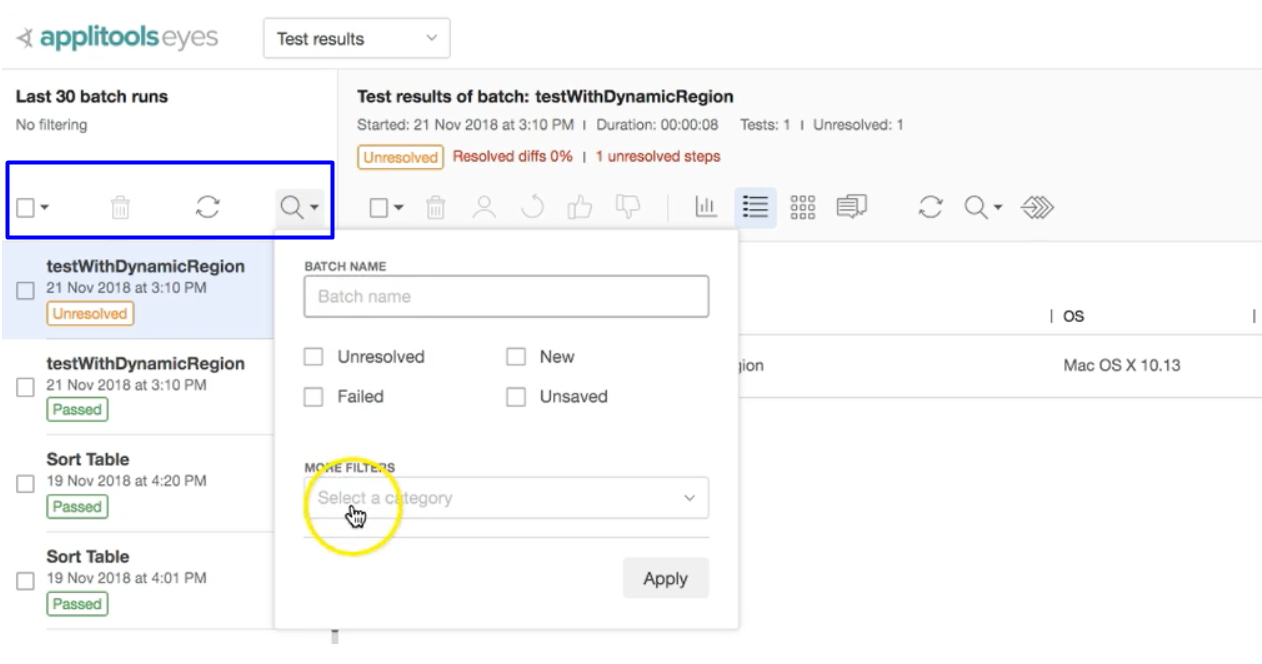
In the first column of our test results, we have several icons which give us different options:
- You can do a “Select All” by checking the box and then take action. For example, if I want to clear the whole thing, you can Select All and Delete using the trash can.
- You can refresh if there's new tests that have been run since the last time the page loaded.
- You can search by different batch names or by status.
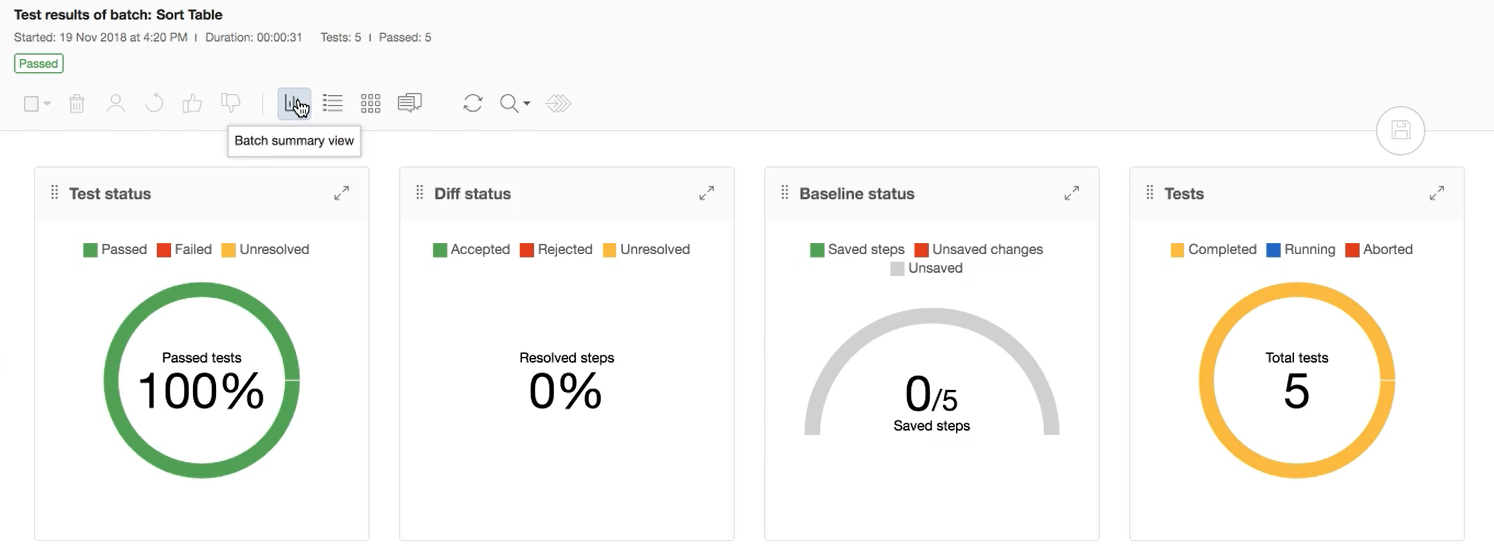
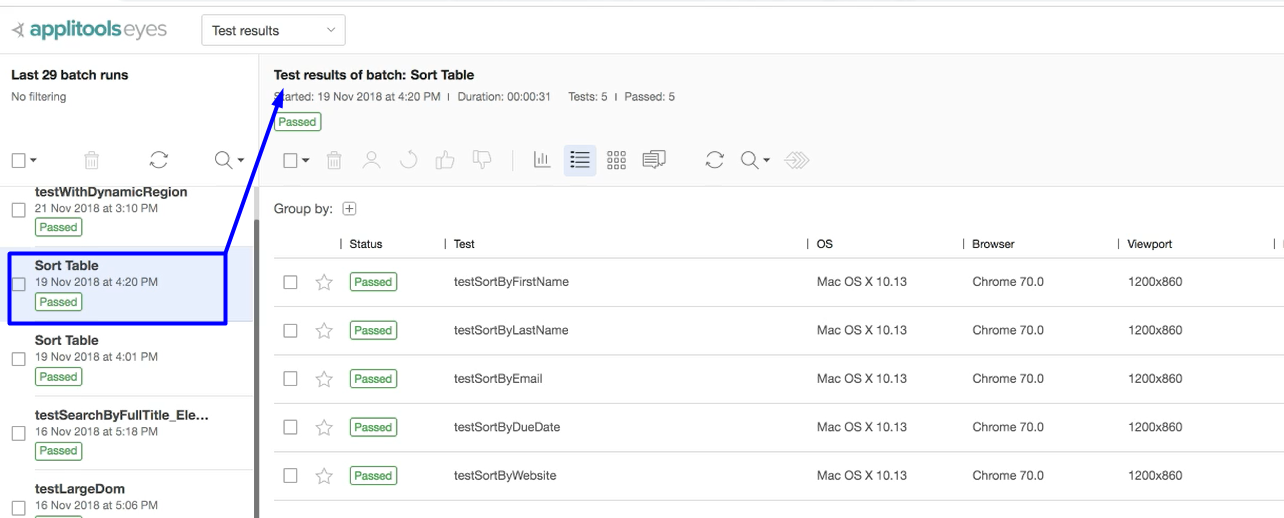
Clicking on any one of the tests listed in the left column will show us more information about the tests that were run. Let's look at one which had a batch of tests - the Sort Table batch:
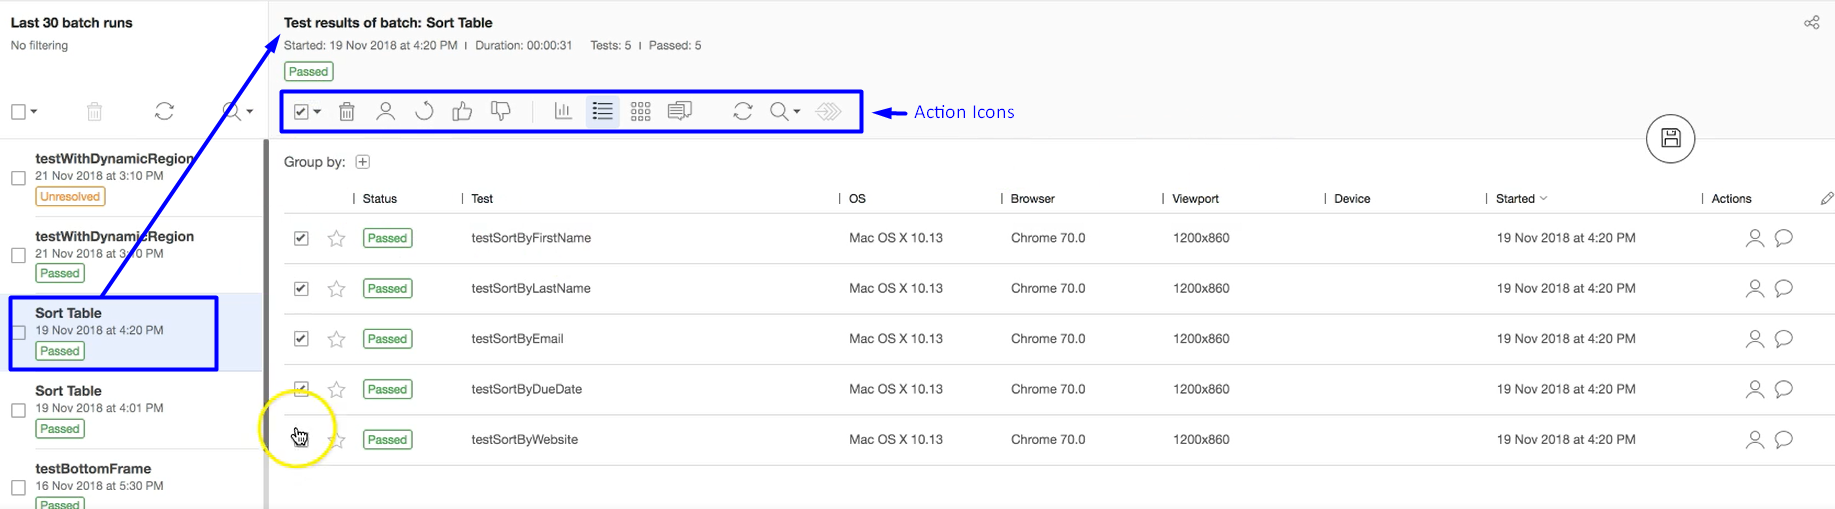
At the top of the results column, we see the various options.
We still have access to the Select All or Select None check box (as well as the ability to select individual tests from the list). Based upon what is selected, we can do things such as:
- Delete the selected items
- Assign selected items to people for review
- Accept or fail a test
Note:
In previous chapters we looked at how you might accept or reject changes within a particular test, but you can do this for multiple tests at the same time. For example, I could “Select All” and “Accept All” of the changes that have been made within these tests. That saves you time from going through each one if it's a common change amongst them all.
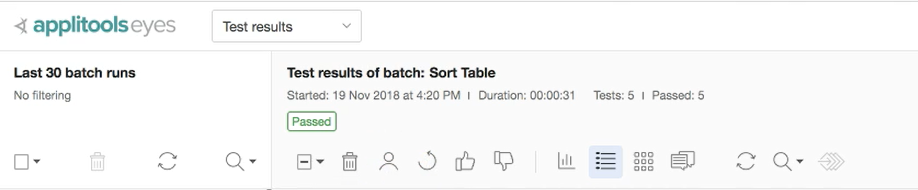
We also have the ability to see the results in different views:
- By list
- By summary
- By steps
Other things you can do include:
- Make comments on any of the tests
- View issues in Remarks and Comments
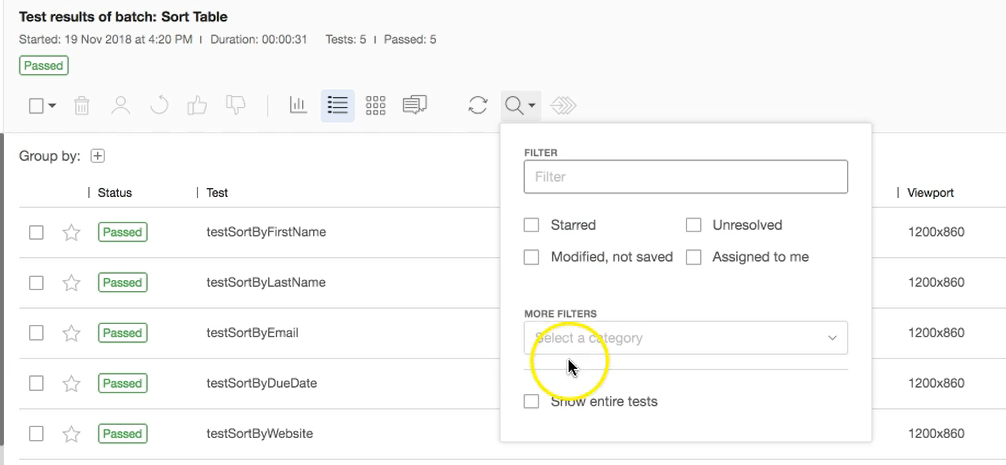
- Refresh the entire list
- Filter search results
# Functionality Options Within a Test
Let’s look inside of a test. For this example, I am going to use a test that’s broken. Once the test is opened, I have more options available.
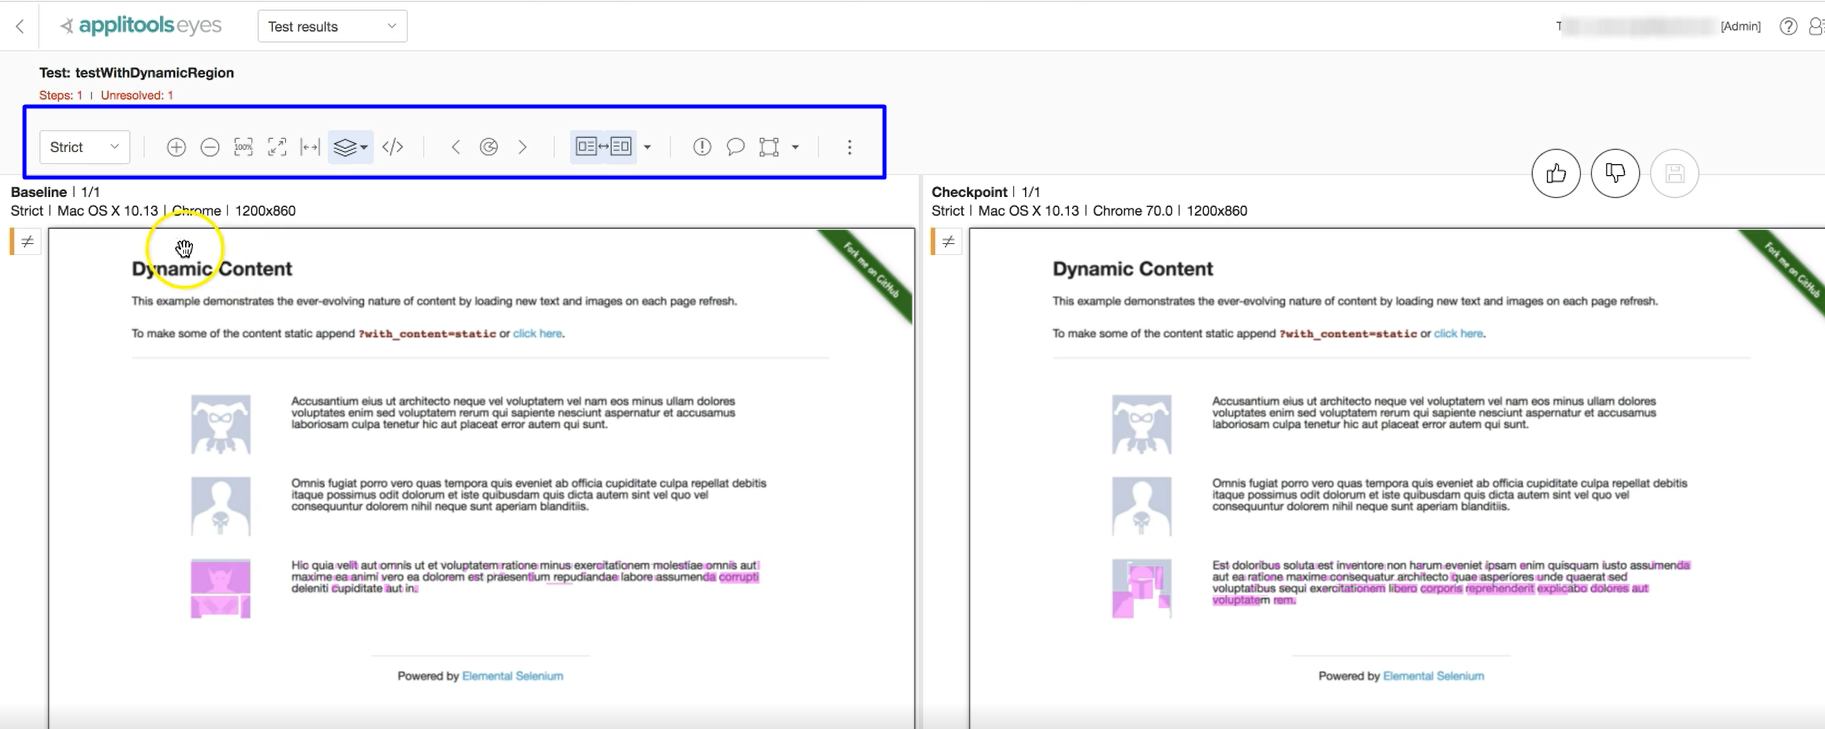
Using the different icons at the top, we can:
- Resize back to original size
- View full screen with both width and height
- Select various layers that are available
- Look at Root Cause Analysis
I also can zoom and highlight on all of the differences.
# Commenting on Results
One example of when you may want to only see the checkpoint would be if you wanted to make a comment.
To do this, you click on the remark icon and then highlight or select any section within this app and make a comment.
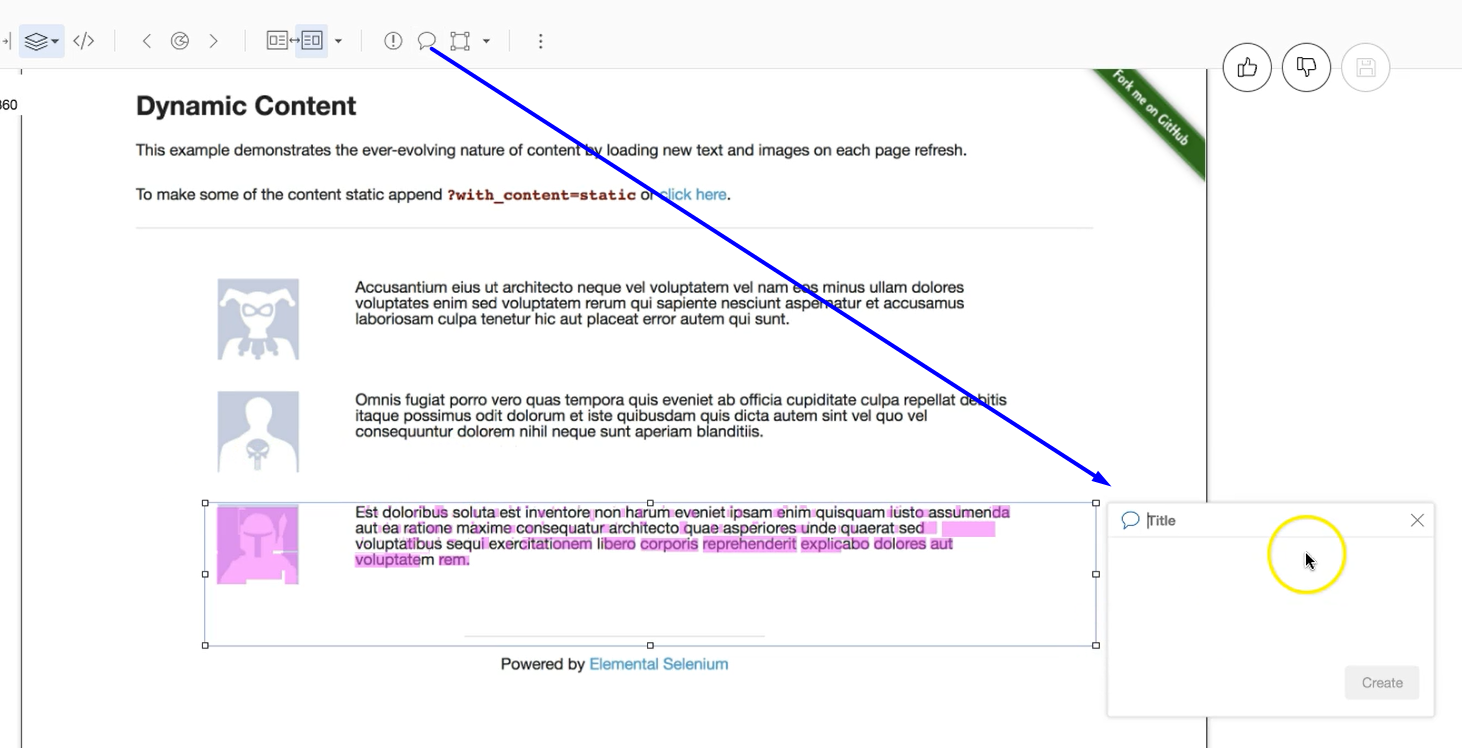
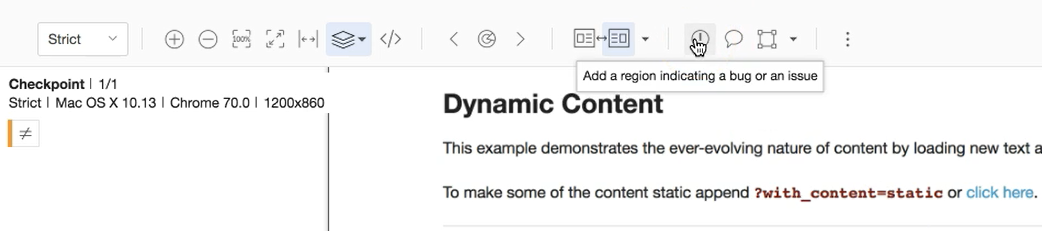
I can also add a region indicating there is a bug, and add a specific "bug" comment for that.
Clicking on the exclamation point icon and highlighting the area will then make a box come up for comments, but with this one you see with the indicator that it’s is a bug.
# Working with Regions
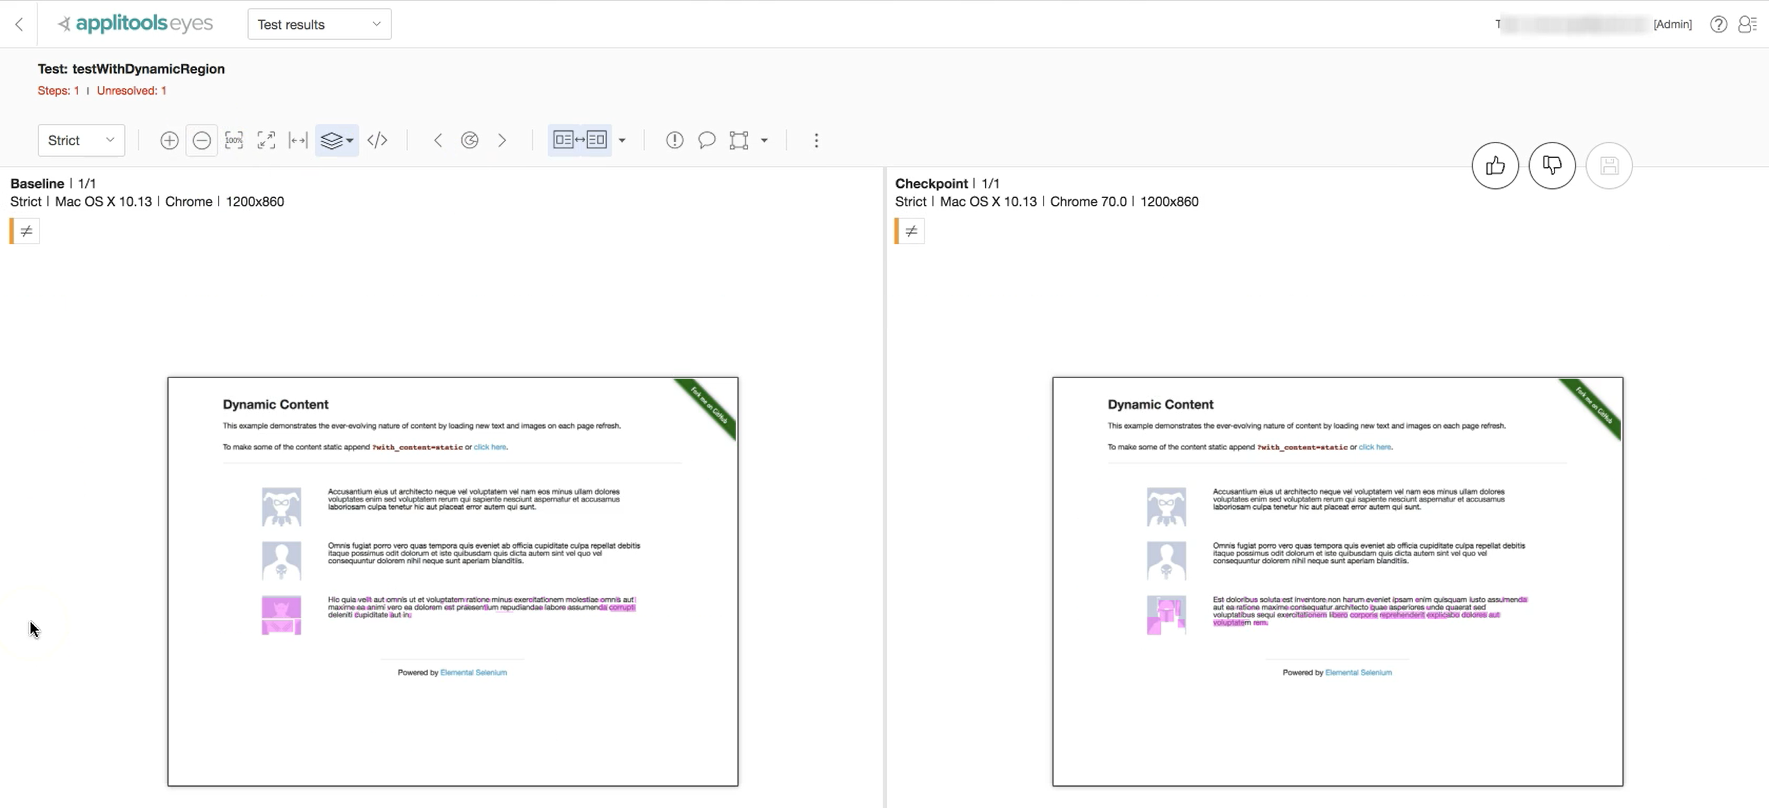
You can do other things with regions as well. Before I show you, let me give some context. Recall in Chapter 4 we viewed a website with dynamic content: https://the-internet.herokuapp.com/dynamic_content
On this page, the upper two areas are static and middle area one is dynamic, meaning every time the page loads, the section changes.
Notice the page is dynamic, so every time we load, the middle section will be different.
In Chapter 4 we ran tests on this content. From the results, we can see the areas that are the same, and the ones that are different.
Because we know that the website is set up with dynamic content, we can make provisions.
I could essentially say that this is a region that should be ignored, or as we talked previously about the different match levels, this could be a Layout match level.
I can use regions to handle this.
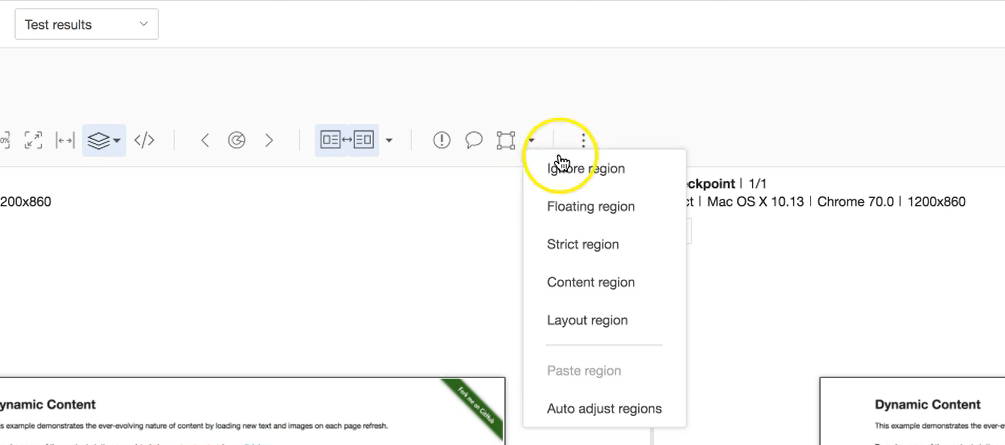
I can use Ignore Region and highlight the area that I want ignored and then save this test. If I do this, when I run this test again then this region will not be compared in the screenshots. Therefore, the test will pass.
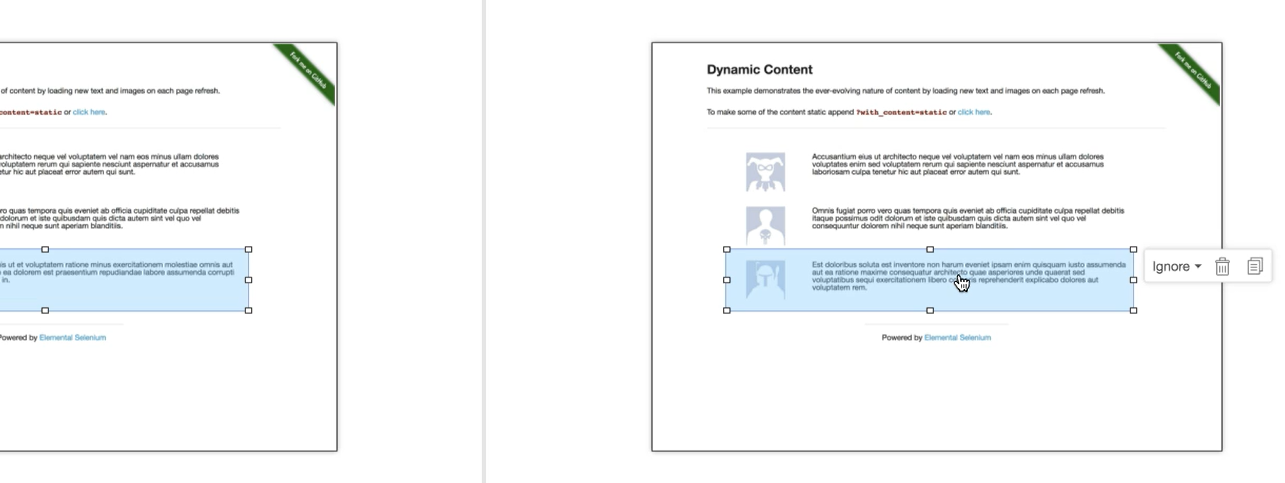
Let's look at other options. I might want to say that this is a Layout Region, meaning I want some verification of this region but don't look for it to be the same.
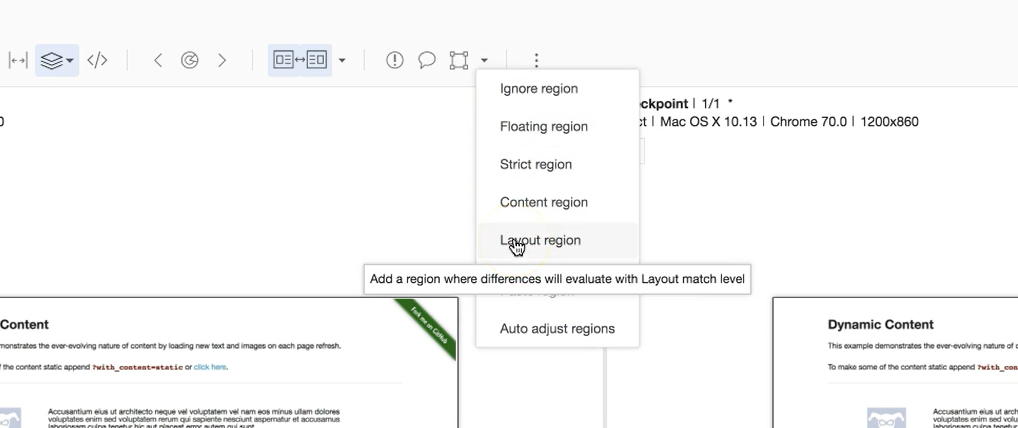
I only want to make sure that there's an image there followed by a paragraph...just the layout of the page. I can do that by just selecting the region of the page that I want to be a layout.
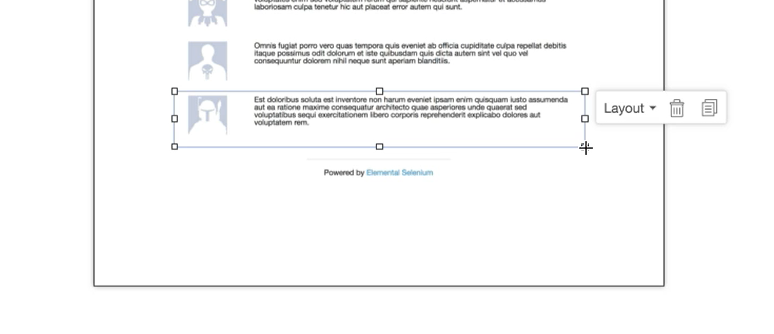
Notice, when I set the Layout region, all of the pink indications of errors went away. It changed it right then and there to show me what using that algorithm would look like.
Because I've indicated that I want this to be compared at the Layout level, I can then accept these differences using the "thumbs up" icon and save it. For future runs, that region of the screenshot should be compared using the Layout mode.
Now, let’s assume that there was an actual error, and something changed, we could specify this is a failure. In this case, we would reject the difference, using the "thumbs down" icon, and save. The test will then be marked as failed.
# Root Cause Analysis
When a test fails, we can visually see the difference, but we still need to figure out where the changes are in the code. However, when we use the Root Cause Analysis Tool [ </> ], we can identify the changes that occurred within the DOM. When you click on the Root Cause Analysis icon, it'll say: "Click on the difference that you want to inspect."
Let's say I want to click on the highlighted image.
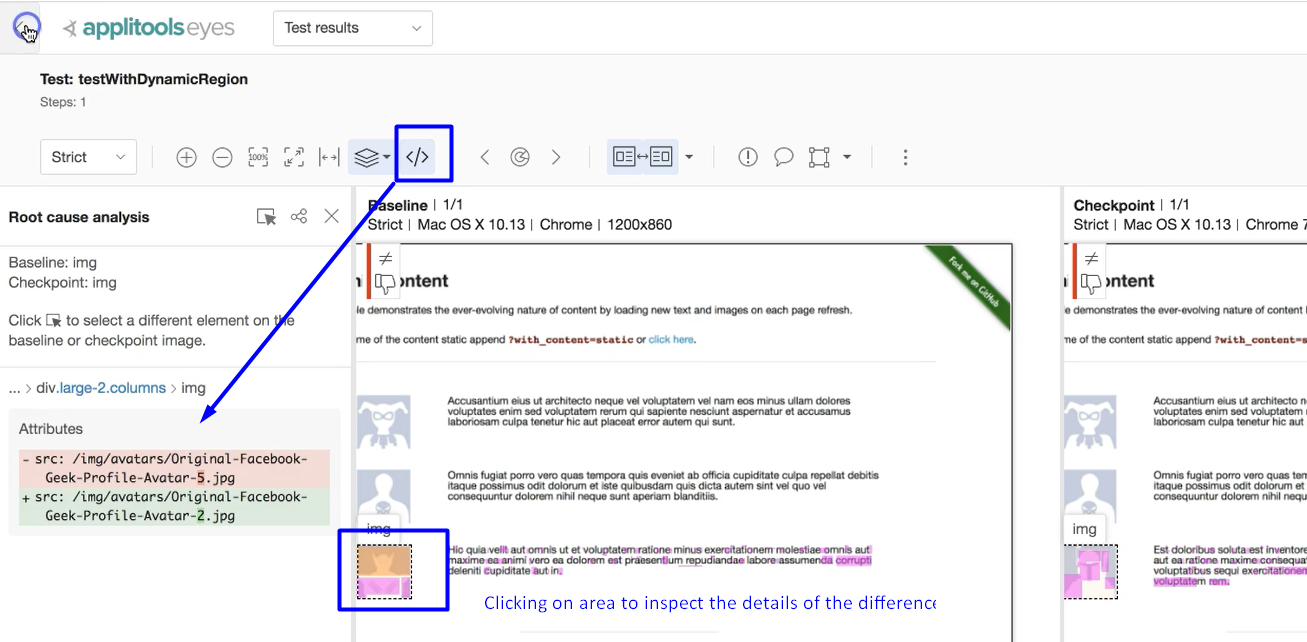
Now I can see what changed under the covers. So, it's not just limited to the visual difference on the surface but also the changes that are underneath.
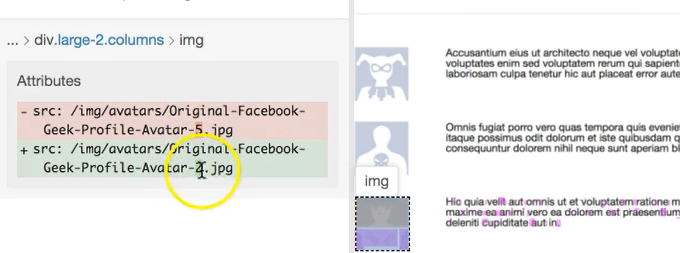
The highlighted portion shows me what's changed. In the original baseline image, we see that we had Avatar-5 and the new checkpoint image we see that we have Avatar-2. So, it directly identifies what's wrong here and what changed in the DOM.
When I report this bug, I can now specify not that just the image is different, but I can say, "Hey, it used to be Avatar-5 and it got changed to Avatar-2" and the developers don't have to worry about debugging this. They can directly identify where this change was made.
# Previewing Match Levels
Let me show you another cool trick. If you go within any of your results, you can look and see which match level it was checked against. Not only that, you can preview what it would look like if you ran the tests at different match levels.
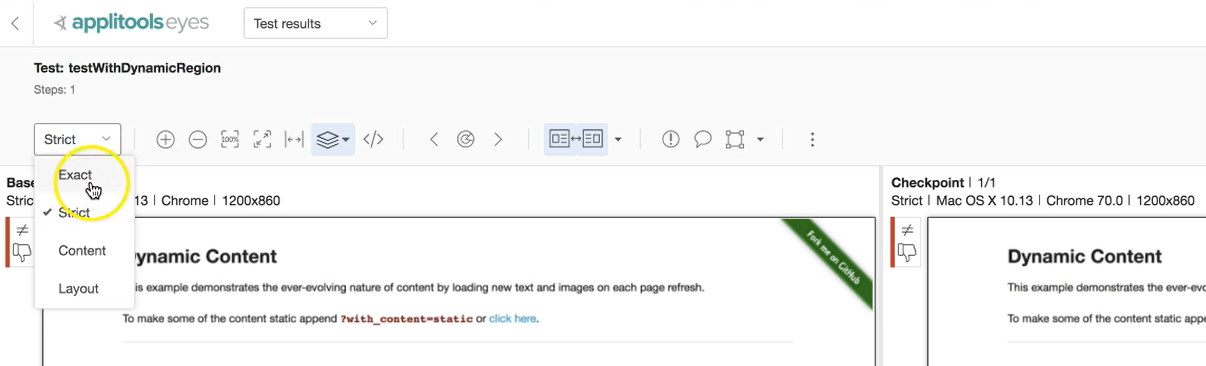
For example, if you wanted to know what a test would look like if you ran it at Exact, you could see the differences. Or if you ran it at the Content level, what would that look like? Or if you ran it at the Layout level, what would that look at?
Note, this won't change the way your test is run in the future. This is merely a preview, but it lets you know what the test results would look like if you ran them at different match levels. So you can decide if you want to change it to that level within your code.
# Deleting a Test and/or Baselines
To delete a test that you no longer want to track, select the test you don't want anymore, and click the trash icon. As a precaution, you will get a pop-up screen to verify that you want to delete the selected test(s).
It is important to know that this only deletes the test, and the baseline will still be saved. This is so you can run additional tests without having to grab the baseline screenshot again.
If you run into situations where you had an incorrect baseline, and want to start fresh, you have to delete those using the Branch Baselines option. Again, you would simply select the baselines you want to eliminate and delete.
By completing both of these steps, both the test and the baseline will be deleted. If it’s a test that is no longer needed, you can leave it gone, or you can rewrite the test and run it again to get a new baseline.
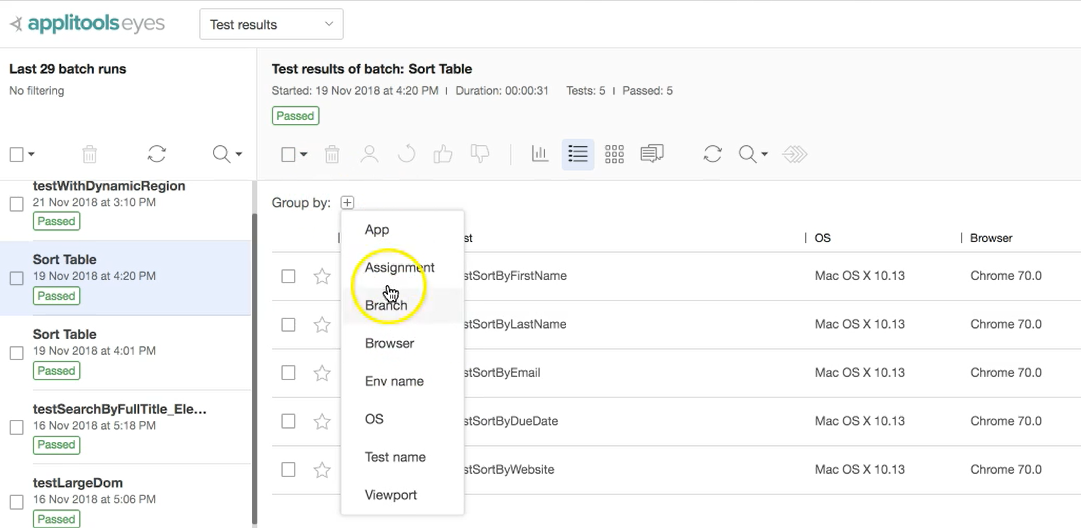
# Group Test Results
Let me show you another cool thing you can do. Let’s start by looking at the results for this Sort Table batch.
Let's say that we ran all of these. Right now, they are all on on the same list, same browser, same viewpoint, etc. But, let's say that they weren't the same and there were some differences.
We could group these by different things: by app or by who it's assigned to, by the browser they're in, the OS, test name, view point, all of these different things. We could narrow down our test that way. So, if you have a bunch of tests within a given test branch you could essentially group them by whatever you would like.
# Actions on Preview Page
When we look to the far right of the test results page, we see that there are additional functions available.
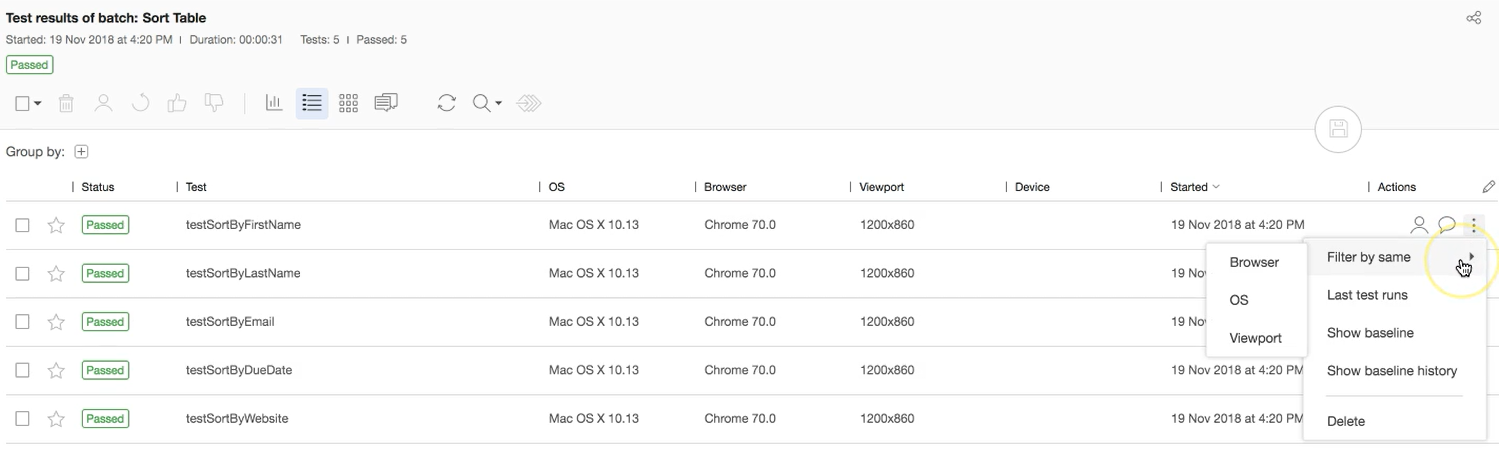
You can take actions, such as assigning a test or making a comment. You can do that at this level without actually going inside the test, which is especially helpful when you need to apply the same action to multiple items.
You can also:
- Filter by same Broswer, OS or Viewport
- View last test runs
- Show baseline
- Show baseline history
- Delete
As you can see from this overview, the Applitools Test Manager is a very rich dashboard that you can utilize in lots of different ways to manage your tests.
