

Transcripted Summary
Why is test reporting really important?
There are a couple of important places where test reporting plays a very crucial role.
When you're writing or developing your tests on your local and running them, even a local report could suffice.
But when you start to run these in a CI or start to scale it to multiple people in the team, you want a solution that's able to give you the insights on where exactly the test failed, how it failed, and to be able to help you to debug it easily, as well as share this analysis with other people.
There are multiple tools that are available that you can make use of to create a reporting for your own project, not limited to you building your own solution for your own custom needs.
However, in this particular tutorial, we're going to take a look at reportportal.io, which is one of the open source solutions, and provides a very rich set of features outside of the box with very minimal setup.
Let's understand how to work with ReportPortal in this video.
If you go to reportportal.io website, you can see that they illustrate all the features that are available with real-time analytics and visualization of test results.
# Setup ReportPortal using Docker
We are going to use Docker for Mac to set up this entire dependency.
You can just go ahead and search for it, or the link is available in Resources below.
This is going to give you an option to download the particular application and then install.
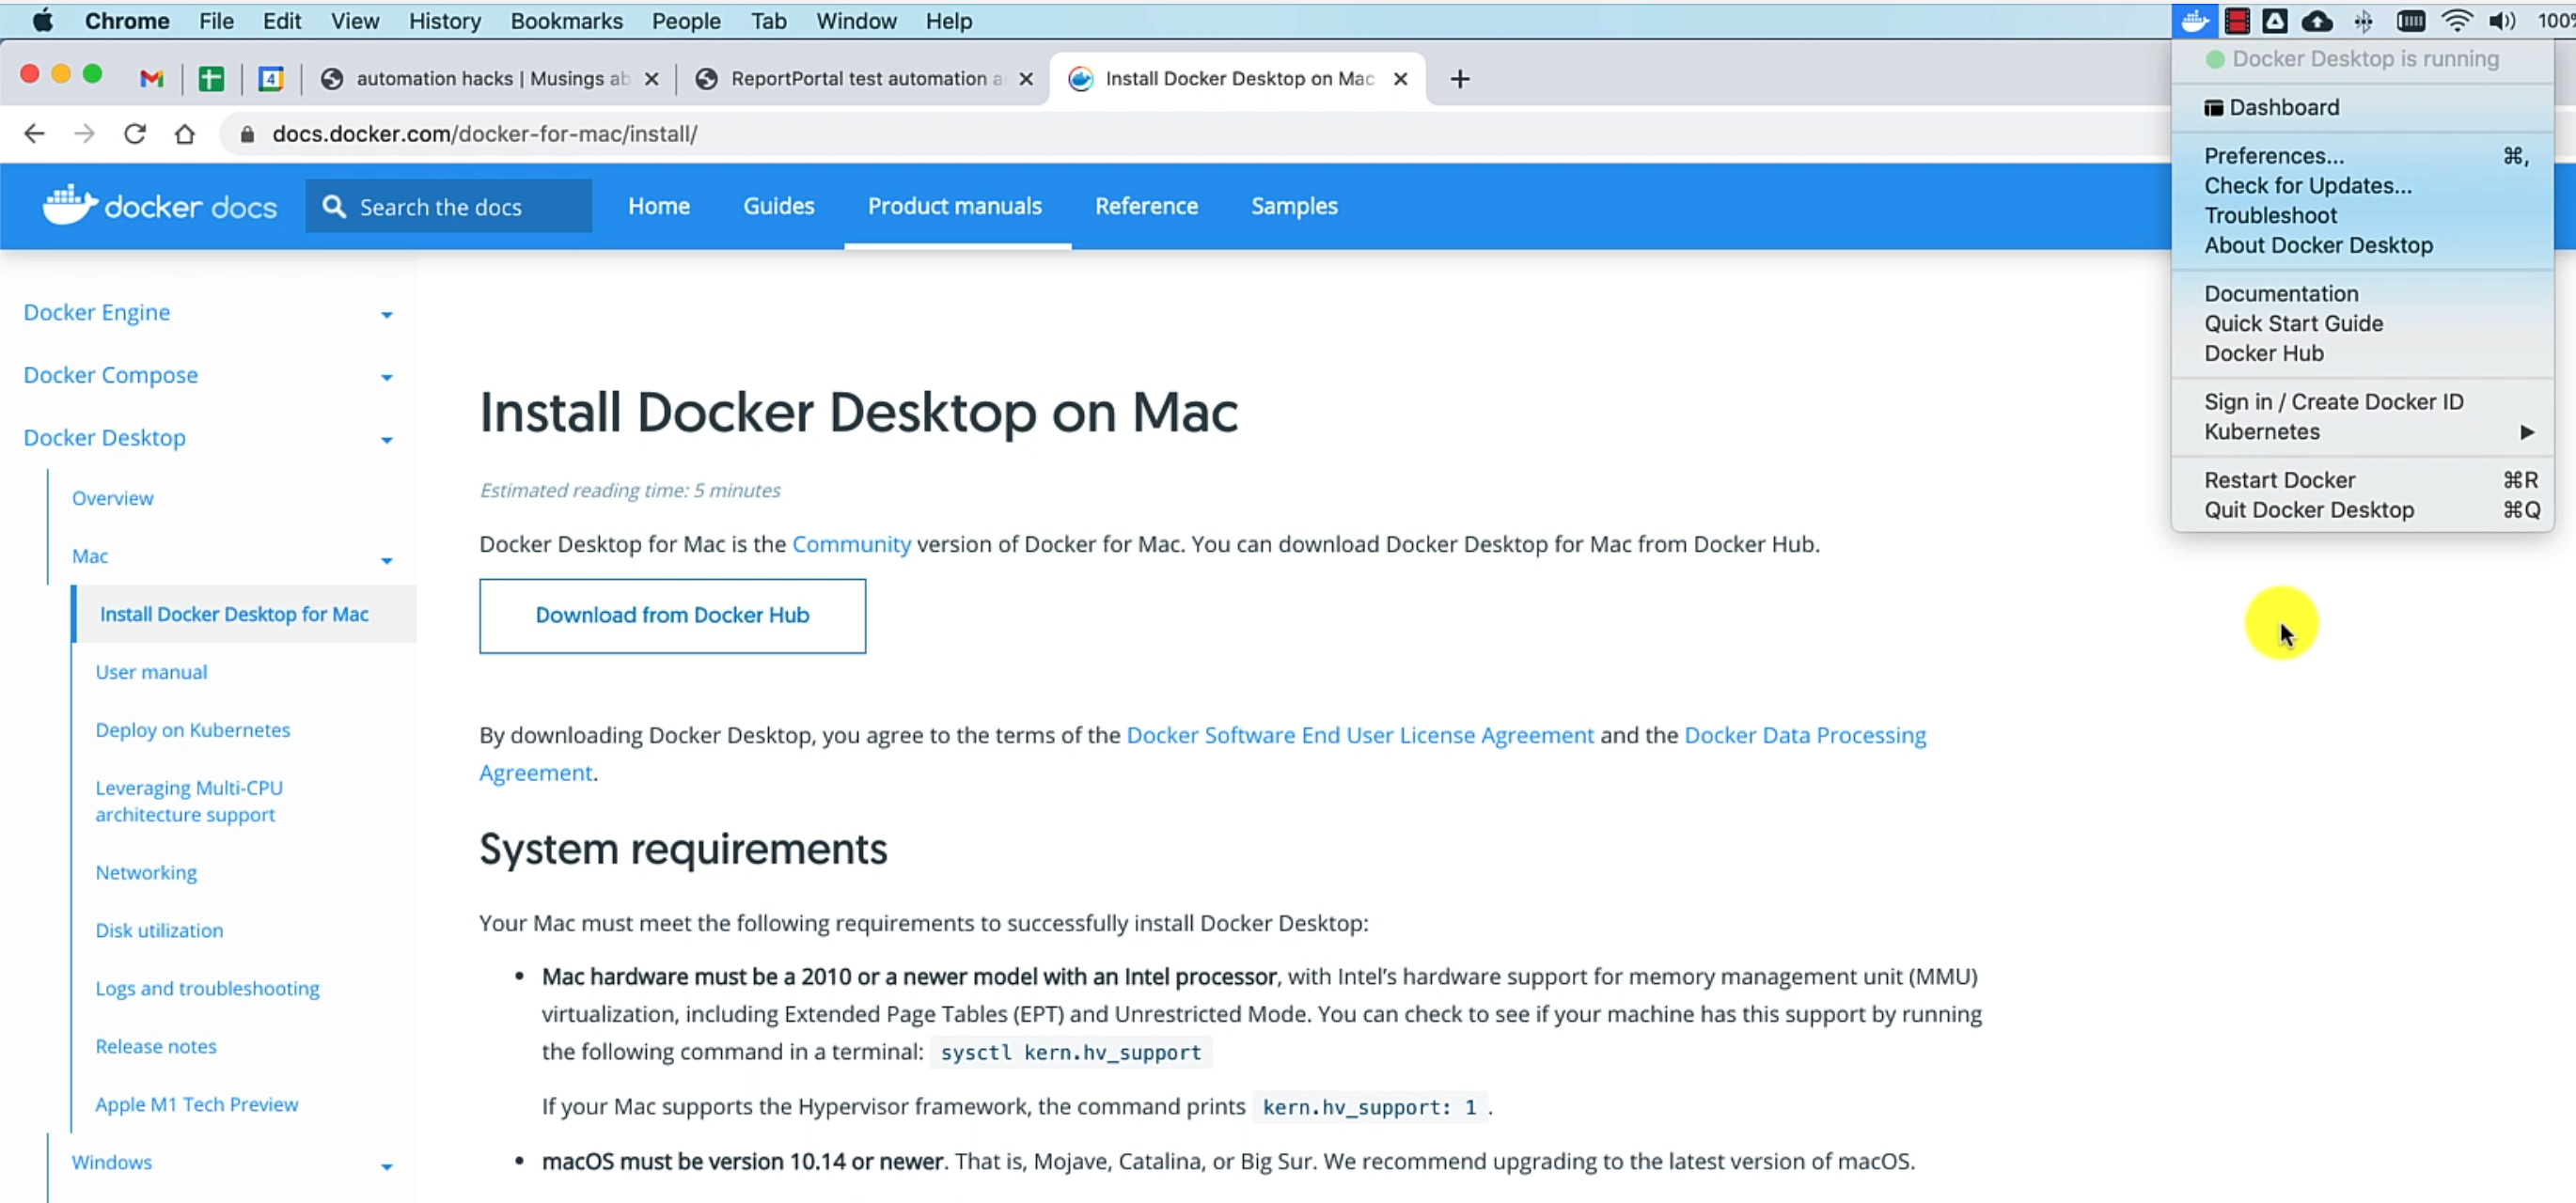
Once it is done, you need to ensure that your Docker Desktop is running and that's pretty much it for what we would need to set up ReportPortal.
I've also gone ahead and written a blog on how exactly to work with a ReportPortal and Docker within our framework context.
If you have not already gone through it, you can go to automationhacks.io and check out this blog, which provides all the details that we'll be looking on in this tutorial.
A couple of important steps on setting up Docker in your machine.
You need to download the Docker compose file from this command:
curl https://raw.githubusercontent.com/reportportal/reportportal/master/docker-compose.yml -o docker-compose.yml
We have already gone ahead and downloaded this in our project.
Let's see a couple of details around how it actually works.
Before we do anything, let's make sure we check out the example/08_adding_reporting branch in our project that we have been working with.
As you can see, ReportPortal makes use of multiple dependencies to set up the entire API, as well as the frontend and the database.
It uses ElasticSearch to store this data and then provide a bunch of additional features.
After downloading the docker-compose YAML file, the step that you need to perform is to run this Docker compose file:
docker-compose -p reportportal up -d --force-recreate
That is going to download all the images and then spin up your containers.
I have already done this, but let's run this again.
As you can see, it's now recreating the containers that I already had.
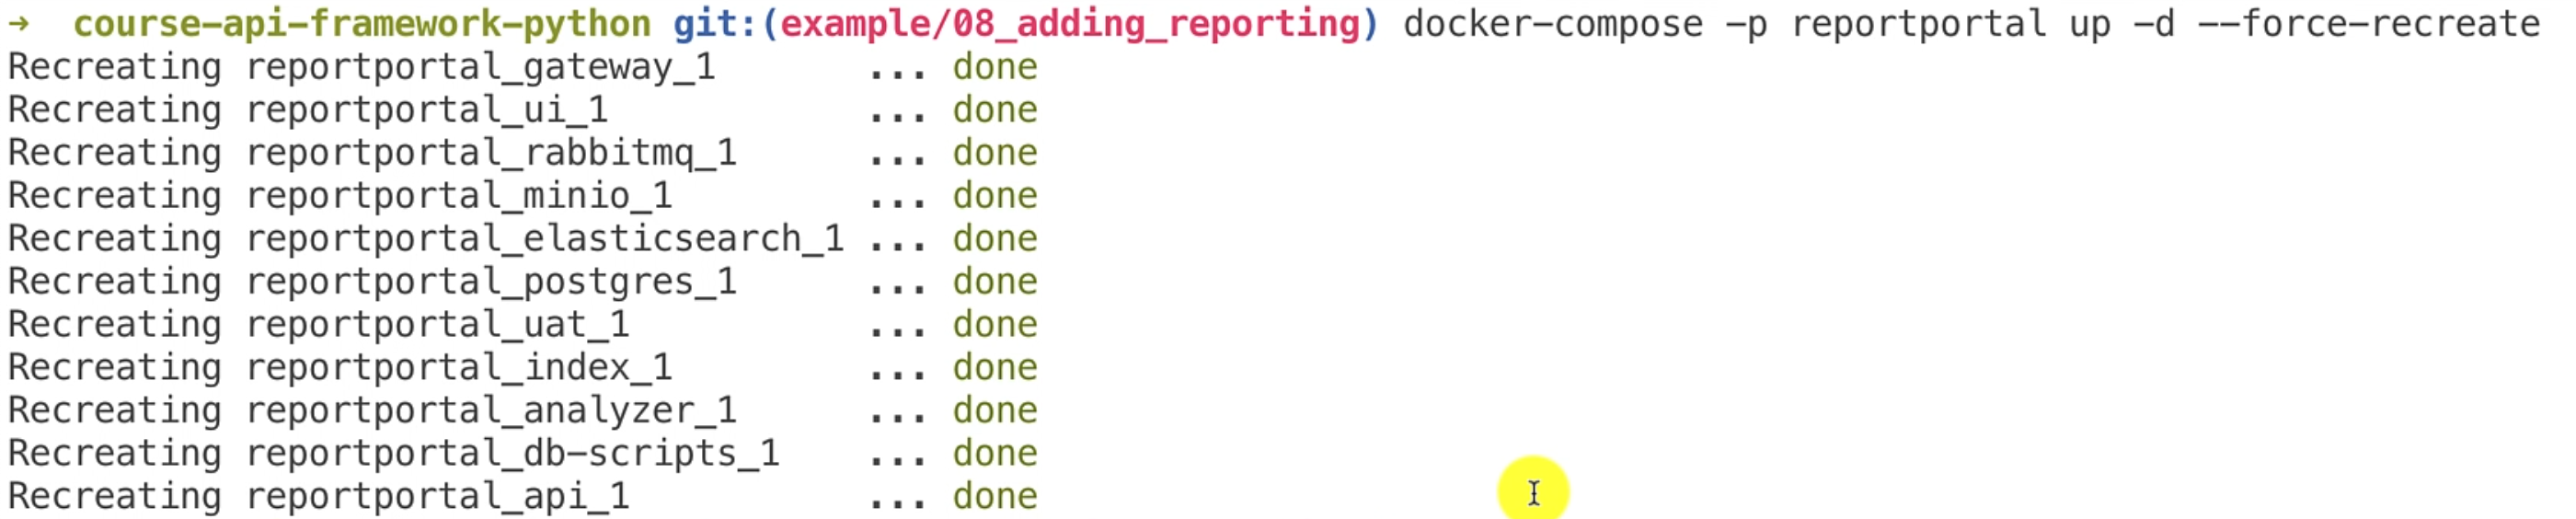
If you have run this command once, and don't want to recreate the containers from scratch, then you can always eliminate this flag --force-recreate.
Also, another thing to note is the first time download might take some time, because it's going to pull all the dependencies into your Docker instance.
We will check whether all the processes are running fine by doing:
docker ps -a
Here, you can see all the containers that are running as part of ReportPortal.
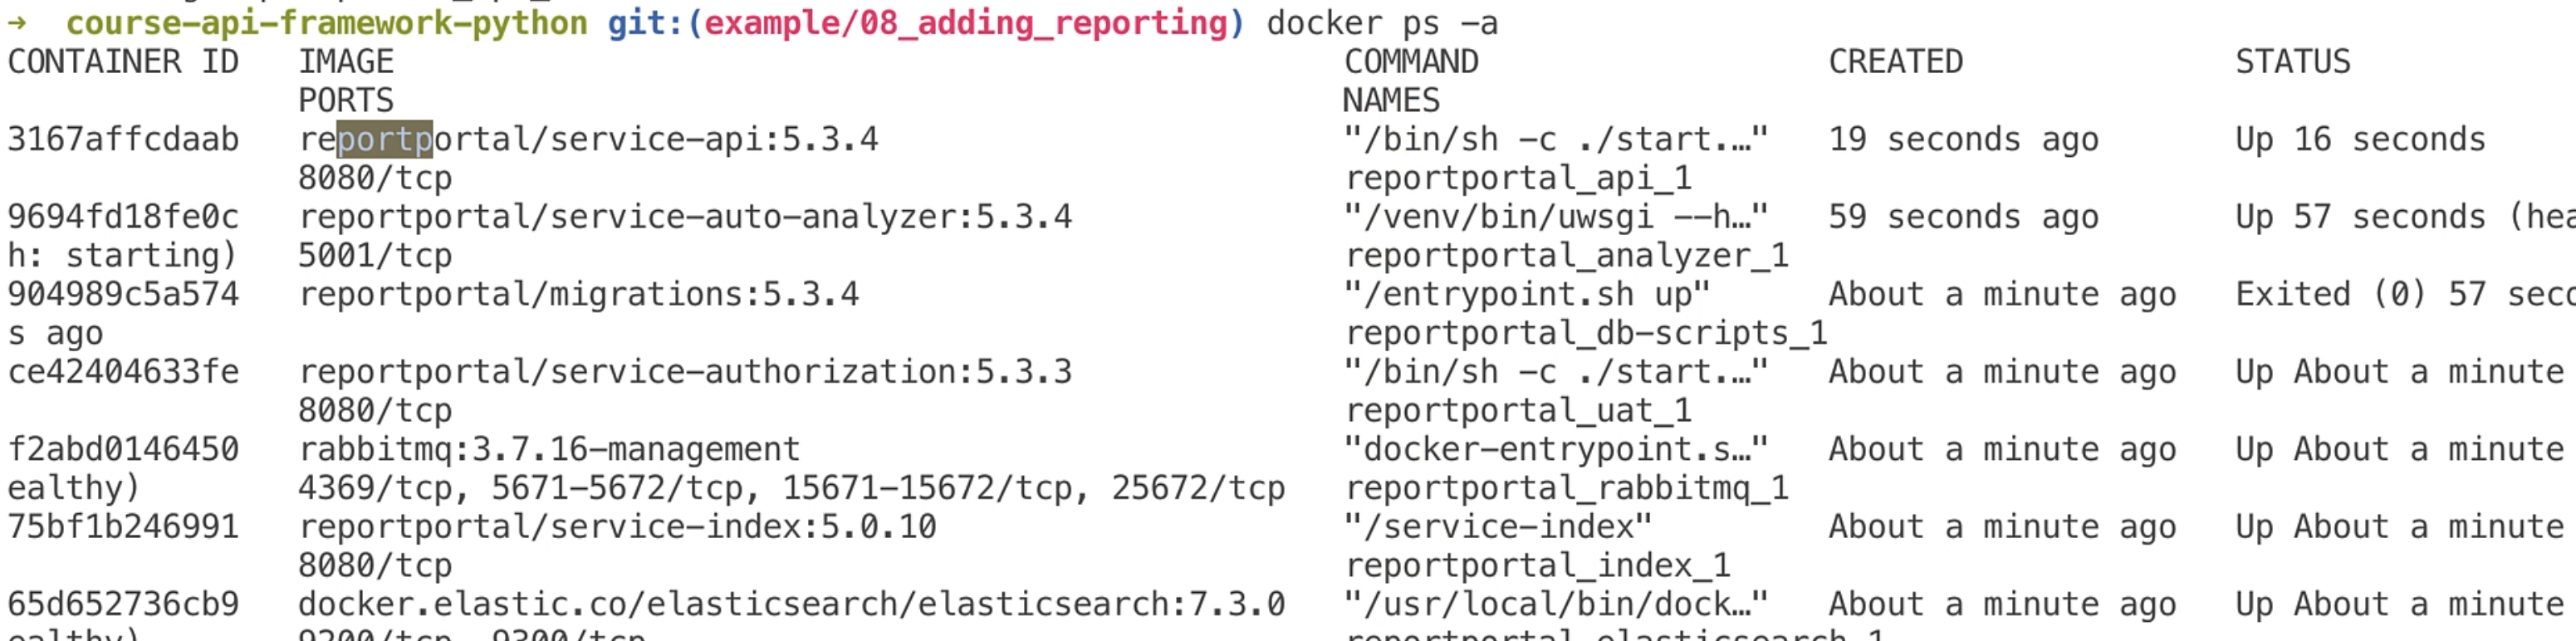
All of these will be prefixed with reportportal so that you can easily filter and search them out.
Looks like everything is up, so let's just go and check whether our instance is up.
I'll go to localhost:8080, and you can see this is the ReportPortal instance that is created.
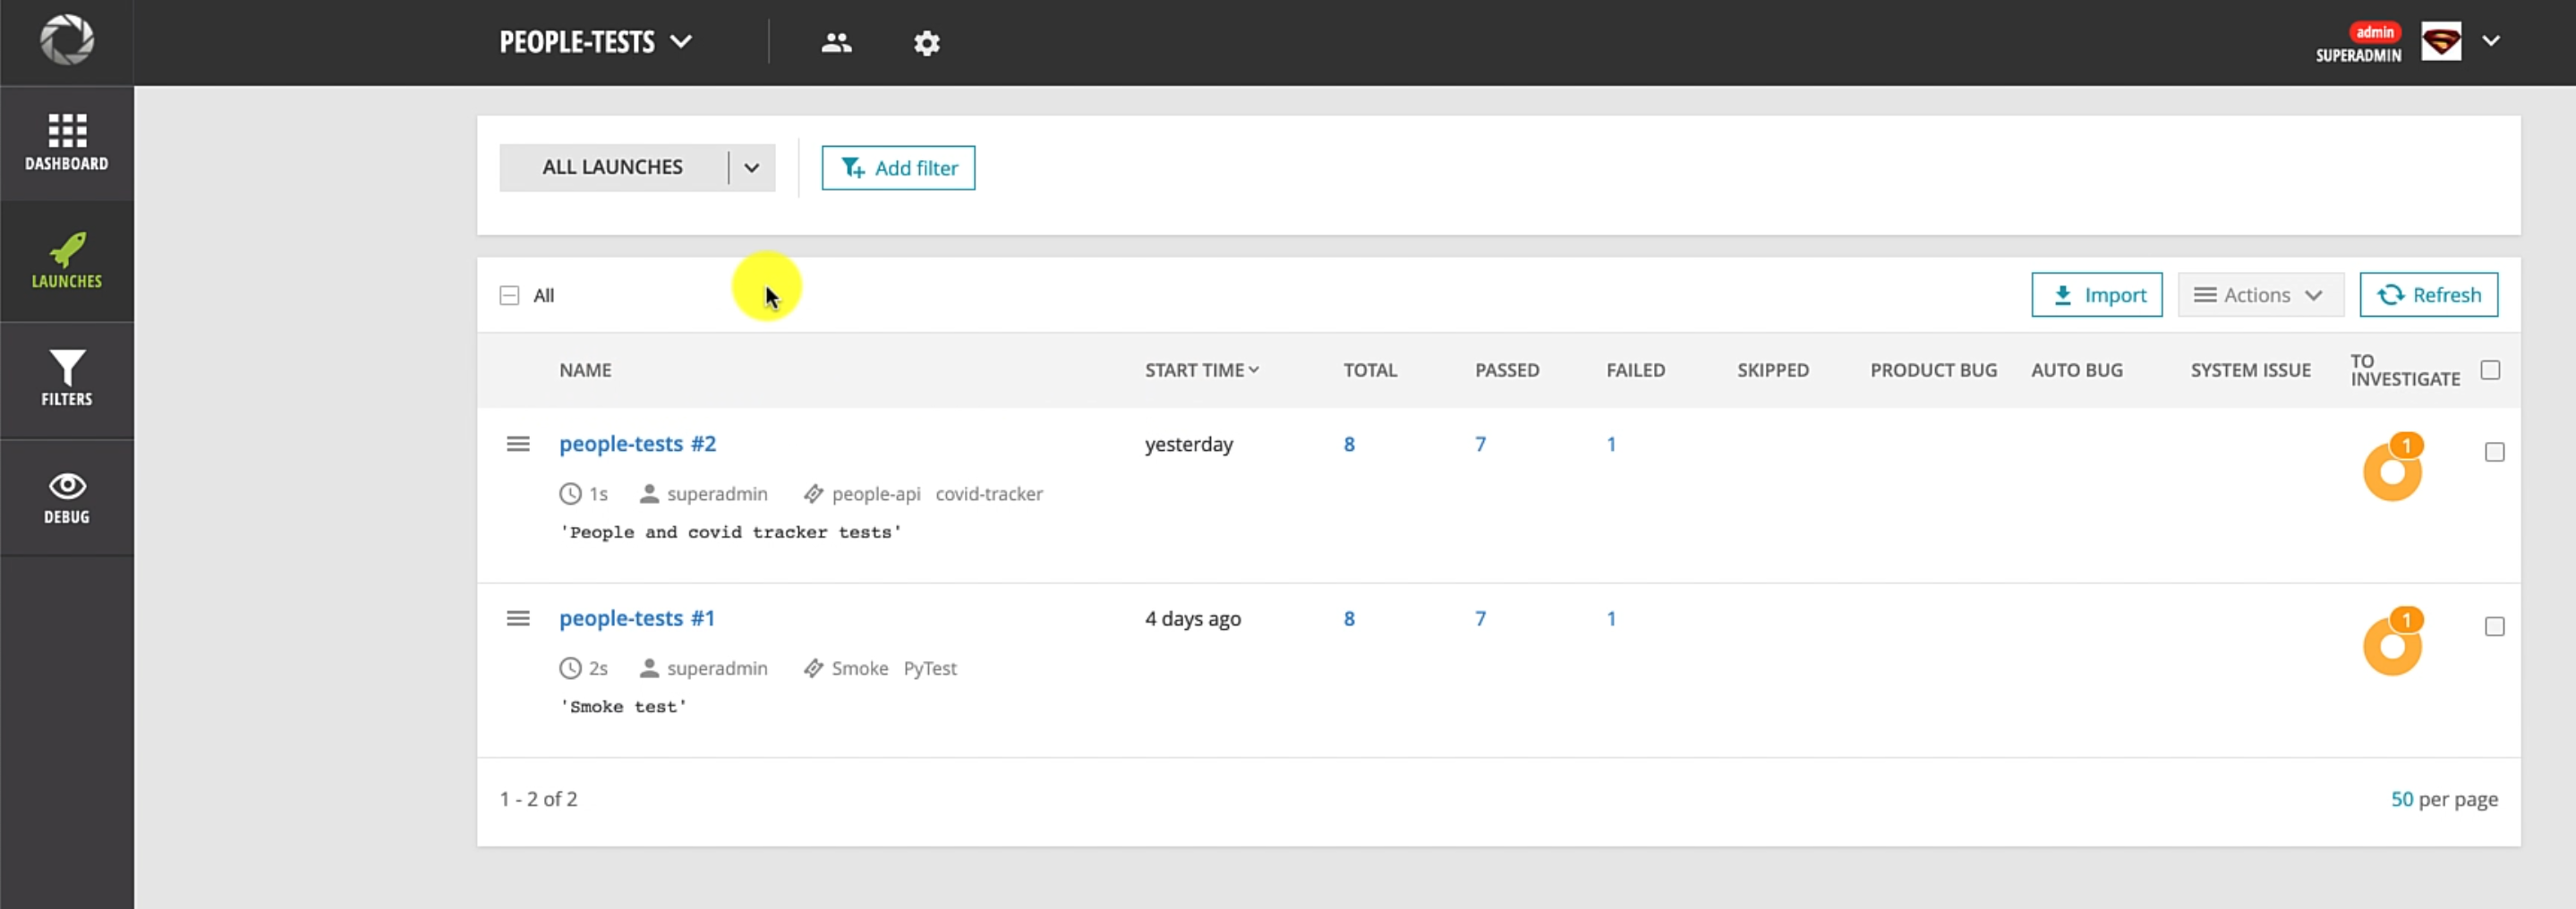
Now we are in ReportPortal, and let me just walk you through a bit about the UI.
ReportPortal has a concept called as Launches, which is nothing but a unique test run.
Every time you run this suite, it is going to create a new launch in the system.
I will walk you through more details on how it is set up and everything.
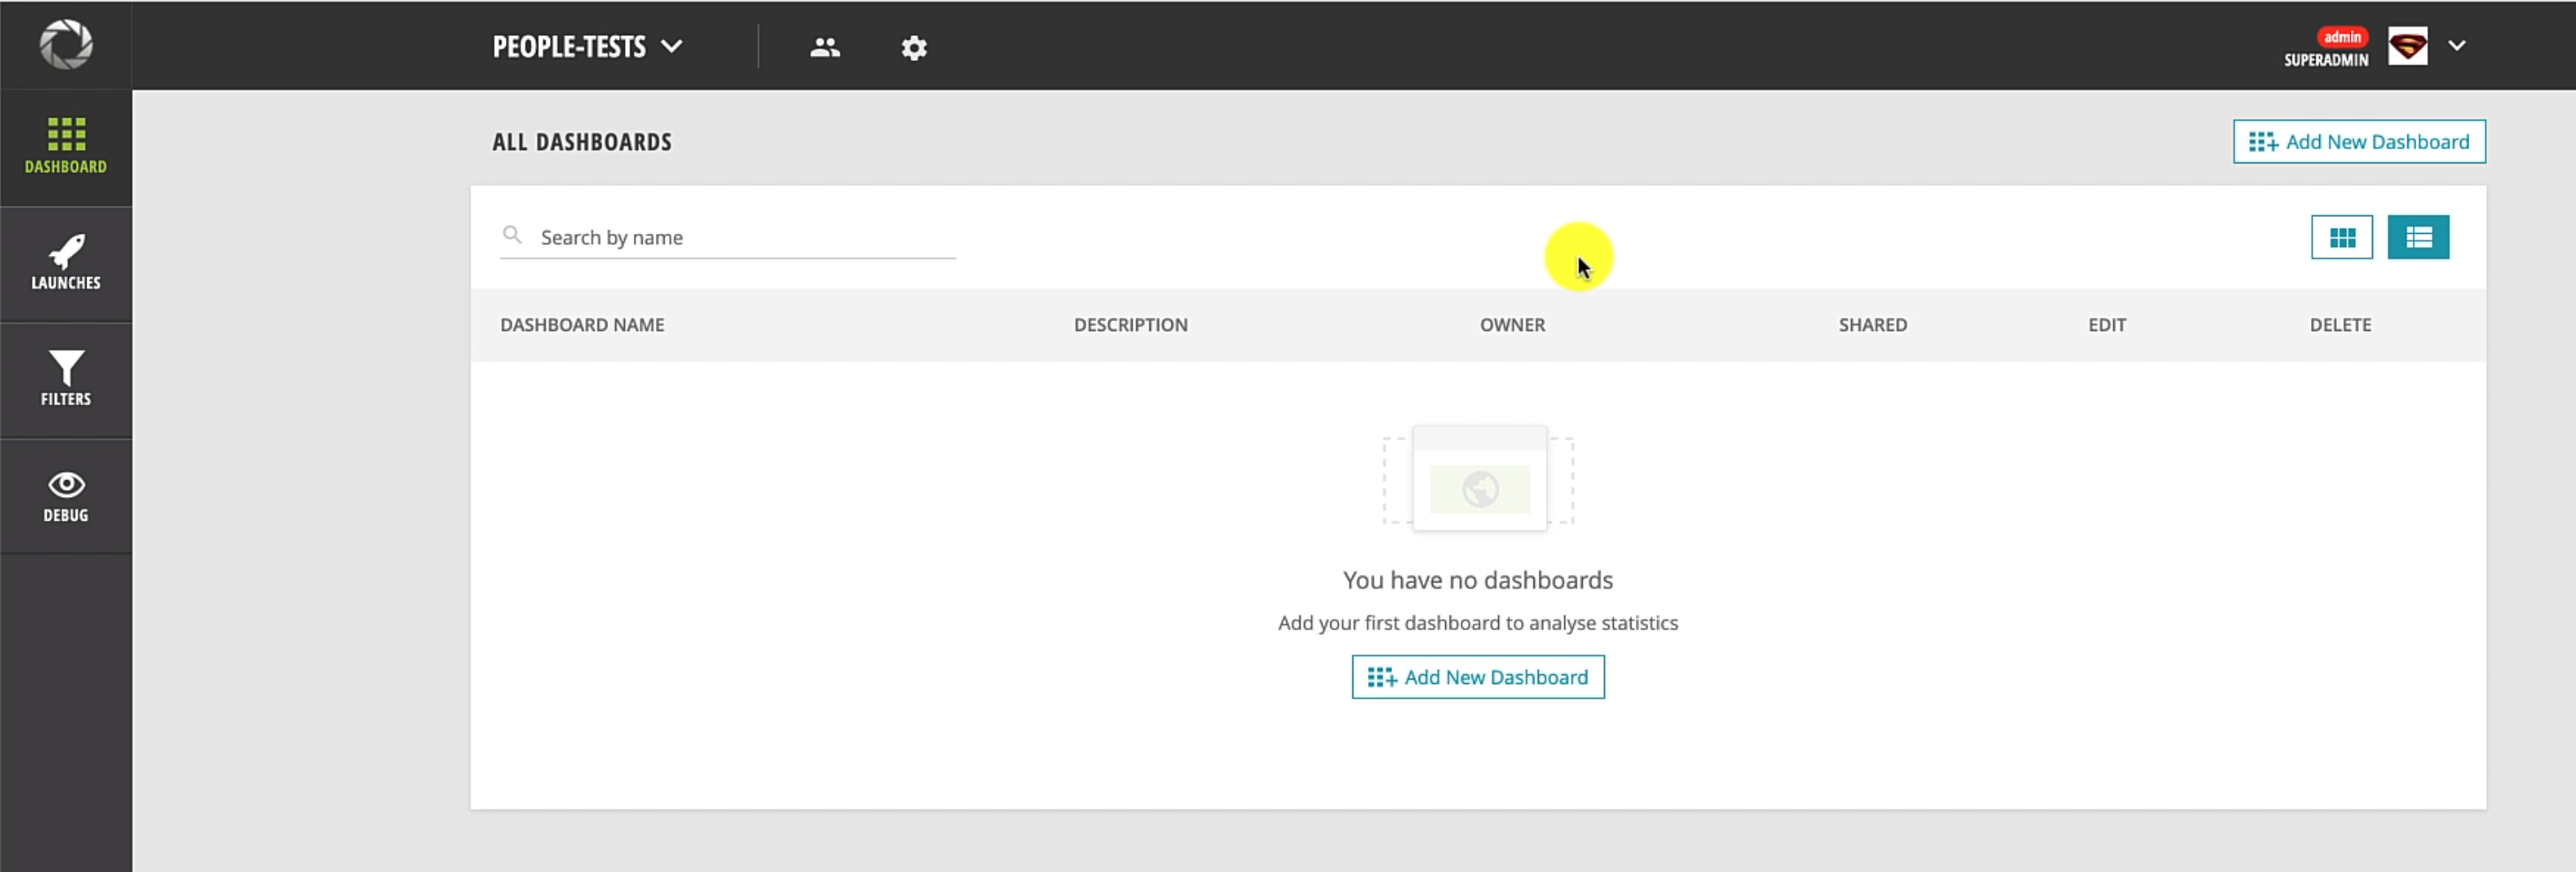
As you can see, I already have a project created in ReportPortal to try this out.
But if you want to go ahead and create a new project for the first time, you can go to "Administrate", and you can add a new project with the name that you choose.
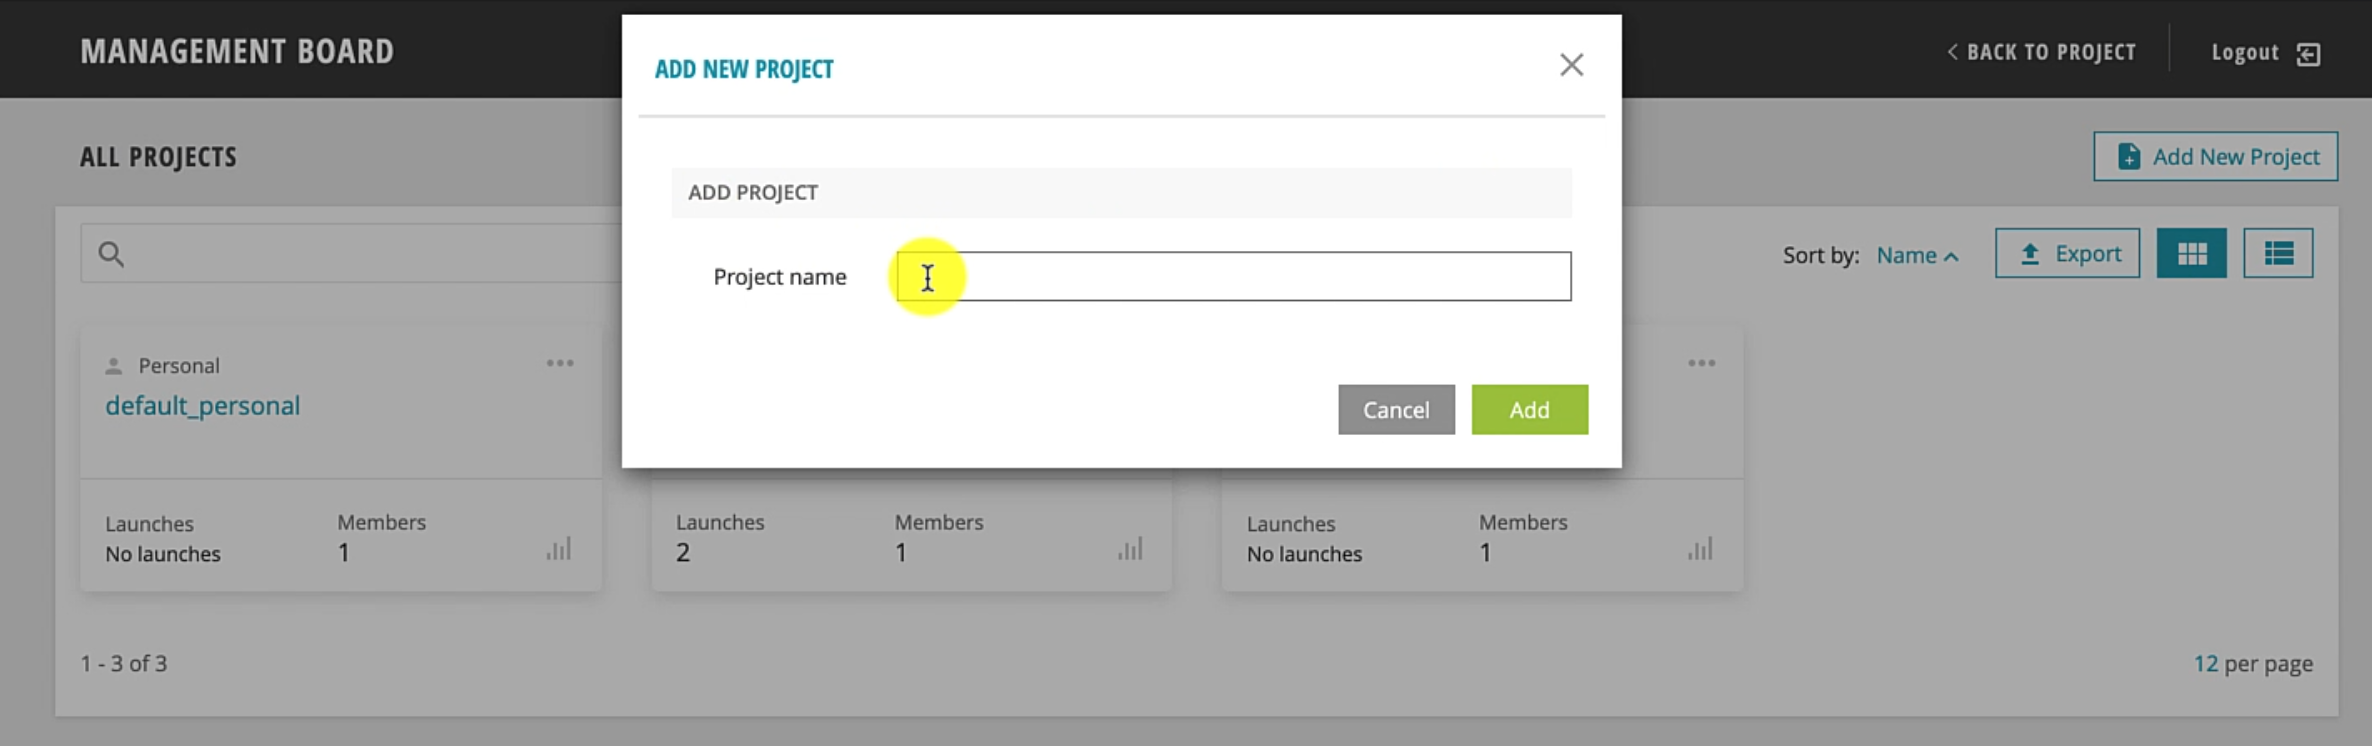
Once it is done, you're going to have a project like this already created.
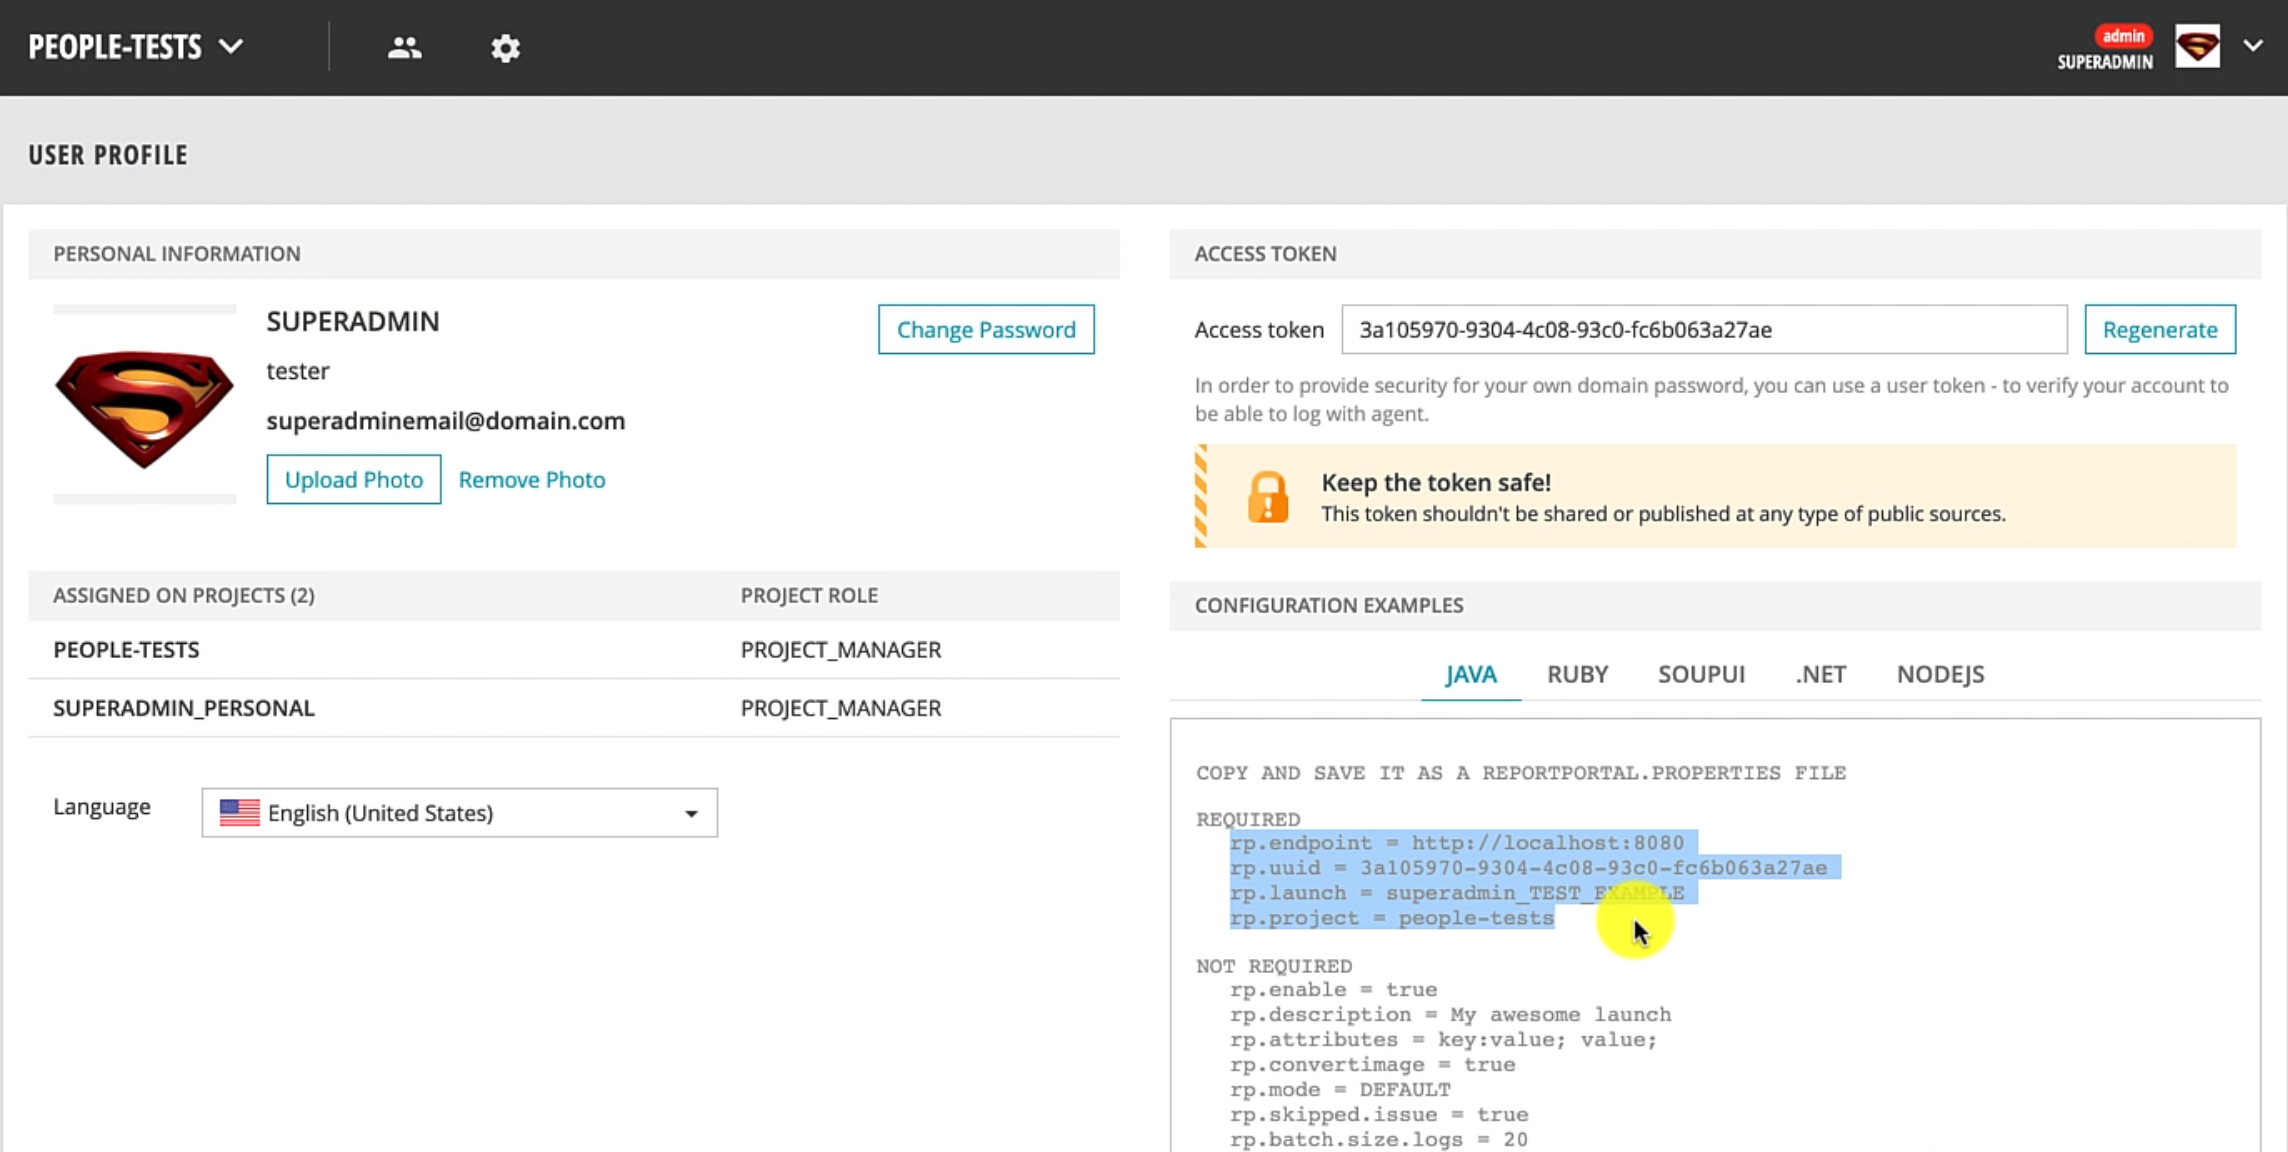
The next step after creating the project is to ensure that you have it selected here.
Then, you can go to Profile and copy some useful information that identifies this unique project.
Before we move further, if you start to get a problem where you see ElasticSearch instance keeps on restarting, you can follow these steps in the blog.
Let me just outline the steps that I use to actually fix this issue.
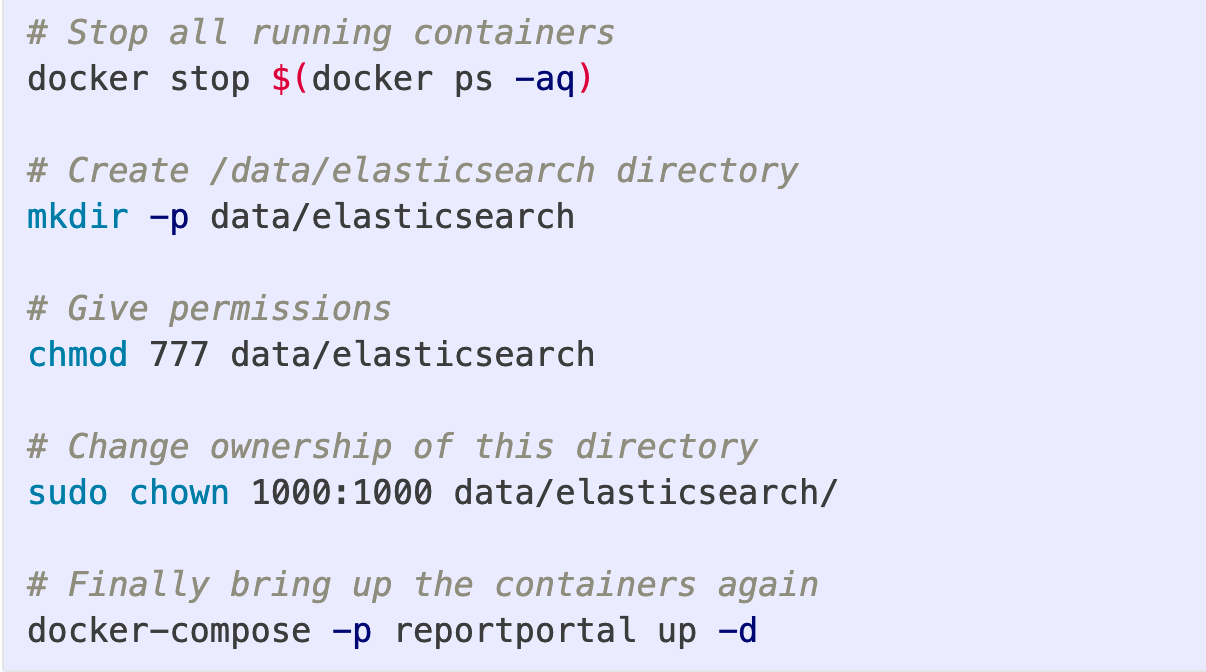
However, if you did not get this issue, feel free to just skip this section and move ahead.
I'm stopping all the containers, and then I'm ensuring I create the /data/elasticsearch folder and I'm giving it all the permissions, and changing the owner.
You need to follow these three steps before you start up your ReportPortal instance, and this will make sure that all the access and permissions have been set up.
If you want more details, you can go to the GitHub issue that is mentioned and the threads on ReportPortal/Slack channel.
However, if you try this and you still feel ElasticSearch keeps on restarting, you can go to Docker settings and clean or purge any data and reset it to factory defaults, which is going to ensure that there is no stale data that is causing this issue.
Let's go ahead and understand how we can set up ReportPortal integration into our framework that we have been working with.
We have been making use of Pytest as a framework, so we'll look at how to do that specific integration.
However, you can go and check all the different integrations that ReportPortal actually supports.
As you can see, ReportPortal can integrate with many Java and JavaScript clients, and also has integrations for Python based agents.
# Integrate with pytest
What we are going to make use of is the Pytest plugin for ReportPortal - let's understand how that is set up.
Here, you have the agent Python Pytest plugin that provides you the ability to integrate Pytest and report all the results into the ReportPortal.
The README is quite nice, and it has a lot of good documentation on how to approach this.
We'll also understand some of this as part of our framework.
# Step 1: Create a project in ReportPortal and update pytest.ini file
Once you've created these four properties - rp.endpoint, rp.uuid, rp.launch, rp.project - we need to create a pytest.ini file in our project and then update these values.
If you go and check out the branch that we have been working with in the pytest.ini file, we have updated these four properties.
[pytest]
rp_uuid = 28e75c0f-2b29-49a1-9e2e-c45c9650dff0
rp_endpoint = http://localhost:8080
rp_project = people-tests
rp_launch = people-tests
rp_launch_attributes = 'PyTest' 'Smoke'
rp_launch_description = 'Smoke test'
rp_ignore_errors = True
rp_ignore_attributes = 'xfail' 'usefixture'
I've also kept the name of the project and the launch the same, however, you can choose to change the launch name if you desire.
Currently this is hosted on our local, but if this ReportPortal instance was hosted on your company's particular VM or Docker infrastructure, then you can just go ahead and change the host to the instance that is actually hosting that.
A couple of other things - you can give rp_launch_attributes, which are additional tags that you want printed.
This is useful if you want to separate the launch and easily identify which launch was for which specific area in your application.
You can also give a description for the launch so that people can understand what these test results are all about.
# Step 2: Add session-scoped logger
Now we have the pytest.ini file, the integration part into our framework is quite simple.
If you go to conftest.py file at the module level, you can see that I've added a new logger method, and this is our session scoped fixture, which means that it would be available throughout your test suite run.
import pytest
from pytest_reportportal import RPLogger, RPLogHandler

@pytest.fixture(scope="session")
def logger(request):
   logger = logging.getLogger(__name__)
   logger.setLevel(logging.DEBUG)

   # Create a handler for Report Portal if the service has been
   # configured and started.
   if hasattr(request.node.config, 'py_test_service'):
       # Import Report Portal logger and handler to the test module.
       logging.setLoggerClass(RPLogger)
       rp_handler = RPLogHandler(request.node.config.py_test_service)

       # Add additional handlers if it is necessary
       console_handler = logging.StreamHandler(sys.stdout)
       console_handler.setLevel(logging.INFO)
       logger.addHandler(console_handler)
   else:
       rp_handler = logging.StreamHandler(sys.stdout)

   # Set INFO level for Report Portal handler.
   rp_handler.setLevel(logging.INFO)
   return logger
Let's understand this method a bit better.
What you can see is we're creating a logger instance from the standard logging module of Python, and then using the Pytest conventions we are checking if our specific test node has this particular config, then we're attaching the ReportPortal logger and the handler classes to this logger.
Additionally, we're adding a console logger as well, so that we can see these logs in the console as well.
However, if this plugin py_test_service is not set up, then this fixture just creates a normal StreamHandler and a normal logger that we can make use of.
We set the default level to INFO and then we return it.
# Step 3: Add logger to tests
Let's see how this is consumed in the actual test.
You can go to people_test.py.
A couple of important integrations that I have added now is I've added a doc string to these test methods.
   """
   Test on hitting People GET API, we get a user named kent in the list of people
   """
This is strictly optional, but ReportPortal plugin has this nice feature where it can actually capture this doc string that you have as a description of the test method.
Once we have done a specific assertion, you notice that I have basically given logger.info.
You need to ensure that logger is passed as a dependency to all your test methods, which will actually log to ReportPortal.
However, ReportPortal will still capture the overall pass/fail metrics without any specific logs.
With all that set up, it's quite easy to actually just start this test.
# Step 4: Execute tests
We are going to run this command wherein we will specify that we want to run the Pytest module in the tests directory.
python -m pytest ./tests --reportportal
A very important thing is to pass this --reportportal flag.
This is going to actually make sure that our tests run and report results into it.
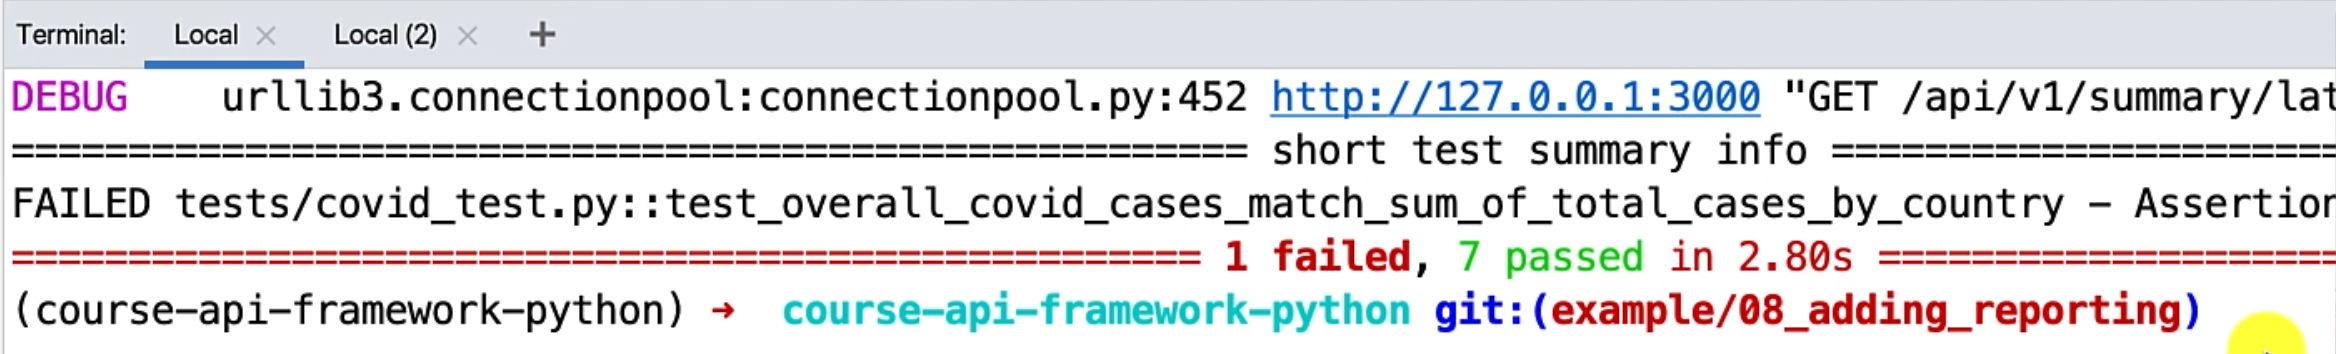
As you can see, the test suite is running and it has already run.
We can notice that we have one failure and seven passed tests.
# Step 5: Analysis in ReportPortal
Let's go back to ReportPortal and see how the test results look.
It created a new test run and gives me the overall statistics of how many tests passed and failed.
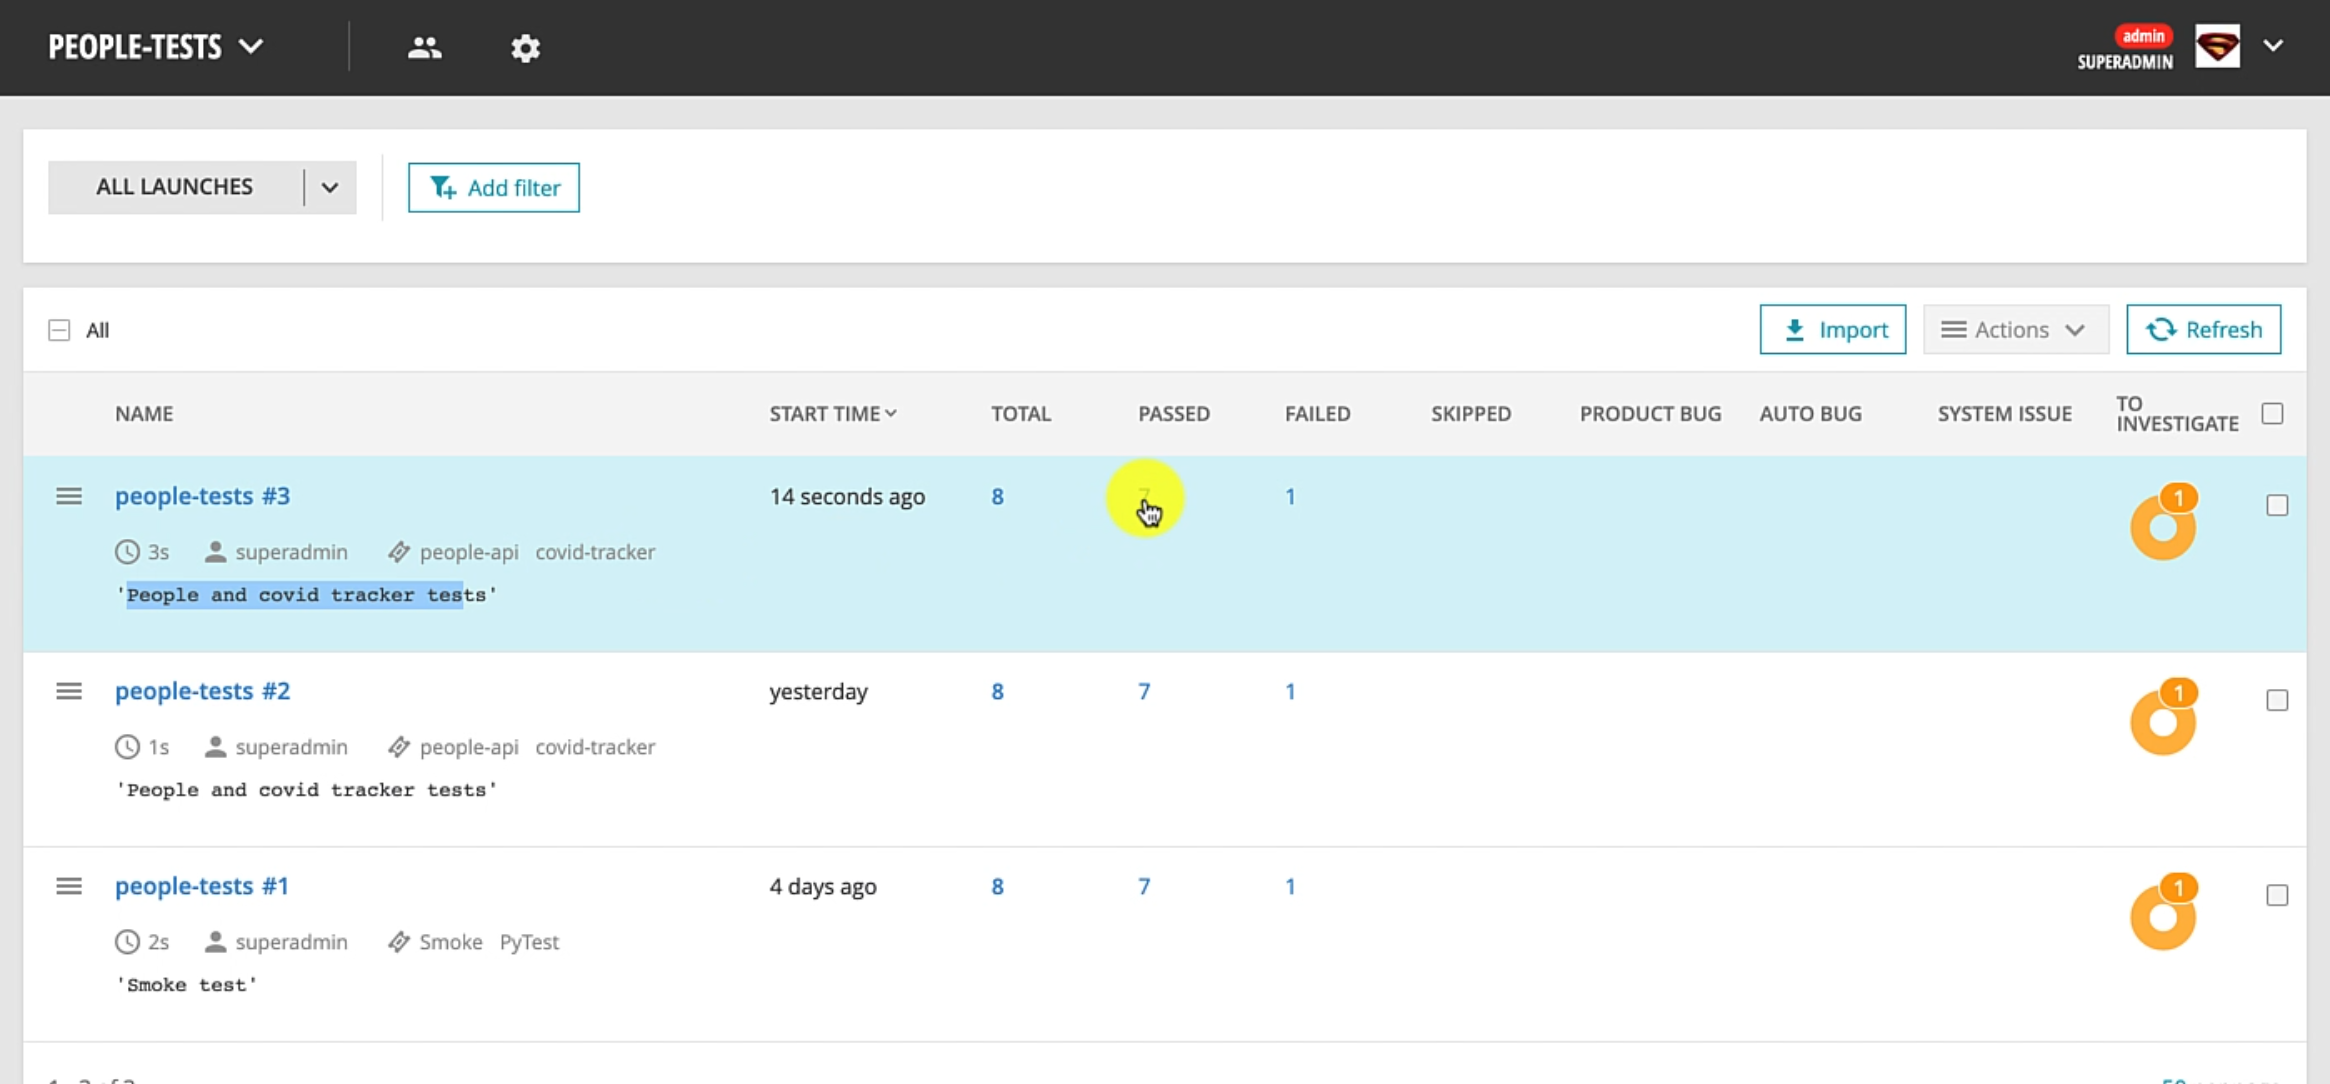
It has the description, as well as the tags that we specified.
Let's go to the passed section first.
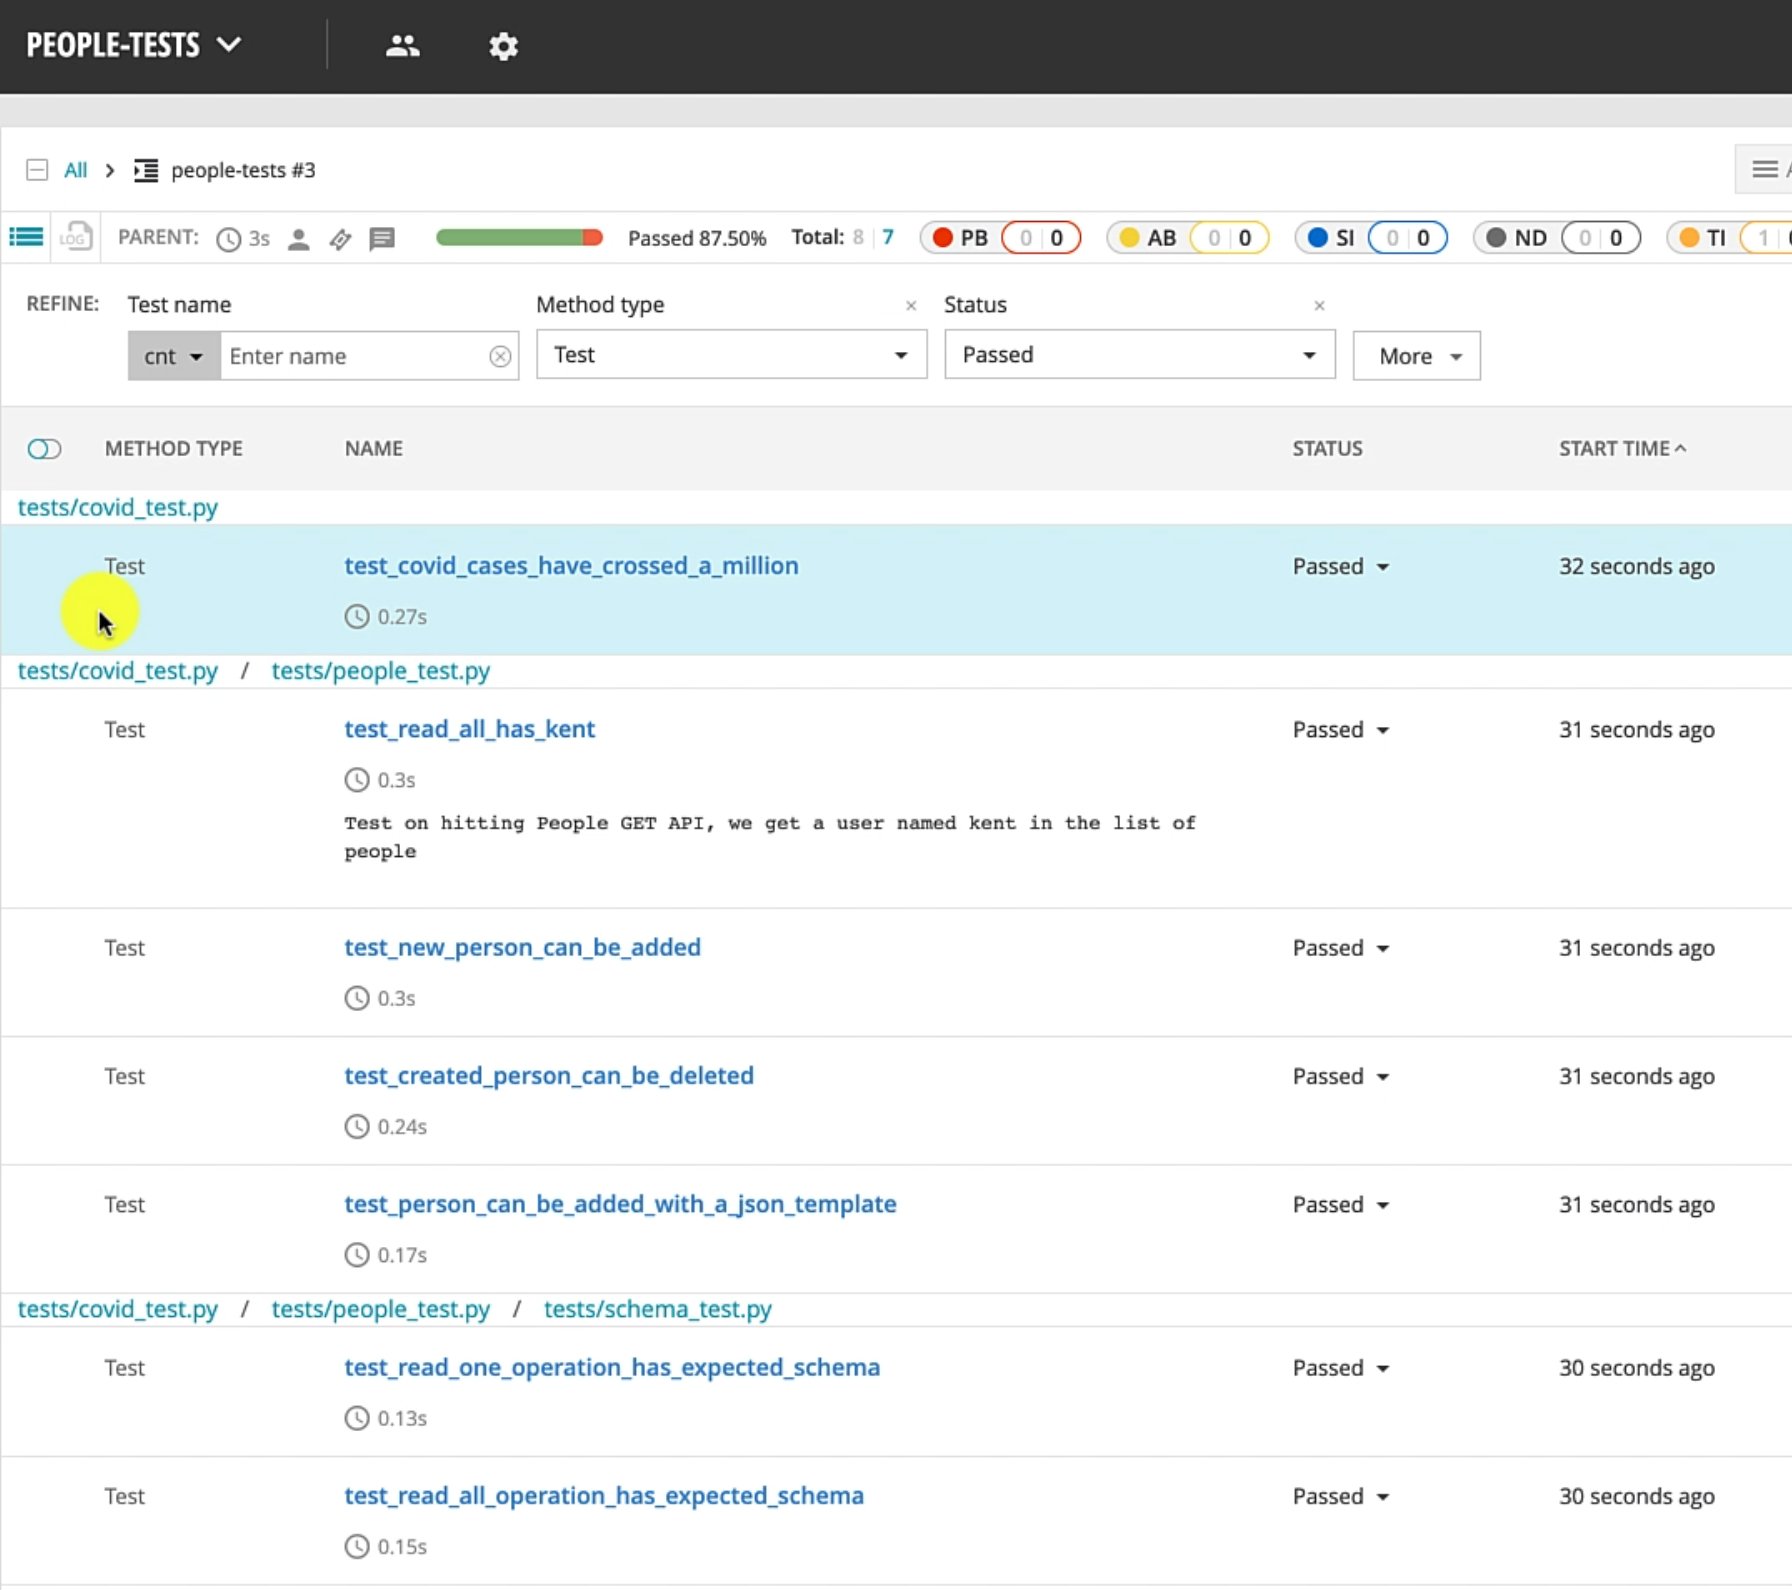
We can see the tests are neatly organized based on the module that they're running in, as well as the actual test.
You can see the doc string that we added on the test method is available.
If you just expand the specific test, you can see it has the message that we were manually printing to the logs.
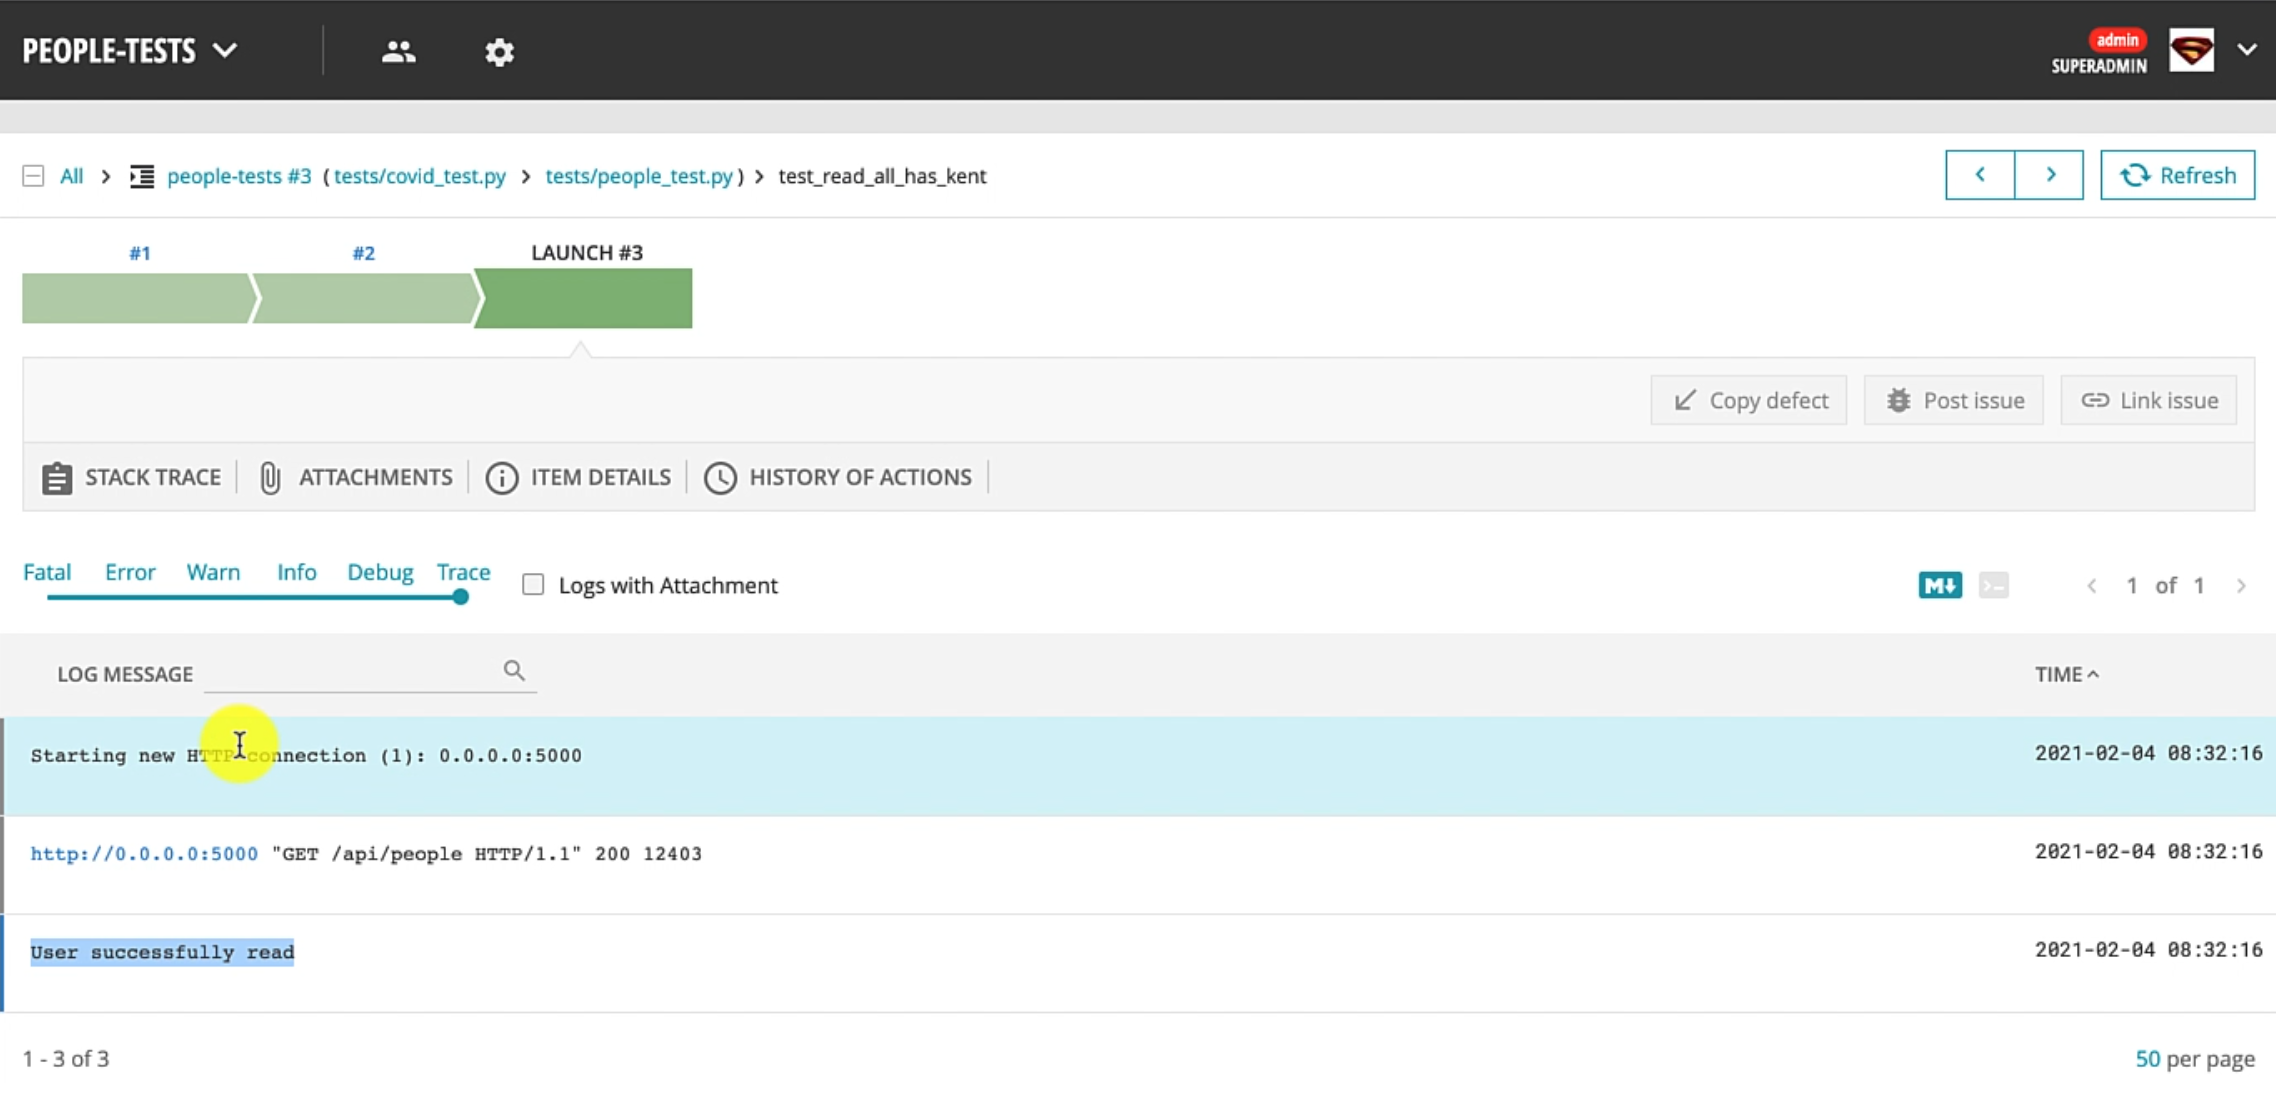
This is really nice because we can give a history of how the test really looks like.
Another important aspect to notice - this particular test actually ran in a specified amount of time and has been passing quite well.
This feature is really useful if you want to identify whether your test has started to fail now, or it has been failing consistently or is flaky.
So, the analysis abilities are quite good.
Let's go back and see the more interesting part on how the failures are represented.
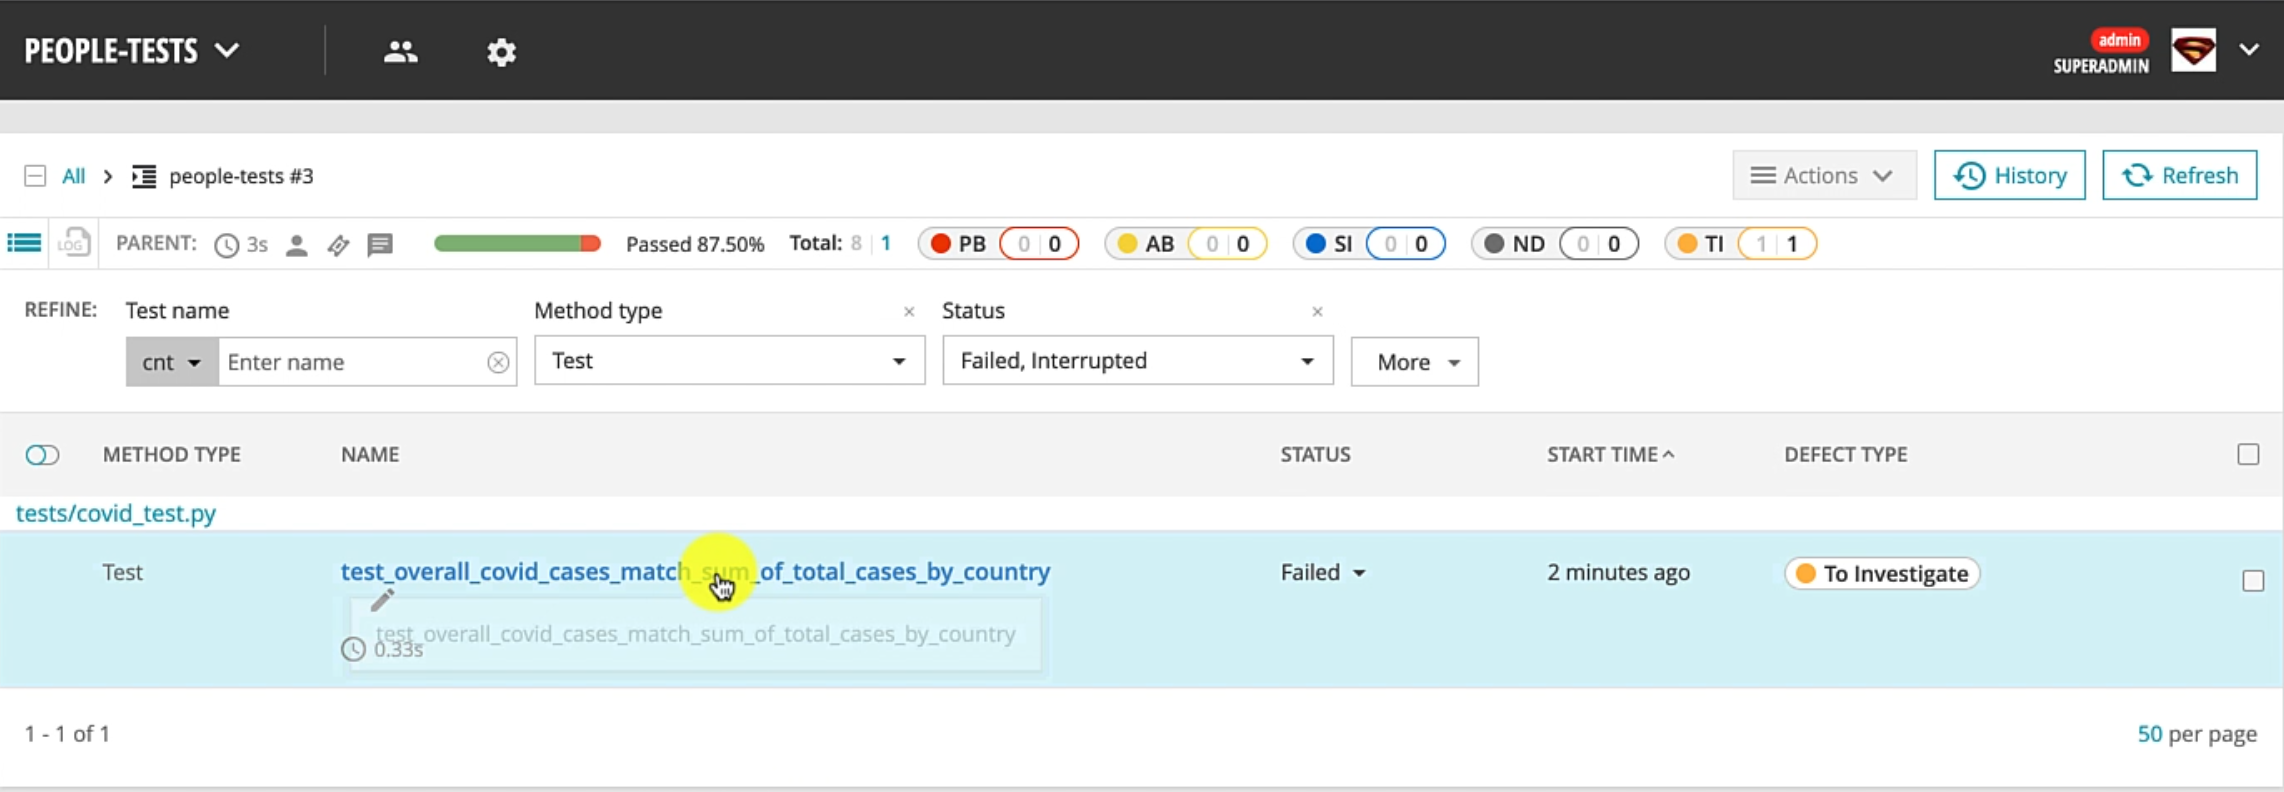
This section lists out all the failed cases, and it tells me that the status for this test was failed.
Let's just expand this and you can see that this test has been consistently failing, which is expected since we created this COVID tracker test to fail on purpose.
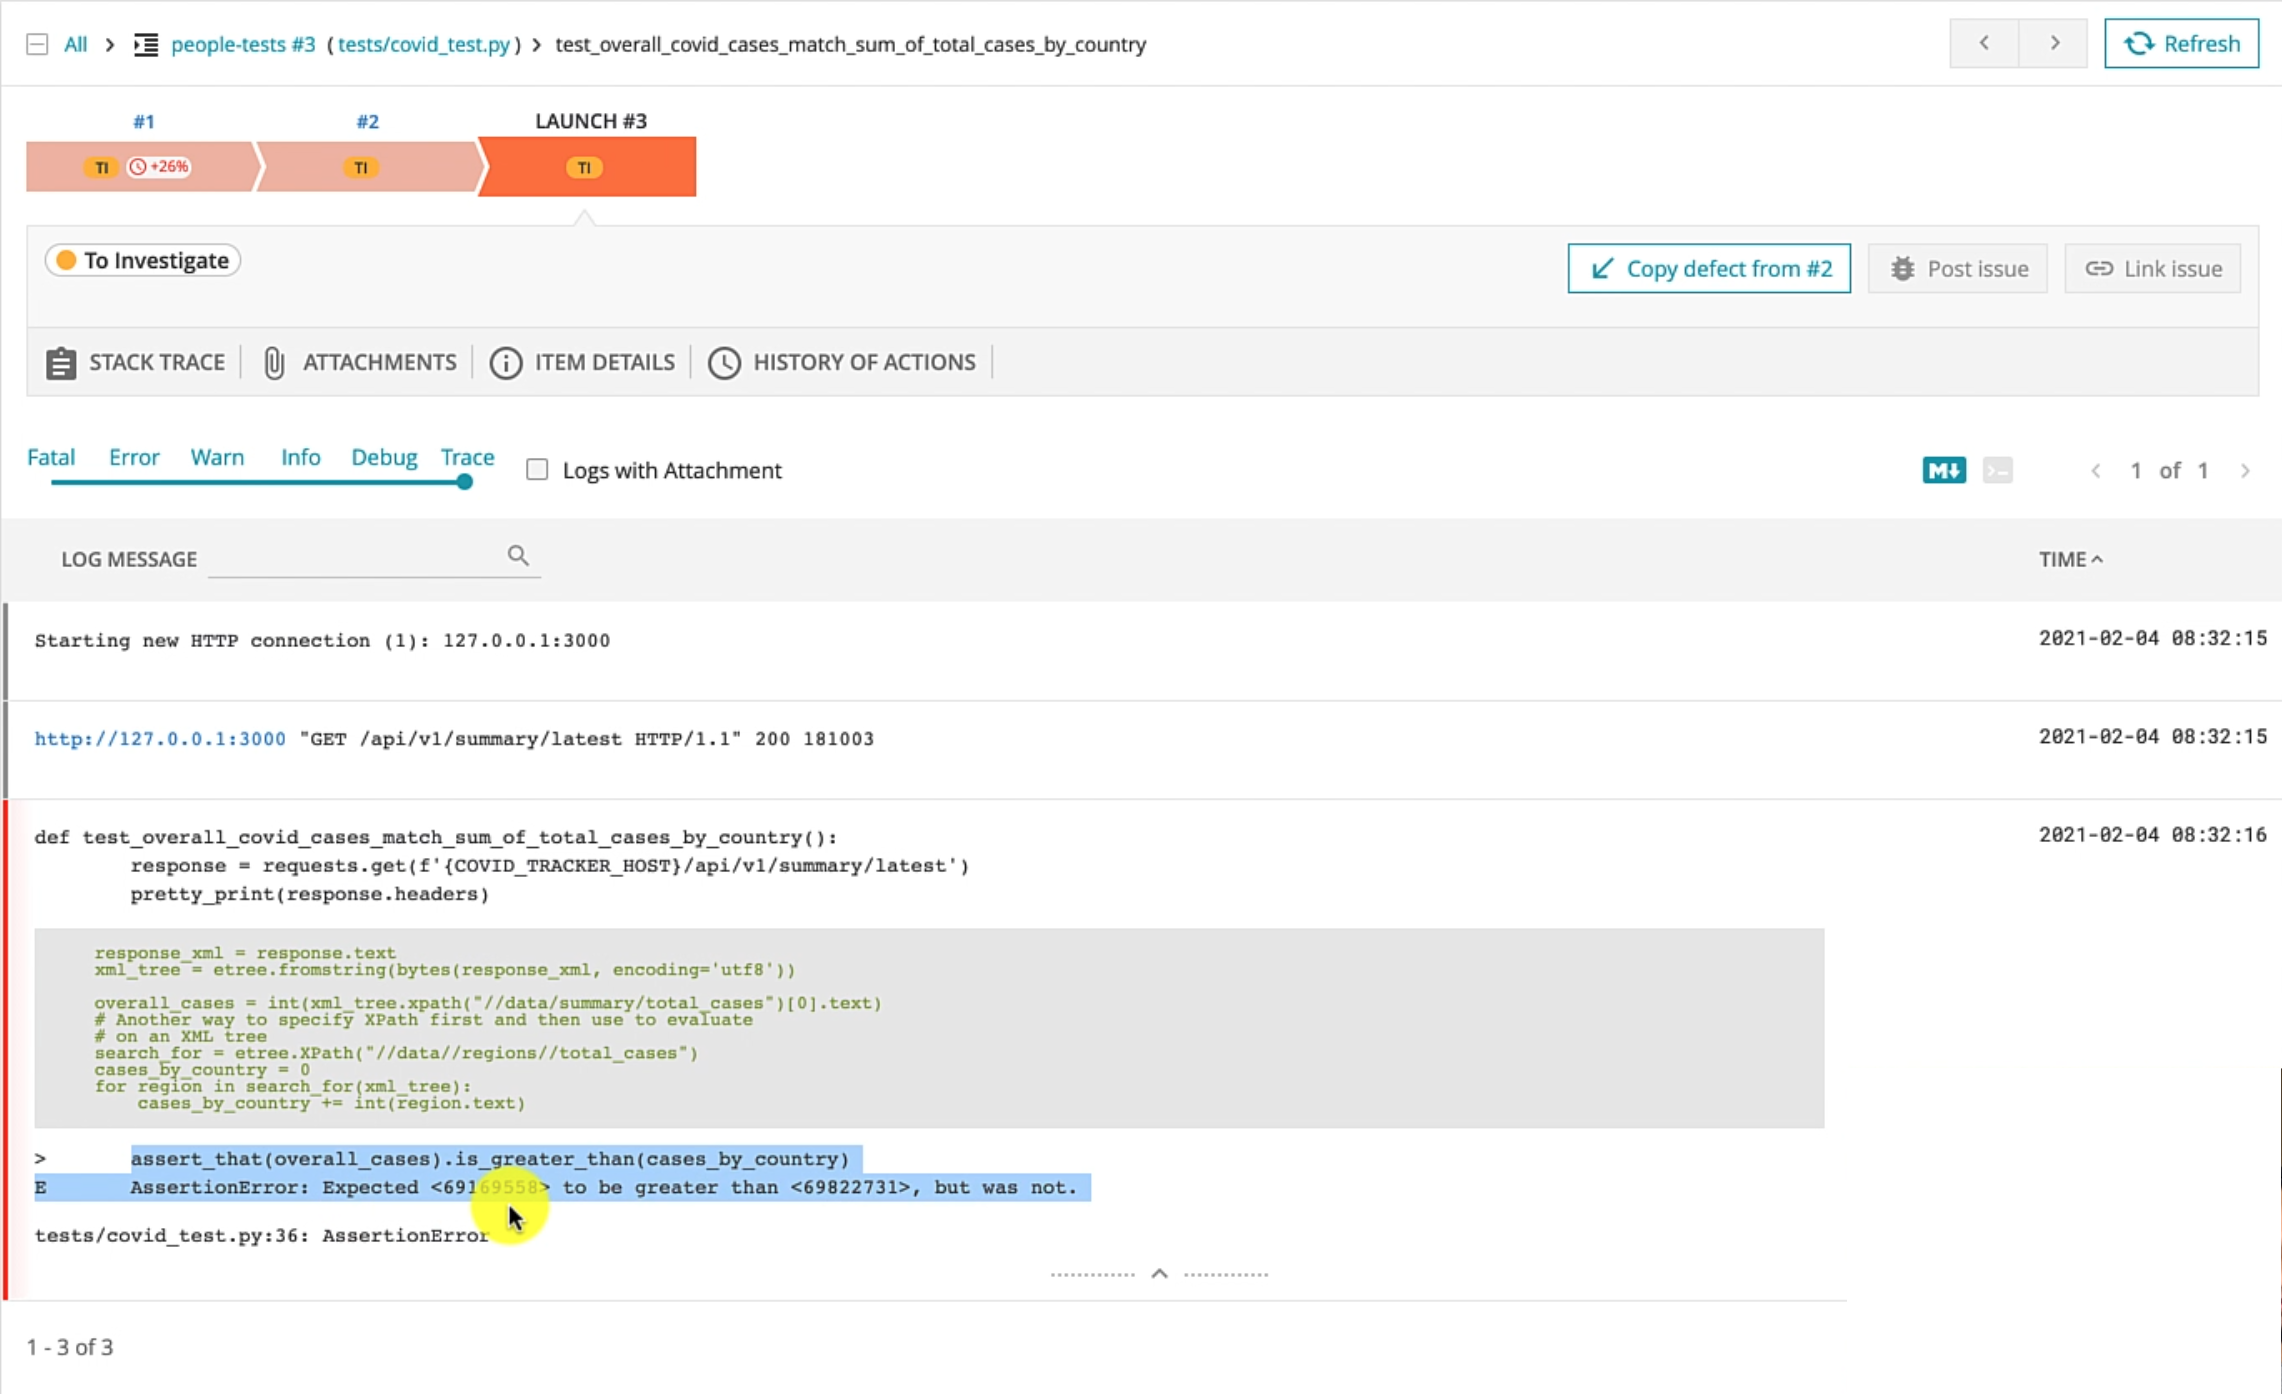
When the test fails, you can see it also has the Pytest specific logs on how it failed and you can take a look at the actual assertion that failed.
You can, alternatively, even just expand the stack trace and only see the exact error stack trace, if you are not interested in the entire log.
Another neat feature that ReportPortal supports is analysis on a particular test.
Let me just show you what that means.
Assume that you had multiple failed test cases and you're going through and doing your analysis on whether these are actual bugs in the system or automation failures.
You can go ahead and give a particular state to this particular test.
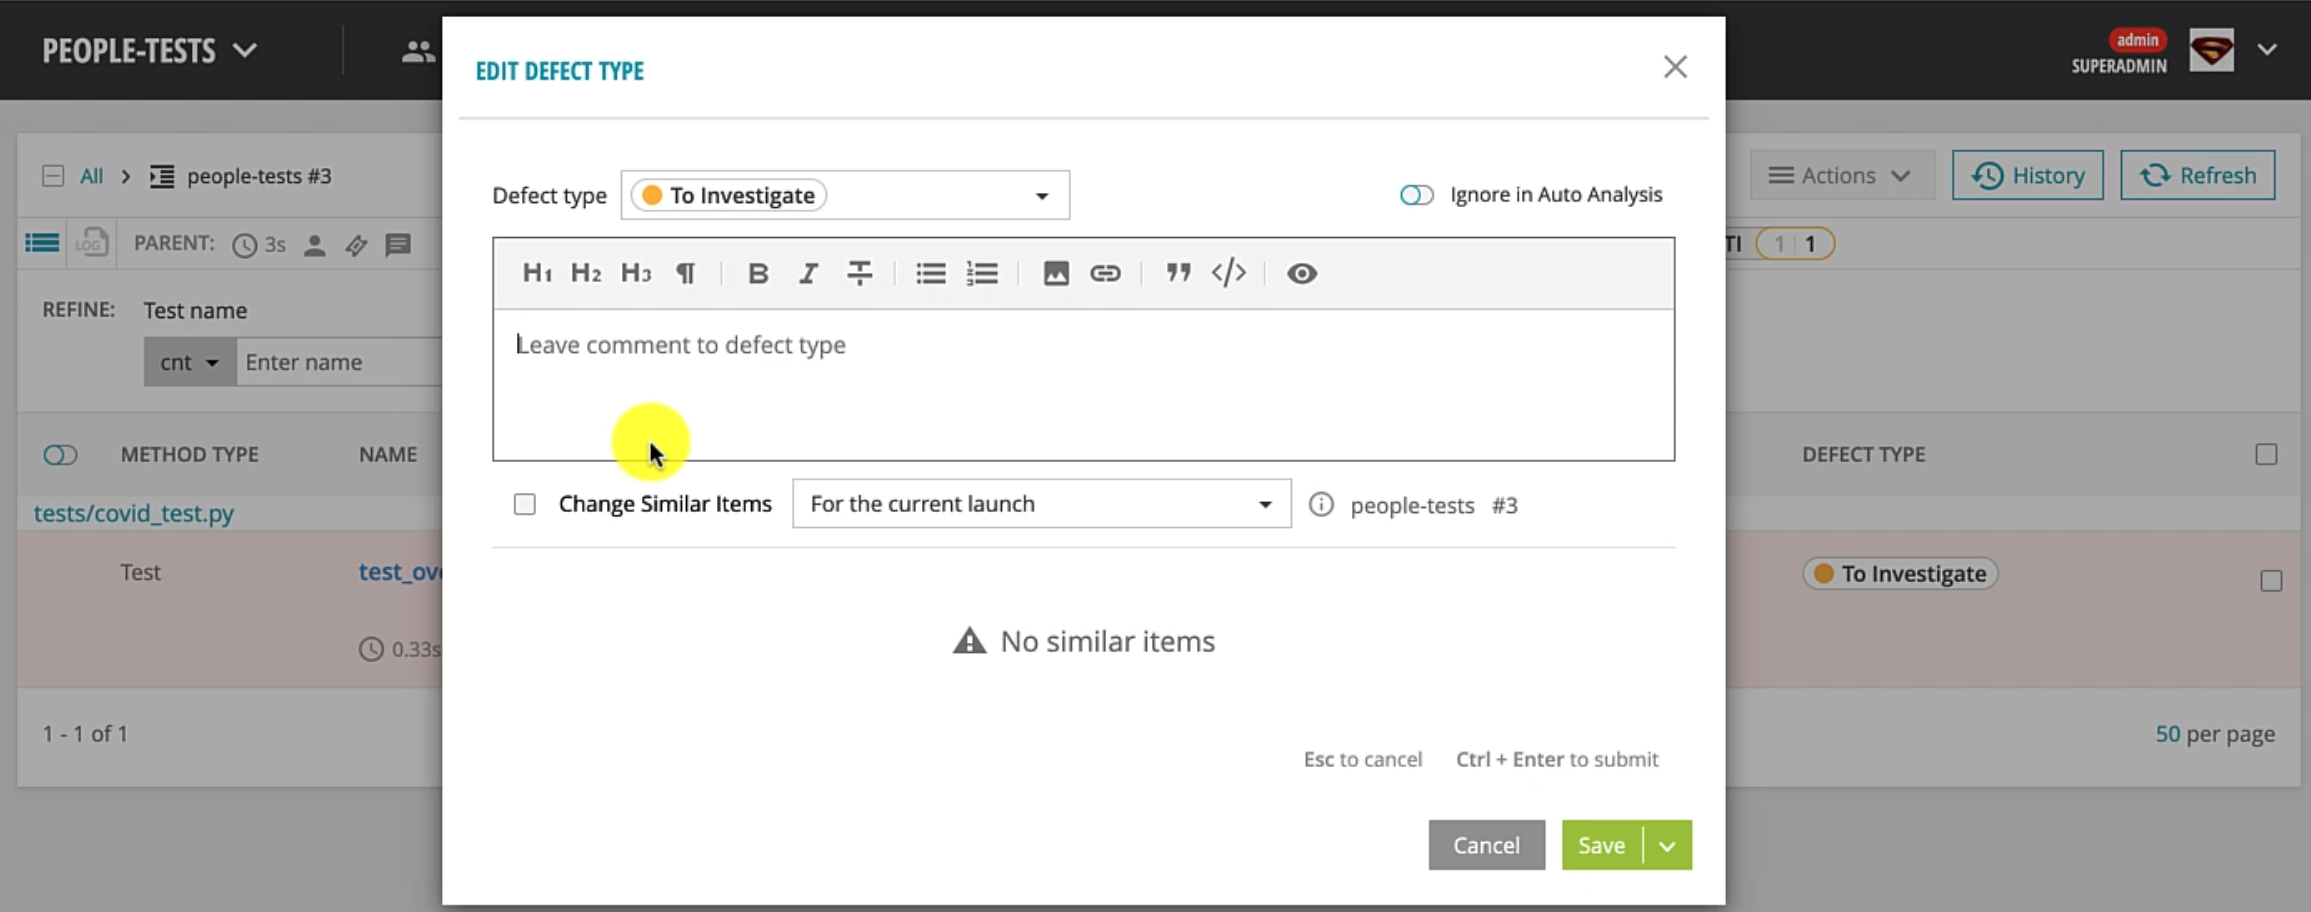
You can specify whether this test was failing due to a product bug or it was an automation problem or an environment problem for that method and update these comments.
Let's just say that this is an actual product bug - "The count should not really be less" - and save this.
What you'll observe is the status now changed, and you have overall statistics on how many cases are actually product bugs for this specific launch, as well as comments.
ReportPortal has a much more rich set of integrations with your defect tracking system, so you could potentially even just create a bug right from ReportPortal.
That's it for this chapter, and as you can see, ReportPortal is a very nice reporting solution that you can integrate and gives you lots of rich features for very little effort.
The community that supports ReportPortal is really wonderful and they respond quite quickly on the Slack channel, in case you have any issues.
I would encourage you to check them out, understand how it works and how you can make use of this open source software for your own projects and framework needs.
That's it for this chapter and I really look forward to seeing you in the final chapter in this tutorial series.
Resources
ReportPortal integration with pytest and pytest markers - Qxf2 BLOG
reportportal/agent-python-pytest: Framework integration with PyTest
Python API test automation framework (Part 8) Adding reporting with ReportPortal
