

Transcripted Summary
Throughout this tutorial series we have seen how to code visual assertions into our web-based Selenium automation framework and seen some actions that can be done in the Applitools Test Manager website.
However, the Applitools Eyes Test Manager is much more feature rich and makes it really easy to work with our visual test results.
Let's go over some of the features present to give you an idea on how to extract maximum benefit from it.
Let's start at their different views available to you as a user.
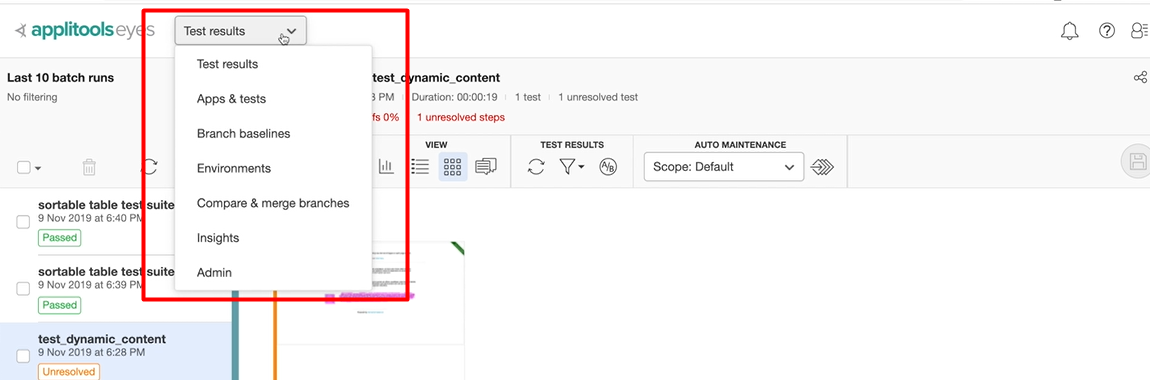
The default selected view is Test Results.
In this view we can see all the test batches on the left-hand side. We can select them individually and remove them if you don't care about the results. Or we can select all the results and remove them in case they are no longer meaningful to us.
There is a refresh button. You'll get the latest results for any new runs that might have happened.
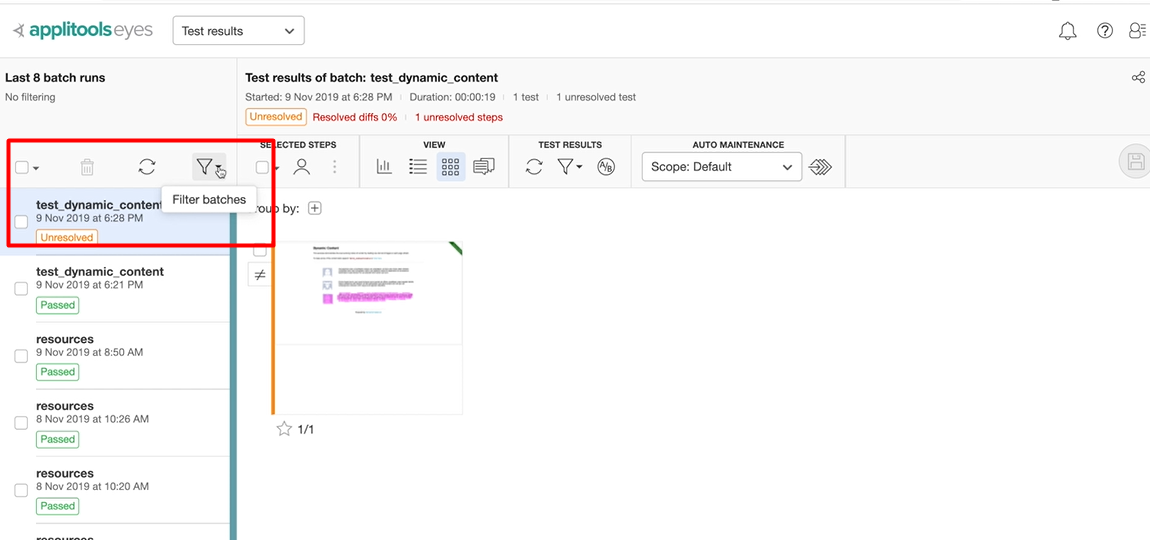
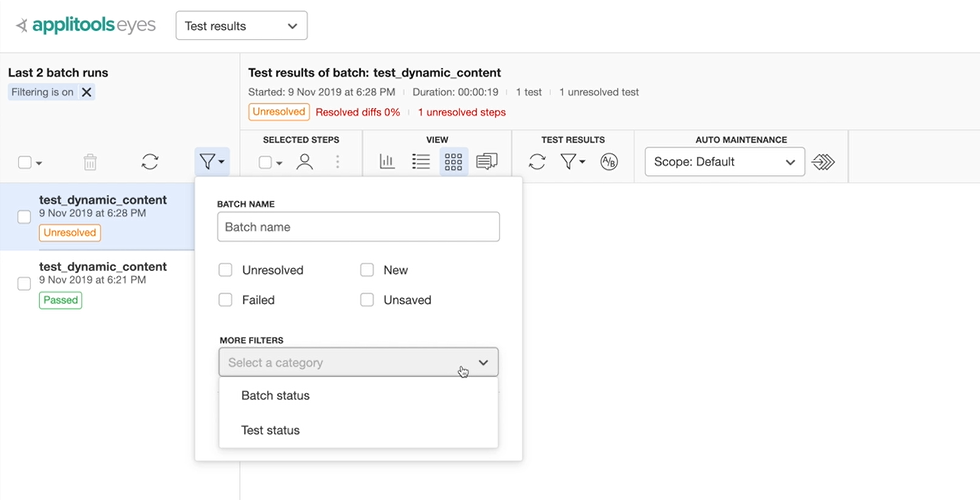
We also have a rich filter control to filter reserves based on either the batch name, or the different statuses in which a batch can be.
This control accepts either a full name or a partial text pattern.
We can also filter based on the status of the overall batch or the test status.
The next view available to you as a user is Apps and Tests.
Here we can see all the apps that have been tested by us.
Again, we can either select them and delete them, or use the filter control to see only the apps that we want to see.
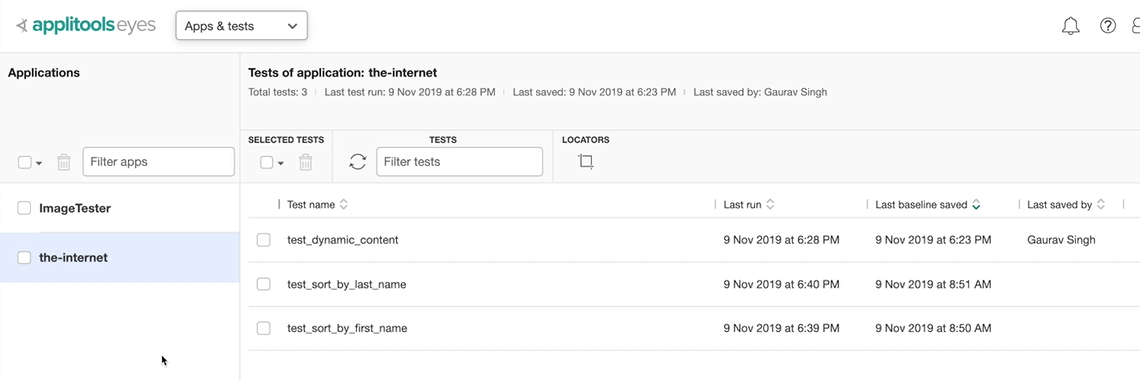
We can also see additional details about every test inside an app.
For instance, let's say I'm interested in seeing all the tests for the-internet app.
I can select these test results and delete them. Reload the latest results from any barriers that might be running at this point of time. Filter it, or even see additional details about each test.
There are a bunch of options available to us.
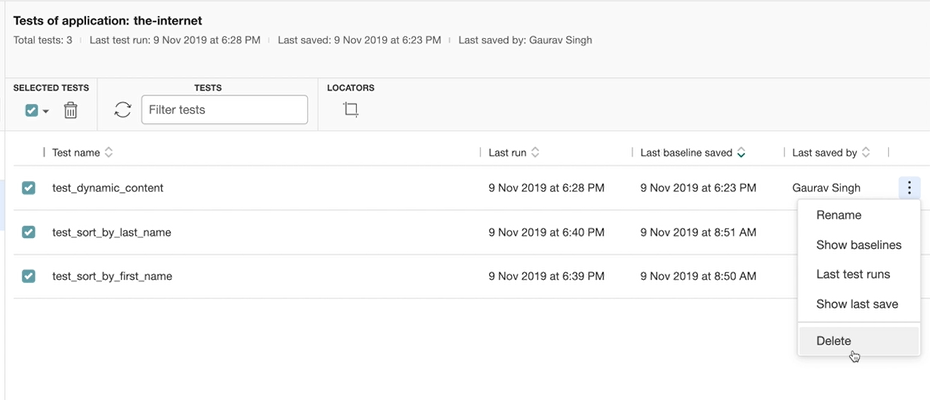
We can either rename, show the baseline, show last test runs, show the last save and delete them if you want.
We can also see all the capture baselines in the Branch Baseline feature.
Another option in Applitools test manager is the Environment tab.
Here we can see what environment combinations such as browser, operating system or viewport our tests have run against.
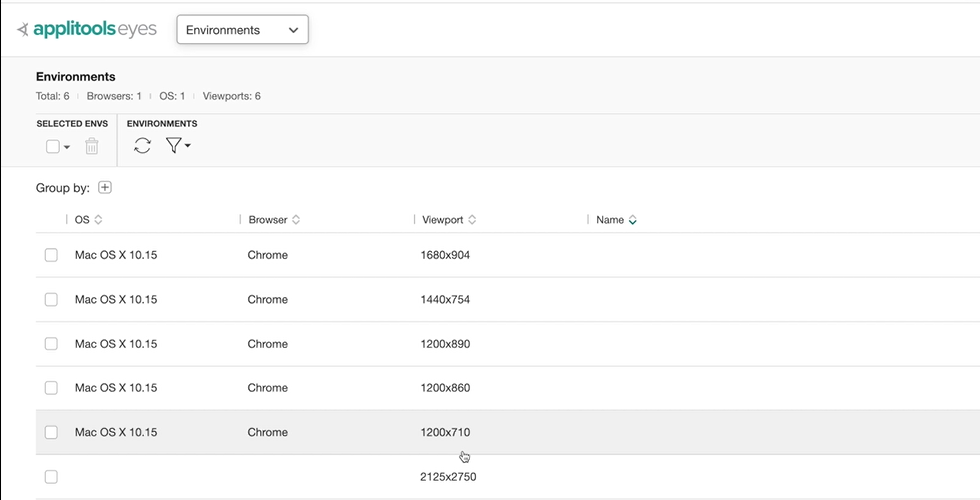
Either select the environments remove the ones that we don't care about, reload any new environments that might be coming in and use the filter control to see exactly the data that we want to see.
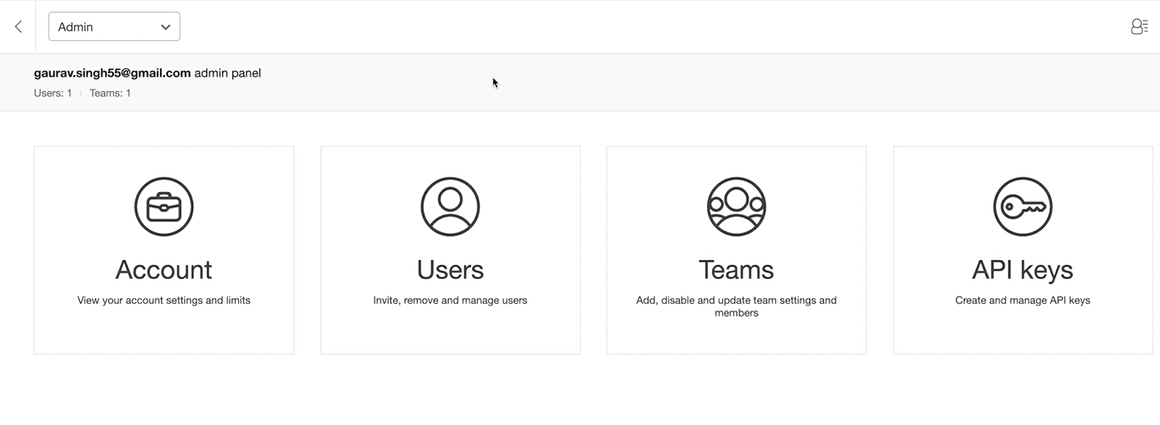
We also have additional options such as Comparing and Merging branches, deriving Insights from our tests and the Admin tab.
The Admin tab gives us a bunch of options to manage our account, the users, certain teams that we want to organize and the API keys for users as well as teams.
Let's go back to the Test Results section.
This is the area where you may spend maximum time in viewing the test results and analyzing any failures that might have occurred.
Let's explore the features available in this section in detail.
For any given batch at the top you can see details about the test batch runs such as when it was started, how long it took, and how many cases were run and passed.
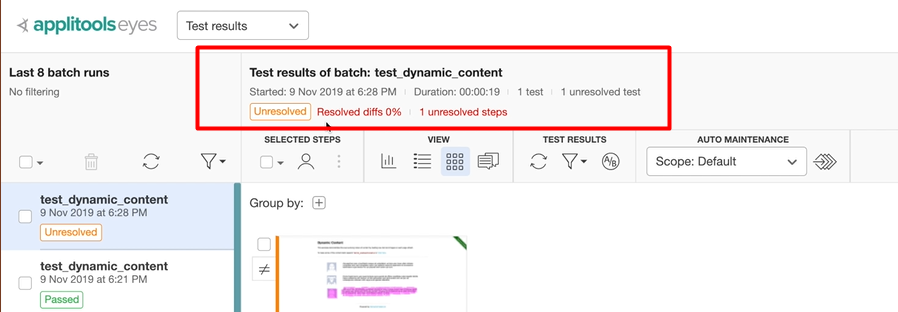
This can help you focus even more on certain areas that you might want to investigate further on.
We have a rich toolbar with varying options.
Here you can see all the tests that are part of this particular batch, assign them to a person in your team.
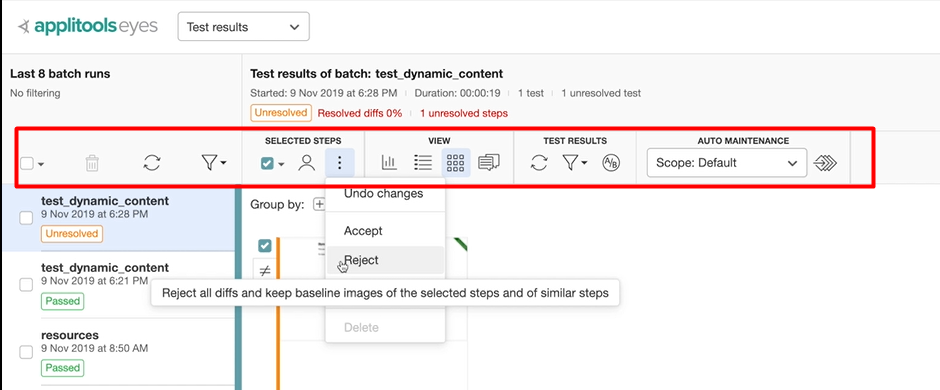
Let's say your application went through a redesign and you want to accept the new screenshots as the new baselines.
You don't need to do it individually one at a time. You can select all of them and accept them in one shot.
By default, we can see the results in the Batch details view.
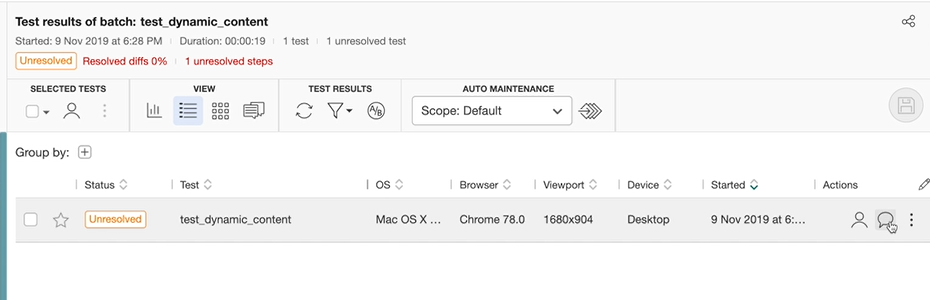
This gives us the details about the test, the operating system it was run against, browser viewport combination, when it was run against, what is the current status of the test and take actions such as assigning them to a person in their team, or even issue a comment against this particular test.
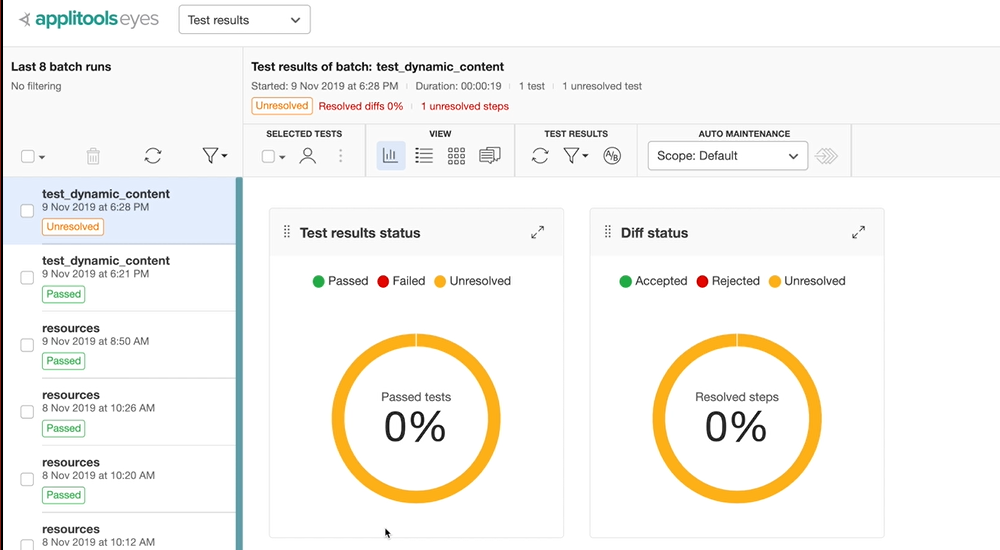
There are other views available to us such as the Batch Summary view, which shows a graphical display of the summary of results.
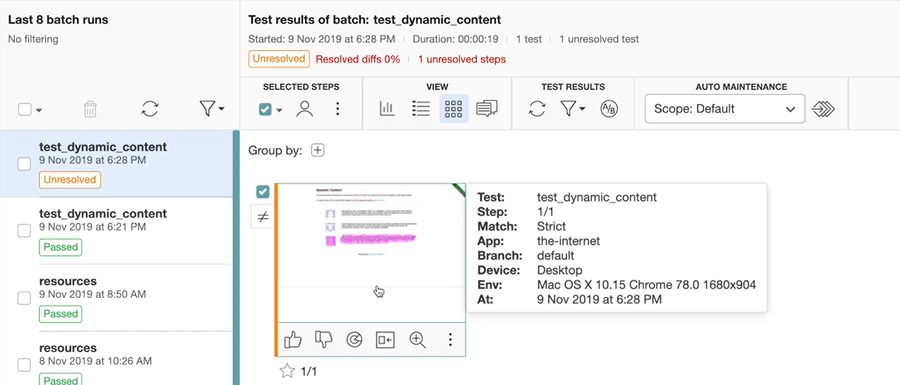
Also, we have the Visual steps view which shows us the screenshot of each individual test, which is part of the particular batch.
There is a dedicated Issues & remarks view wherein we can see any issues or comments that we have made against a particular test result.
Now let's see how we can work with captured baselines and checkpoints and their different options we have available to tackle differences.
If you open a test, we see a rich menu with varying options.
We can choose if you want to see both the baseline and the checkpoint images side by side, or individually.
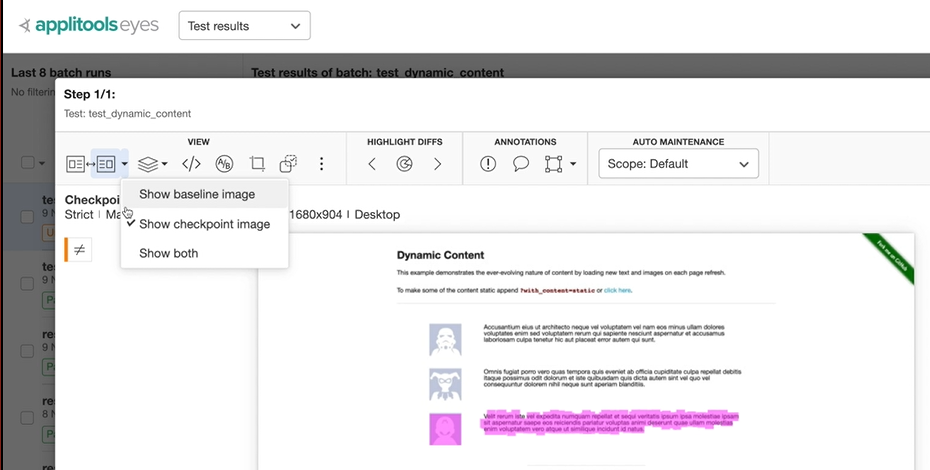
We can also choose to show both baseline and check points side by side (this is what we have done during the other chapters).
This is the view that adds maximum value and gives you a very quick view into what went wrong.
For any given image on this screen you can always resize it to the original size, or zoom in, or zoom out.
Next up we have a select Visible Layers control, which allows us to select only the information that we care about.
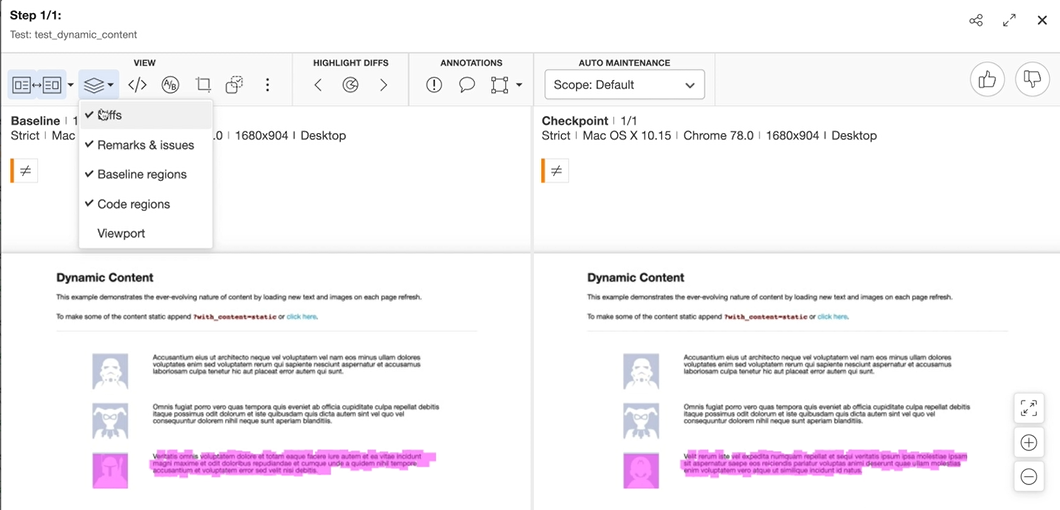
We can ignore any diffs that it found, remove any remarks and issues, remove baseline regions, code regions or the viewport.
There are very powerful root cause analysis features built into Applitools, which can tell us the exact element and the difference between captured baseline and checkpoint.
This feature could be very useful to pinpoint the exact issue to a developer.
Let's take a look now.
On the screen we have a website where the captured baseline and the checkpoint differs by an image and certain text.On every refresh of the page only these 2 component changes.
Let's say we want to pinpoint the exact problem to a developer.
We can go and click on the Root cause analysis tool.
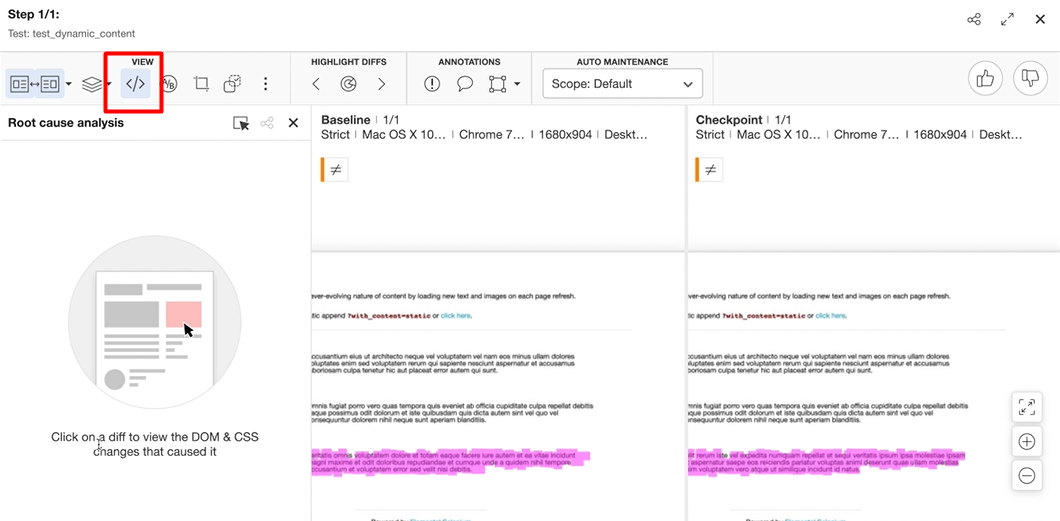
Here it asks to click on their diff to view the DOM and CSS changes that caused it.
Let's say we are interested in this image on the left.
As you can see there is a difference between the original captured URL of the image and the one captured by our checkpoint.
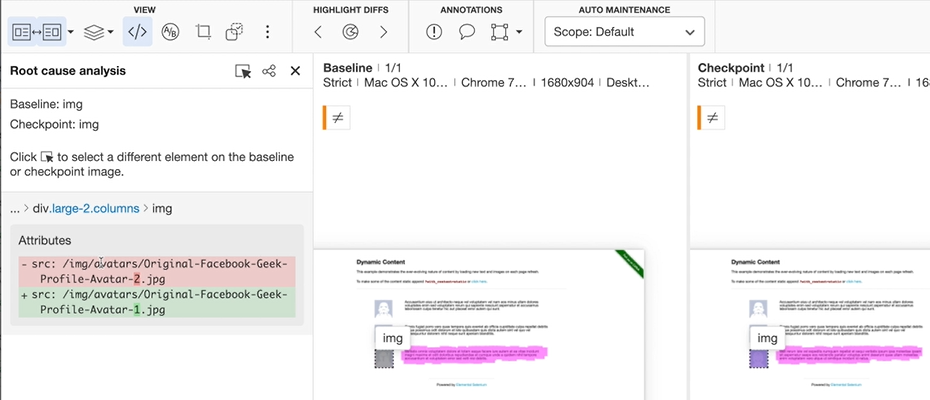
This is great information and we can directly tell this to a developer and save them a lot of analysis time.
Applitools Test Manager makes it really easy for you to decide what assertions you want.
For instance, for the current application that we have, we can see the current match level used is Strict, which is by default.
However, you can select view, go to preview match level and select a different type of match level to apply onto the current baseline and checkpoint and see what the behavior would be.
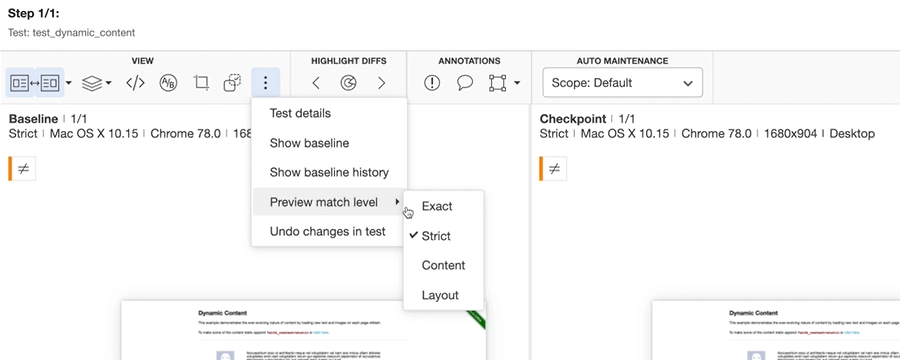
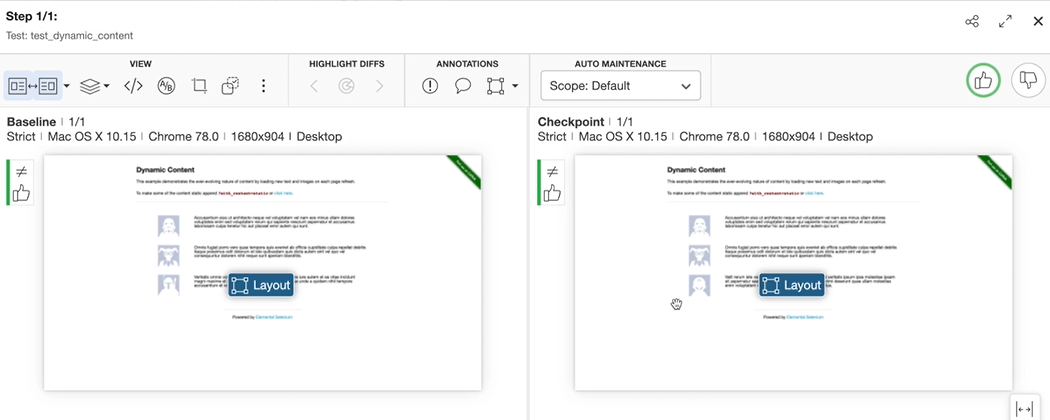
Let's say in this current case we are only interested in the layout of the page and want to see what a layout match level would look like.
We can select that and now you can see that Applitools is analyzing the page as a layout match level and that there is no difference between the baseline and the checkpoint.
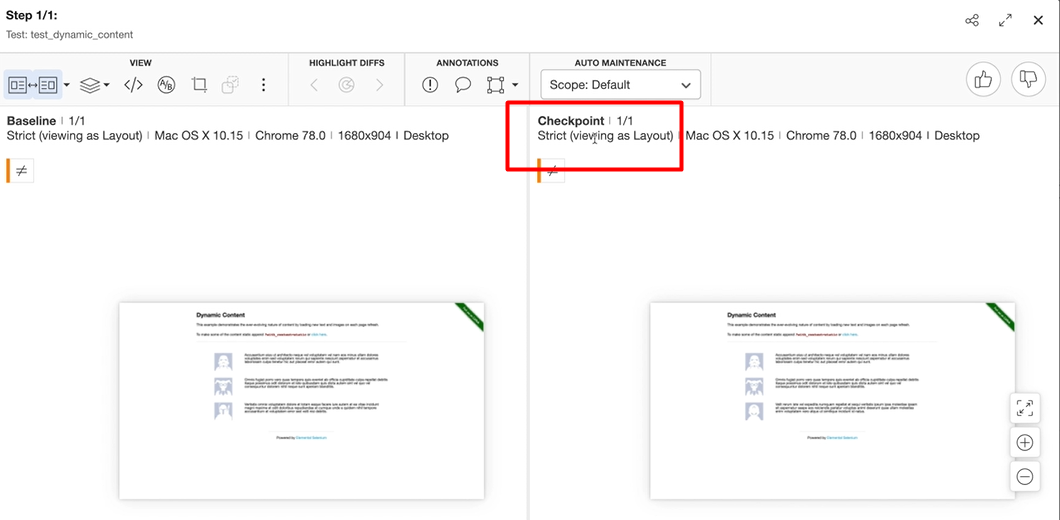
One thing to note is this is not actually changing the assertion in code and it's just meant to give you a hint on what could be certain other match levels you can use for different scenarios in your application.
Let's change it back to Strict.
Next up we have a very useful HIGHLIGHT DIFFS wherein we can tap here and Applitools will show us visually what are the differences between the baseline and the checkpoint image.
We can also go through each of the diffs one by one and as shown earlier, use the Root cause analysis to identify the failure points.
Applitools Test Manager provides us a bunch of powerful ANNOTATIONS, which can be used to update the baseline as per our need.
For instance, in the current example we see that the 3rd section, changes dynamically. Using Applitools visual annotations, we can choose to let Applitools know that we are only interested in verifying the layout of this section.
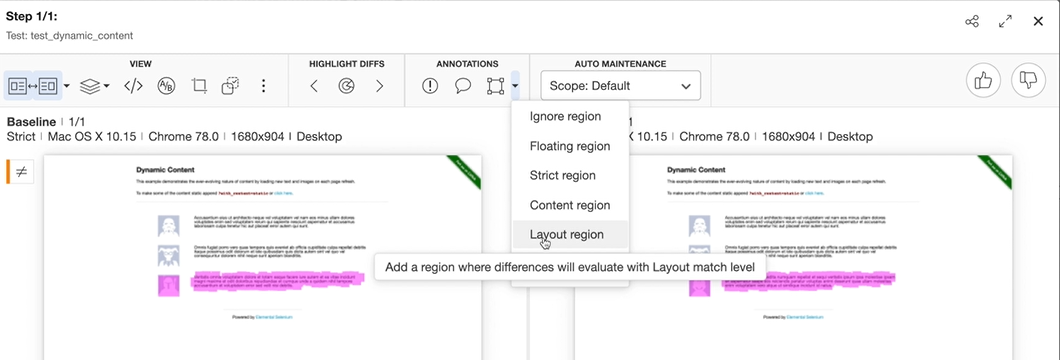
Using visual annotation, we can let Applitools know whether we want to ignore this particular region or use a different match level.
So, in this particular case, let's say we are only interested in the layout of the region, we can select the region on the app and tell Applitools that for this particular region we want to only use layout match level.
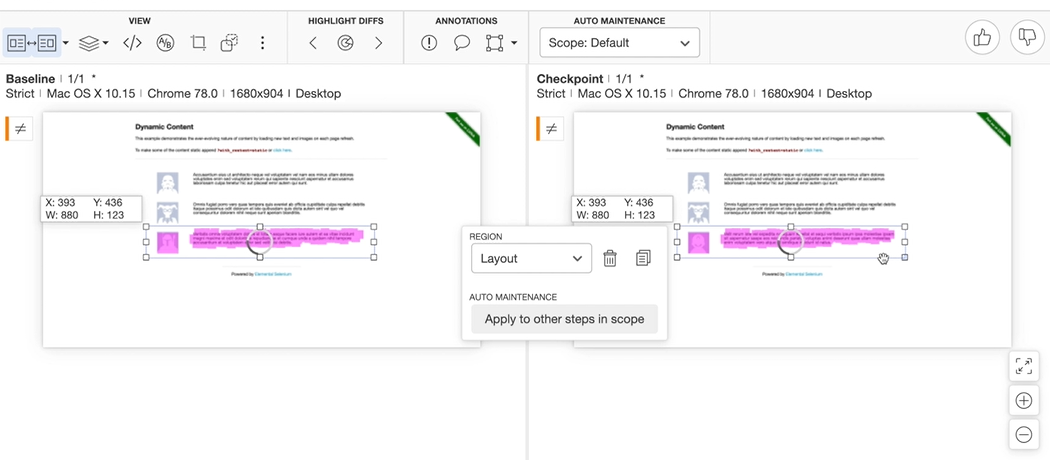
We can save the change and save this as a new baseline.
Let's select the test again.
You can see that Applitools smartly knows that it has to only use layout match level for this particular region.
If we were to run this test again, we would not be checking against the image and the text for third third control on the screen.
