

Transcripted Summary
In this video tutorial, I want to talk to you about the Test Manager, all of the different capabilities and also discuss the batches.
So, what you see over here is the test manager.
In here you see a collection of all of the tests that have been executed.
On the left-hand side, you see a Batch pane. Previous to this, you had no concept of batches.
What you actually saw was a single test being executed one at a time. However, at some point you might want to get more advanced and execute a suite of automated tests. That's where batches come in handy, because now what you can do is execute multiple tests at the same time and place them into a single batch.
I was able to provide a batch name and you can see I gave it “UltimateQADifferentResolutions”.
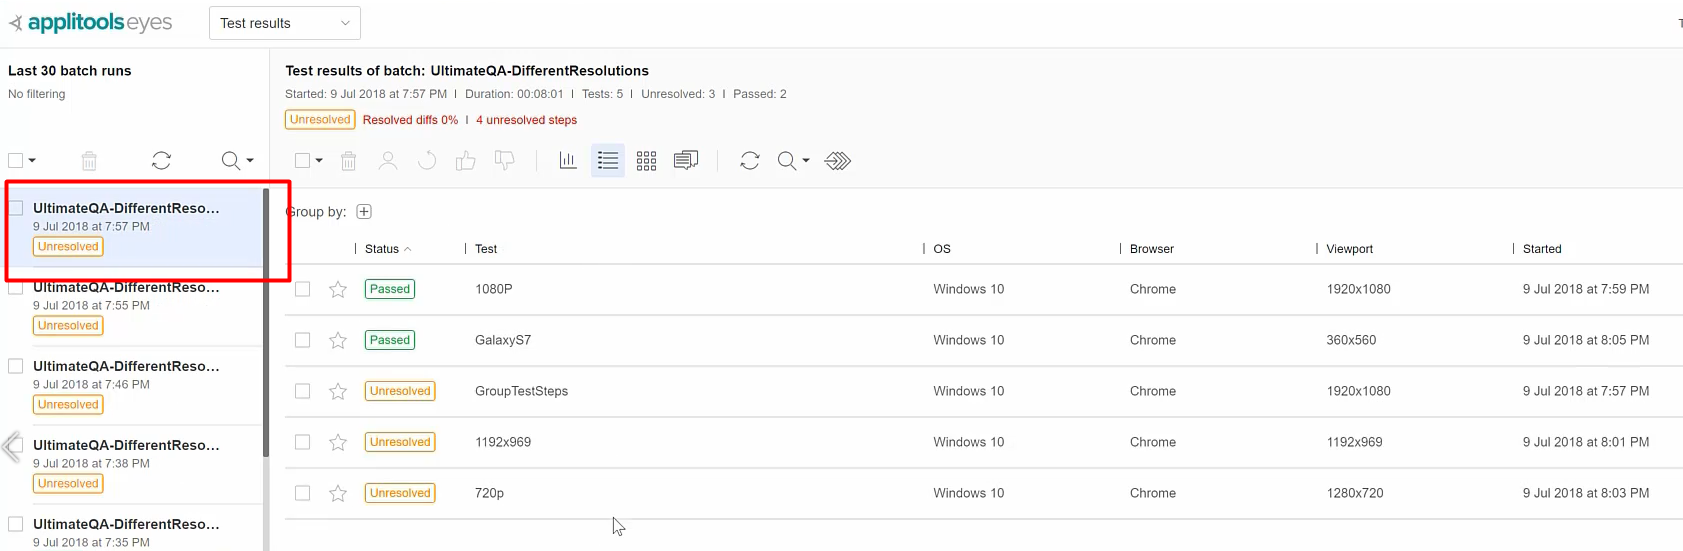
Inside of here you can see the date and when it was executed. But also, you can see how many tests are unresolved and how many passed. And you can actually expand this to see more and 2 tests passed.
The batch is highlighted right here. When I click it, it shows me everything that's happened and you can see all of the tasks that I executed one by one, but also, they're inside of a batch similar to like a test suite. So, this was my Ultimate QA homepage being tested on different resolutions.
There is also the concept of a batch summary view that you can see right here.
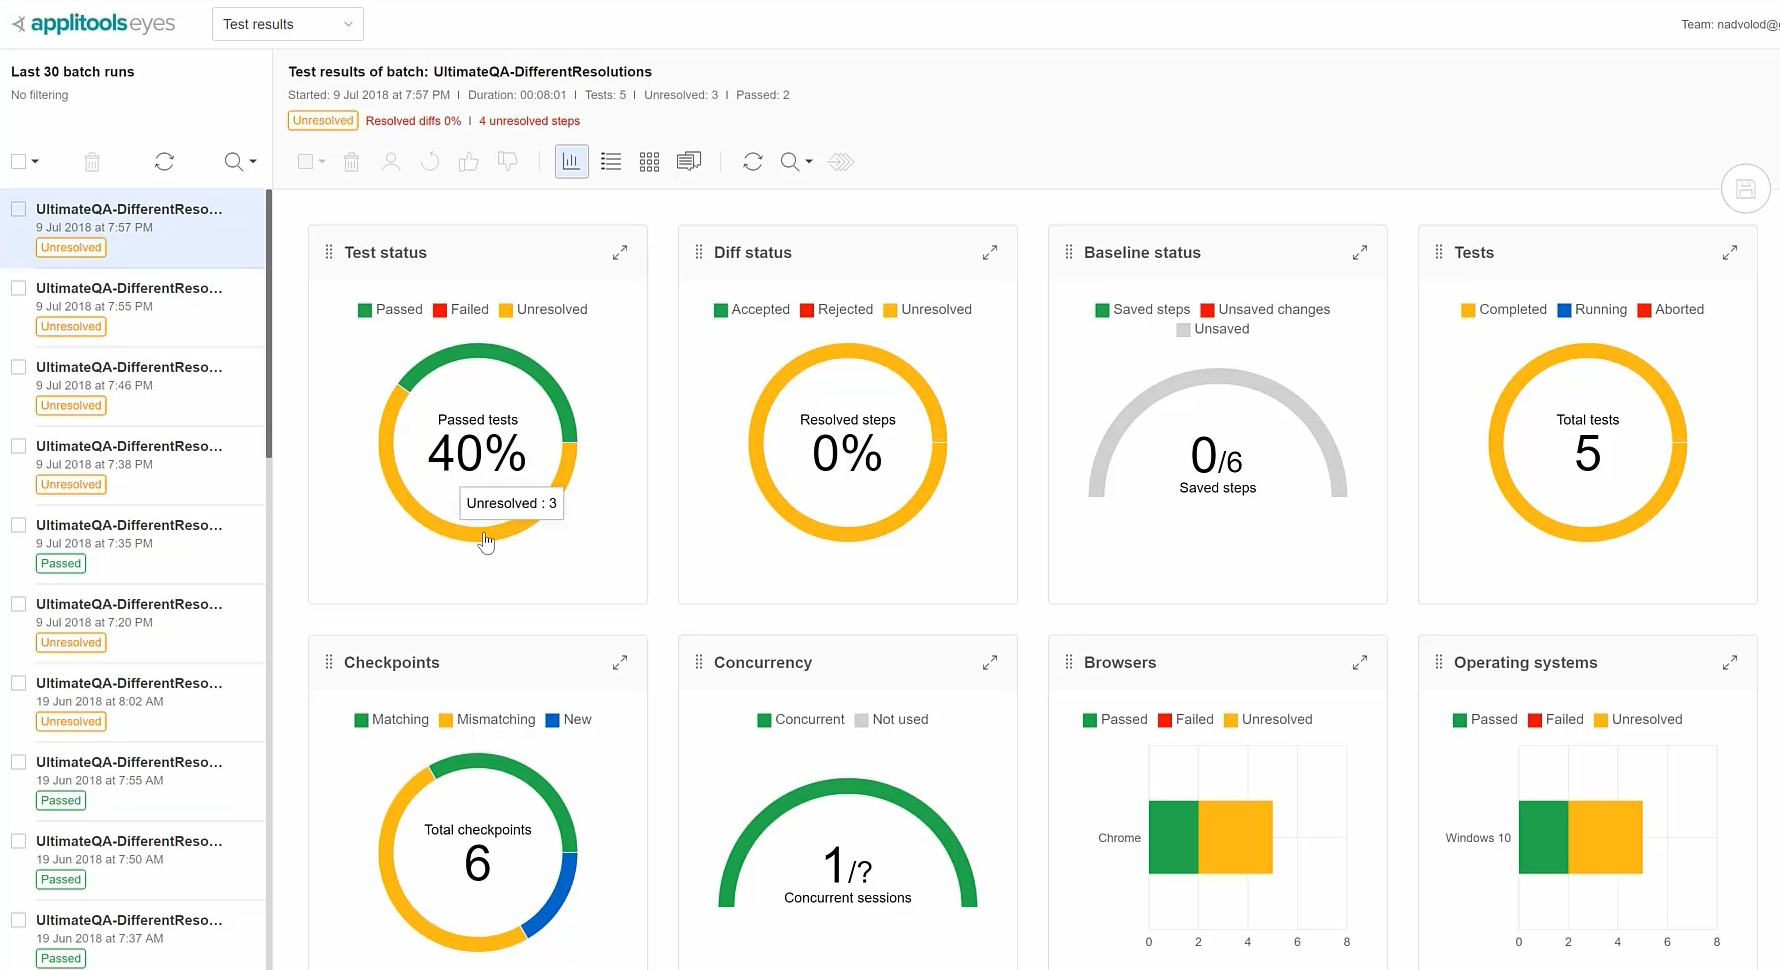
The batch summary view basically allows you to see the statistics for this batch.
You can see there's a test result, there's the diff status. In this case, I had a 40% pass rate and a 60% unresolved rate, so I've got to get in and see why these tests are unresolved.
And then you can see all of the different kinds of other metrics. You can see the browsers, operating systems, whether there are any issues and remarks and any test assignment. Then, you can see the different kinds of view ports that were executed here.
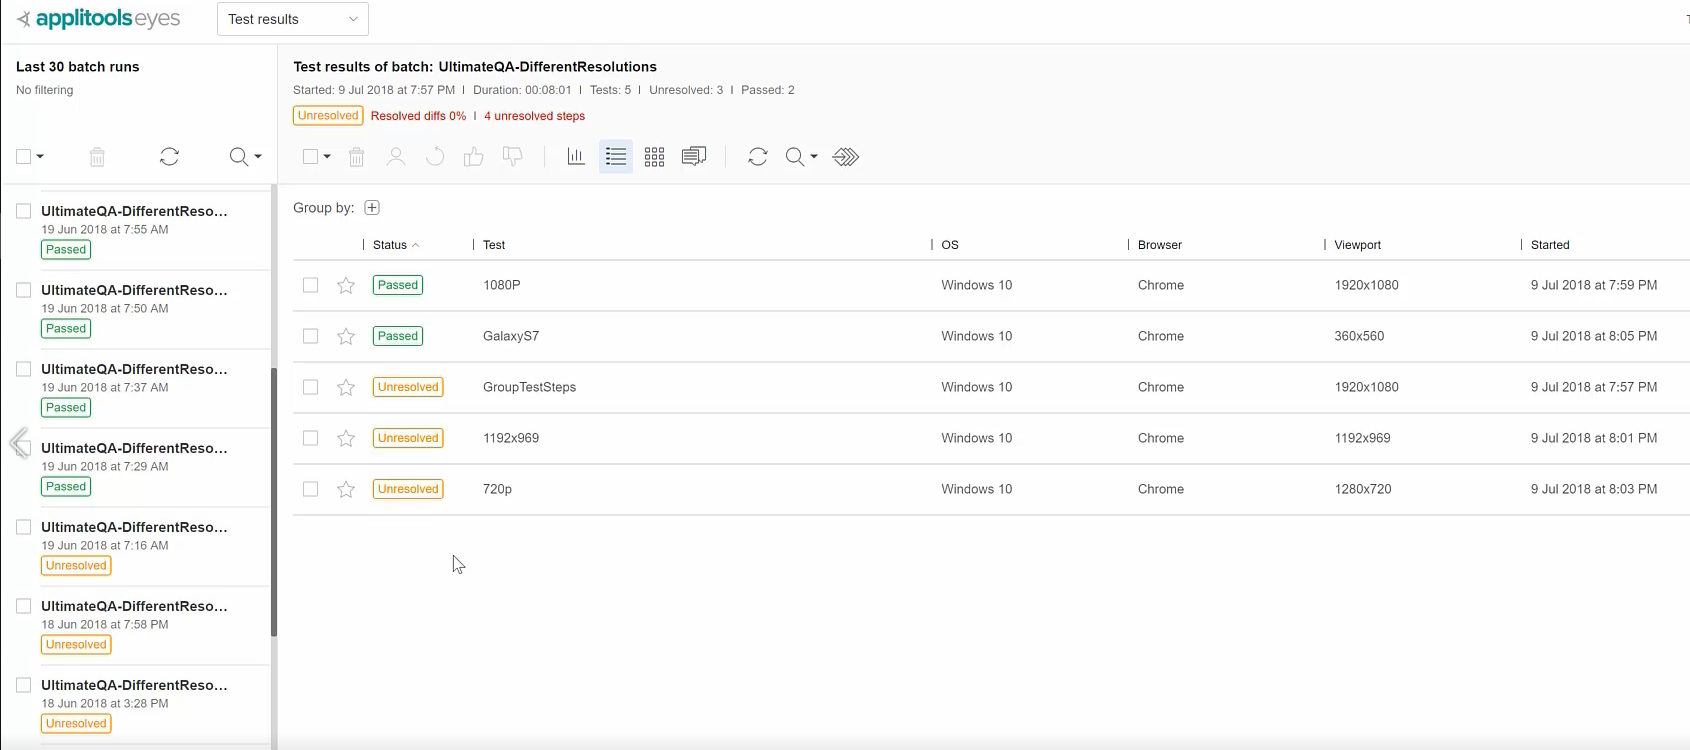
There's this other view, the batch details view, which you can see you've already seen here.
It shows you one test executed at a time. You can actually click on it and it will expand out to give you a little preview of what happens.
So, in this case it's passed, so you can see there's a little equal sign that says it was a match and everything is okay.
You can expand the ones that didn't pass, and you can see that it gives you a preview of what might have failed.
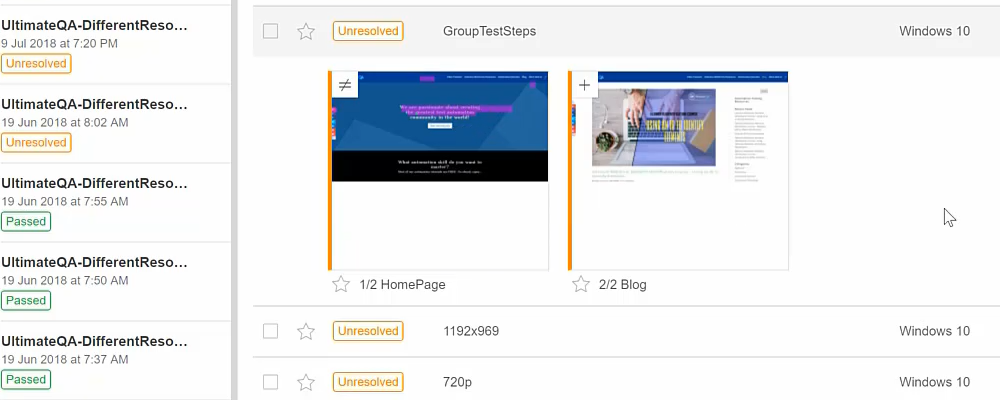
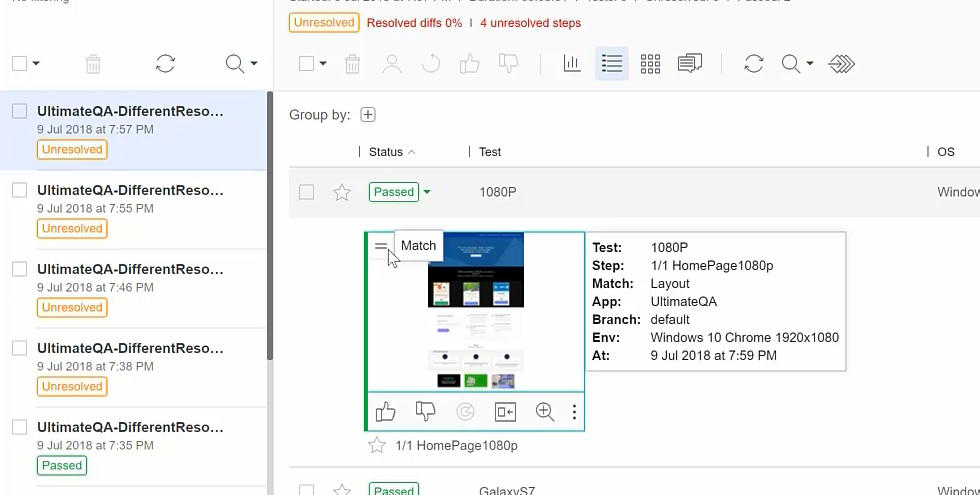
And this one as well. And this one has a preview and you can actually, if you want, you can open it in the Step Editor.
You can show the baseline image so you can toggle like this, versus different images, okay? You can highlight the diff locations and you can give it a thumbs up or thumbs down from here and then actually save it from here.
So, for example, if I give this a thumbs down, now this has been rejected and so later I just need to save it, but I don't want to give it a thumbs down, so I'm not going to save it.
Same thing with these other ones. You can see. Shows you the Difs.
Note about Preview Mode
Now one thing to keep in mind, this is actually a preview mode and Applitools uses a little bit of a different algorithm. Here, it's not the full Applitools comparison algorithm that's used here. So, what you see here might actually be different when you open it in Step Editor, so just keep that in mind. This is like a preview and then the full algorithm gets applied whenever you open it in the Step Editor.
Oh, by the way, something other very important here is you can actually group your tests.
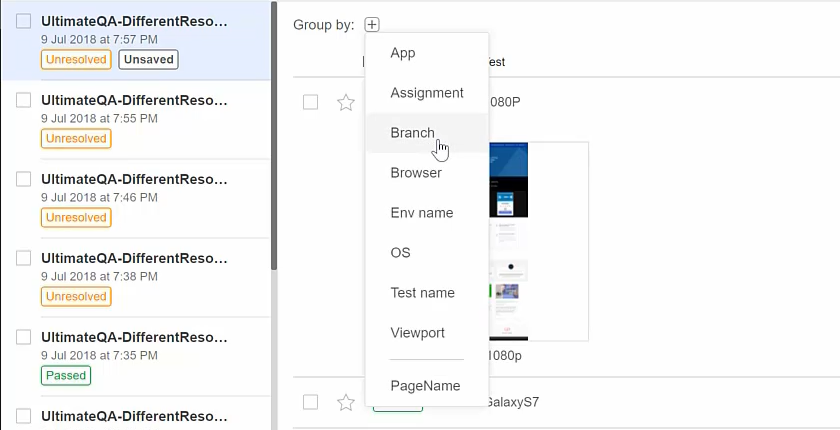
So later, I'll show you how you can apply properties to your test cases, but automatically Applitools detects stuff like the application, the branch, the environment name and so on. And so, based on that, you can actually group your tests.
For example, if you want to group it by operating system.
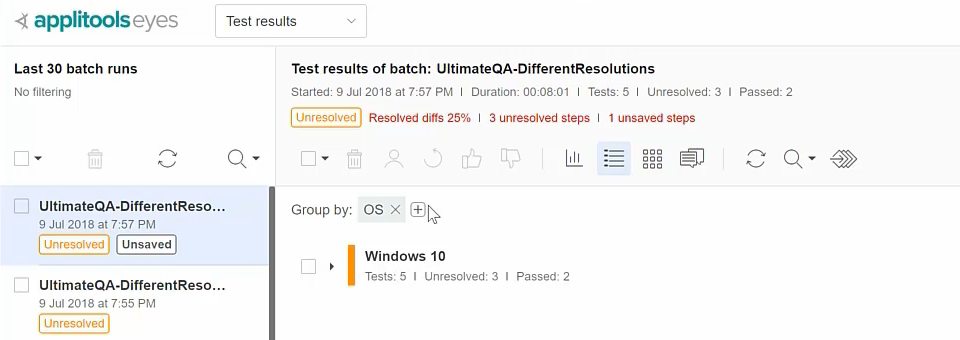
Now everything is grouped by Windows 10 operating system because that's where I ran it.
I can also group by the viewport size.
So, now you can see that under Windows 10 I have several different view port sizes and each one I only have a single test, but in this one I have two tests in our 1920 x 1080 resolution.
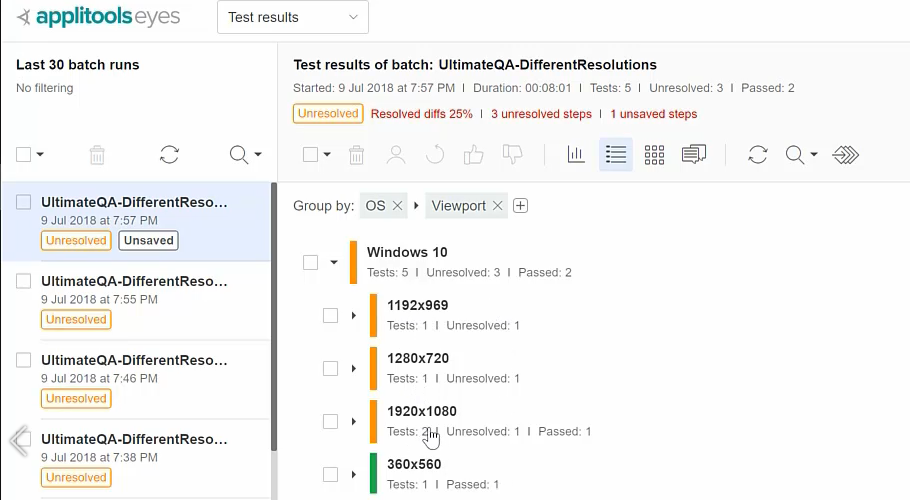
You can see I have 2 tests in here if I want it to look at them like that.
So, you can continue to drill down if you want, by the environment name, which I actually had never set. I don't think any of these will have all the, yeah, see exactly. So not applicable because I don't have an environment named set up. I can remove it. And so now everything just looks as before.
This is a very nice way to drill down if you know you have a huge batch.
I'll tell you, at one of my previous workplaces, we ran about anywhere between 3,000 to 9,000 visual validations every 2 weeks. And so those batches can look kind of big. We didn't have all 3,000 to 9,000 in a single batch, but there could be like over 1,000 visual validations in a single batch.
And so, you might want to filter them down based on some specific criteria and so that's what we did using these “group bys”.
Okay.
Then there's this other view: batch set view.
Batch set view is really nice if you want to see all the images at the same time and see all the differences from here.
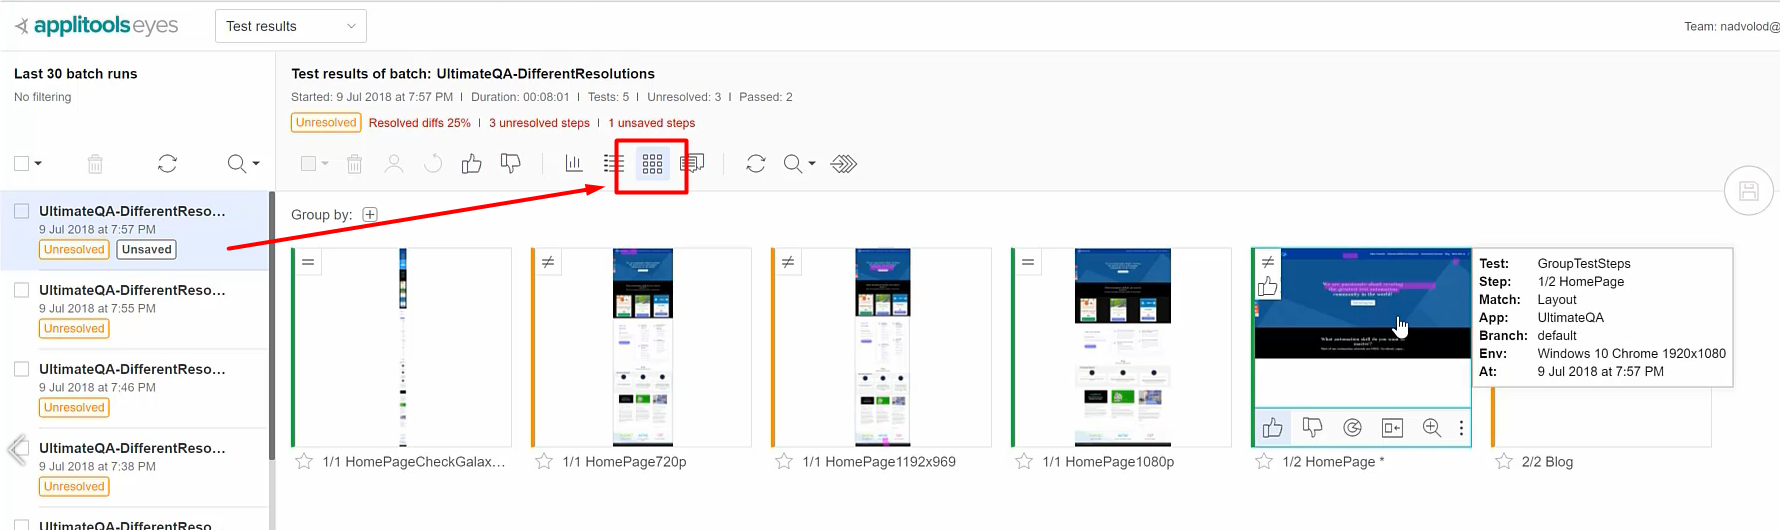
Imagine in that scenario where we ran between 3,000 to 9,000 visual validations and we opened up a batch and there was about a thousand different visual validations. We like to open it up and look at it from here.
A lot of times what you might see is some common failures and so like something like this you might be like, oh, okay, that's actually totally okay, so I'm just going to go ahead and give this a thumbs up because I know that's changed based on the new requirements. I'm just going to give it a thumbs up from here. Thumbs up from here, you know, and then you can click save in order to save the changes.
It's very quick and easy to view from here.
You can also even “star” these, so that you can remember to come back to them in the future and then you'll be able to filter based on the starred ones.
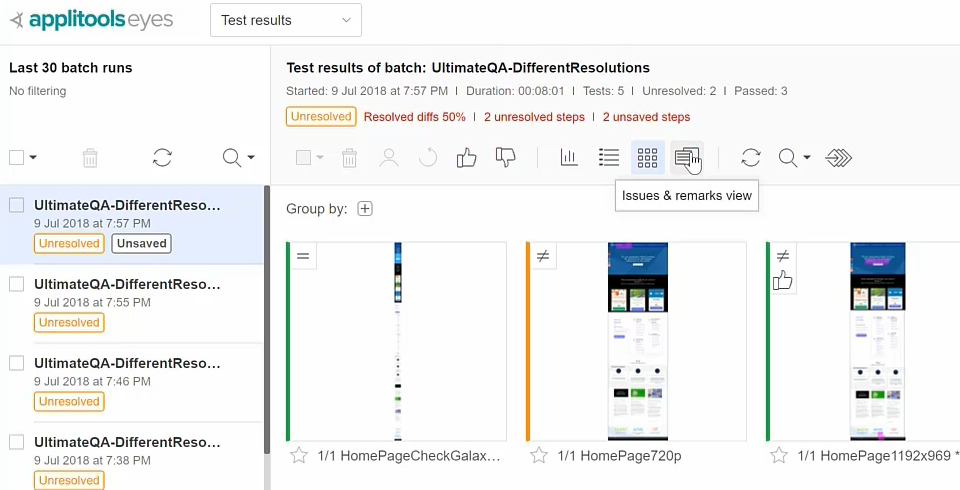
Then there's also issues and remarks view, which is not going to have anything right now because we don't have any issues and remarks, but later we'll make issues and remarks and you'll be able to see it.
Then there's just here reloading; and you can also search based on the different filters.
So, for example, if I starred one of these, you can search and you can look, where's my starred ones? See now it's showing you only the starred ones.
You can also check by unresolved, assigned to me. You can apply more filters like based on maybe you want based on the match level. And then you can see, let's see which ones had Layout. Okay. That's all the Layout ones.
Which one had Strict? Okay. None of them had a Strict match level.
See how you can filter down here?
It's super useful to be able to play around with these different item types and the filter and not filter and so on and so forth.
One other thing I want to share is that you can actually share this view, so you can copy a link to the clipboard and then share it with your team.
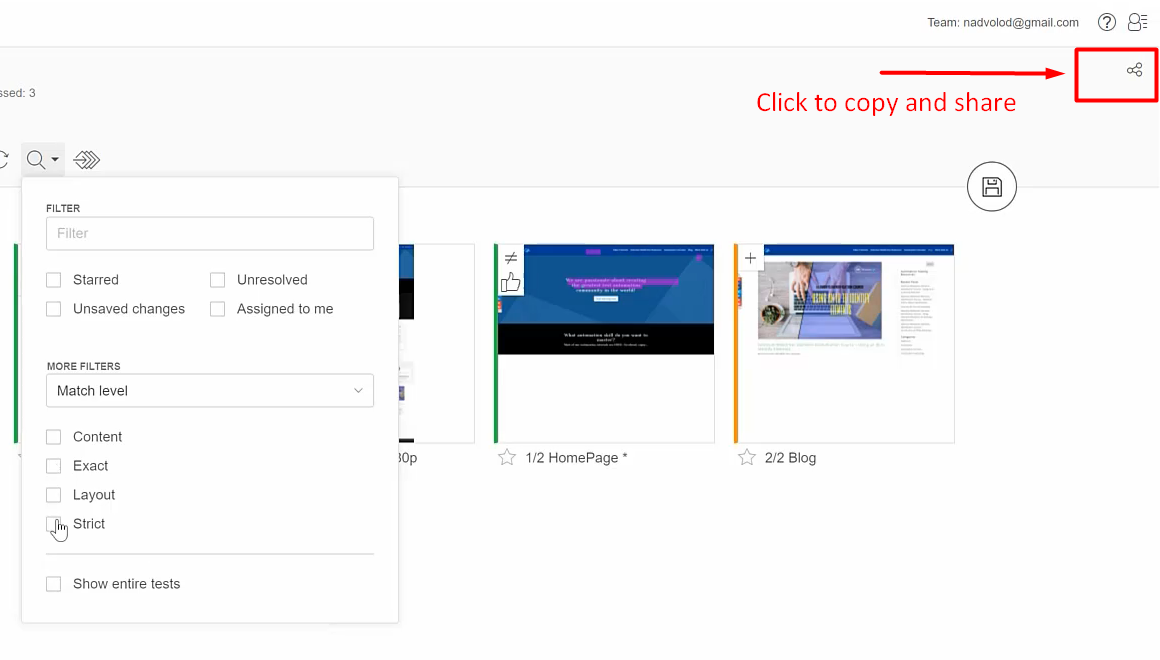
Your team does have to have an Applitools account in order to be able to log in and view it, but it makes life very easy cause you just copy the URL and now you can share it.
Now over here on the left-hand side, I already mentioned to you the batches I just want to mention some other options.
Obviously, you can do stuff with the batches.
Here you can toggle, so for example, if you want to do something with these two batches, you can delete them if you want. I don't want to do that.
You can reload the batches so if you have something running, I'm going to click confirm because I don't want to save anything. If you want to have some batches running, you can keep reloading them and then they will appear here and that you can filter based on the batches.
You can see that all of the batches automatically get a status. So, in this case it's unresolved because I have some unresolved tests but this one had a “Passed”. Other ones might have a failure. So, you can filter based on them here.
And you can even apply more filters here based on the batch status test status.
Also, I love to filter based on batch name.
If you come up with a really good batch naming convention, you can filter using the batch name.
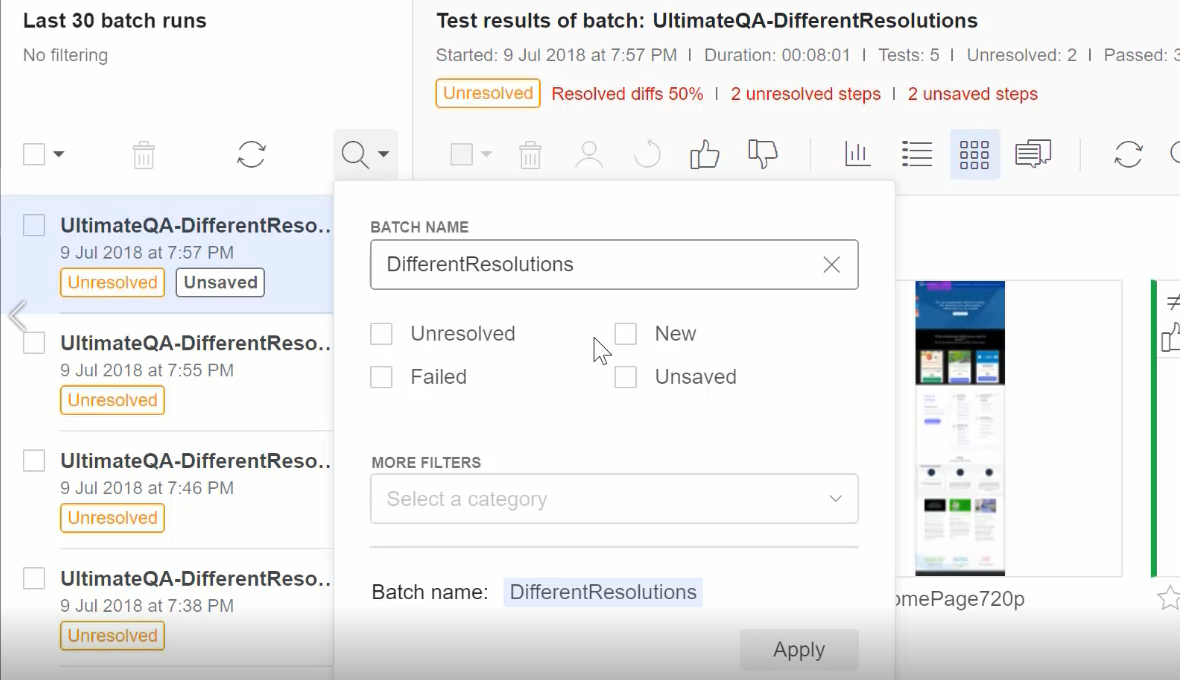
So, for example, if I do “DifferentResolutions” and then hit “enter” and “Apply” it, this will only show me all the batches that have different resolutions in the name. How awesome is that? Right?
If I remove this, you'll see that I have other batches that don't have that in it. So here for example, see that? I had these other batches that I was doing. So, it's very useful.
If you have used this in the past at different workplaces, I've actually used the application name and version in order to be able to see the screenshots for that application name and version.
You might want to batch it — maybe based on browser types, maybe based on operating systems — depending on what your large group category are, right? This is again, your running tests and you want to group all of your tests into a single place.
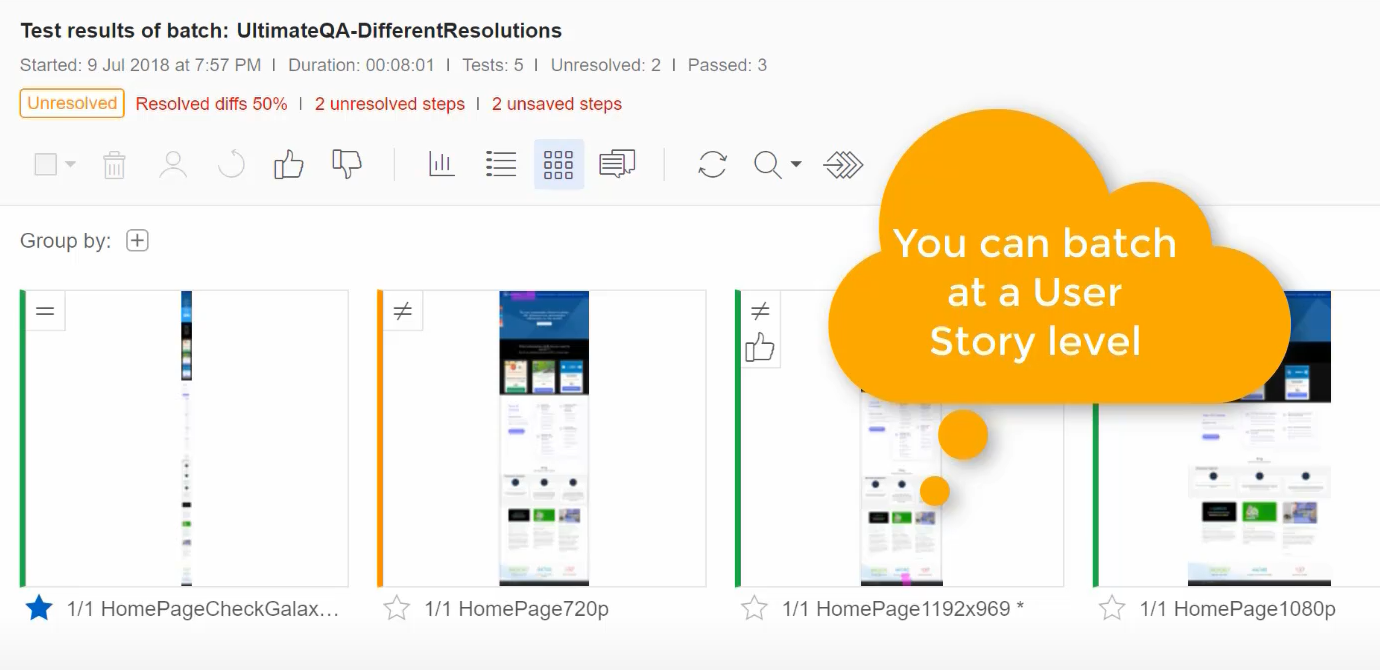
You can filter it based on functionality. You can filter it based on some kind of organizational unit that makes sense to you. For me, it made sense to group them here based on different resolutions per page. So, I'm going to have a page and then here I have all the different resolutions for that page, so that's how I've used batches here.
Finally, I've got to tell you about one other really cool feature in the dashboard here in the test manager and that feature is known as Auto Maintenance.
Auto maintenance is a really cool feature. So, what you can see here is I've got a bunch of different visual validations that I've done, right? These can run across multiple different pages, but these pages all live on a single website.
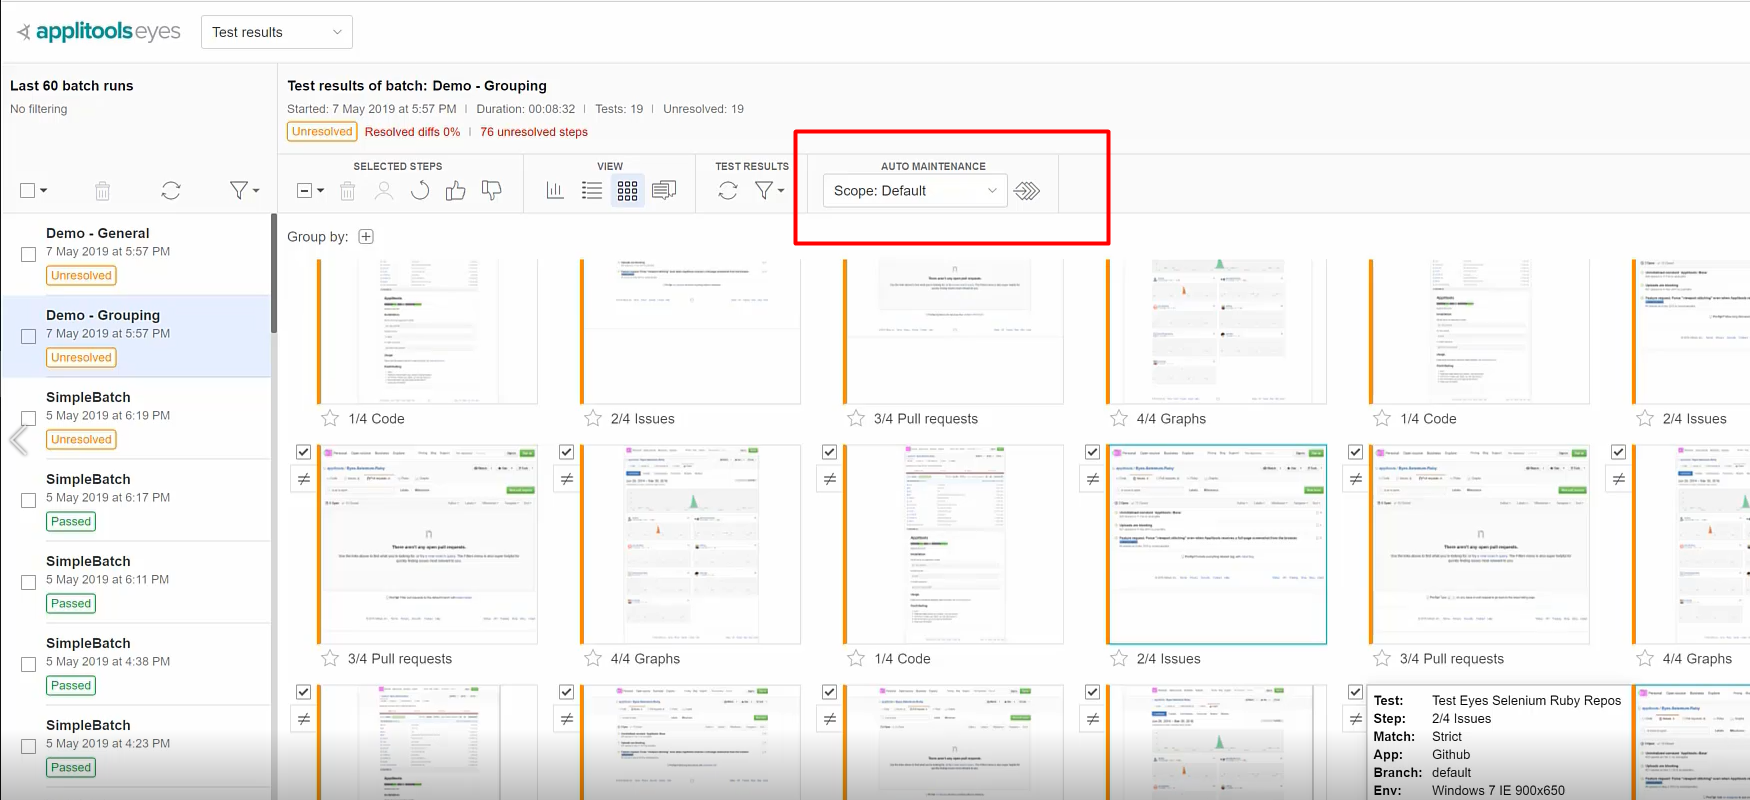
If we change something that is relevant to a single website, that might affect all of our screenshots, right? So, in our case here, what we can see is some changes that we have. Here, the GitHub icon has changed. So, if I turn on the diffs you can see it changed from green, it went from black to green. So, you can see that's one change that's occurred here.
And then potentially there was another change that happened.
Let me show you that. You can see that there was an icon actually disappeared. If we tab through these, you can see the icon disappeared.
So, this could be a lot of work to sit and maintain all of these images and give a thumbs up or thumbs down to all of them.
This auto maintenance feature allows us to automatically maintain a bunch of visual validations at the same time.
So, what you can do is you can actually group them and Applitools will use its smart algorithm to figure out if there are images with common differences and then if there are, it will group them for you.
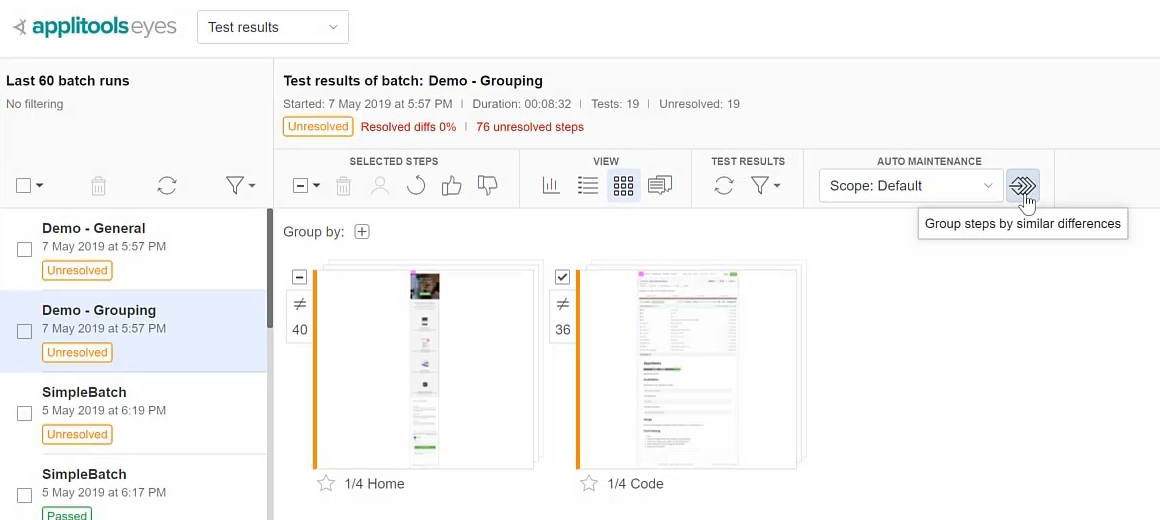
And then that way now you can see I am down to 2 batches and inside of these 2 batches, it's located items with similar changes.
For example, if I open up this batch in here, this is the batch where all of the images are missing the icon.
So over here for example, I can hit a thumbs down because that's a bug and then it's automatically already taken me to the other batch of images to maintain in here.
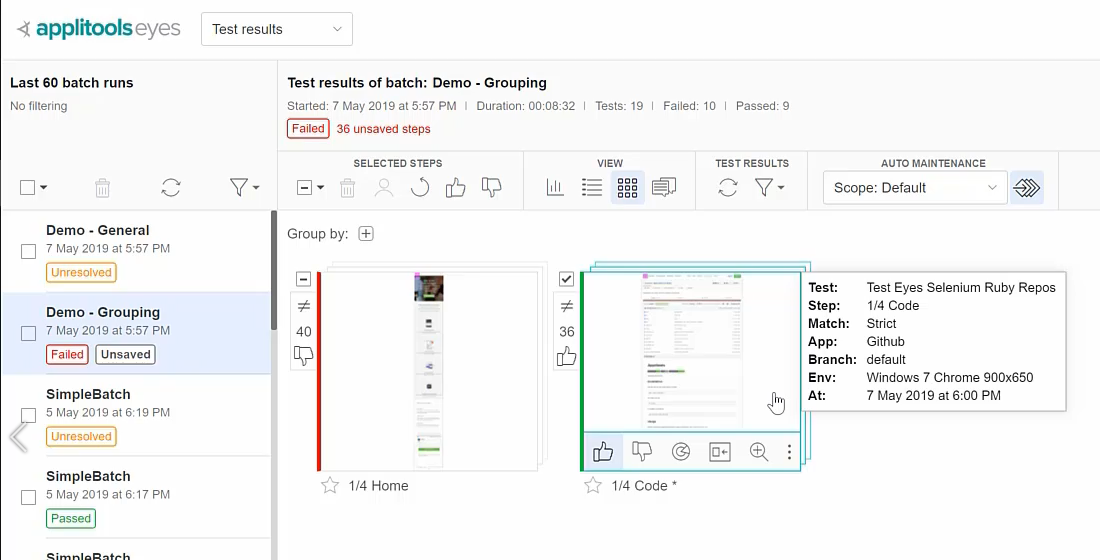
You can see that if you change it to green, which is totally okay, this was a new feature and so we're going to give it a thumbs up and so then it has this, I can say go ahead and say close and you can see that with 2, well, 1 thumbs up and 1 thumbs down, we were able to automatically maintain this batch and this batch.
To me, auto maintenance, is a little bit of a misnomer. I personally would have called it something like group update or group maintenance or batch maintenance because it's more of a let me handle all of the visual validations, add the same time versus auto maintenance, which makes me think Applitools will automatically maintain the feature for me.
But anyway, this is the auto maintenance feature.
Let me actually get rid of all of these changes so that I can show you one other cool thing that you can do.
For example, if you select all of the items in here, you can even apply “ignore regions” if you like.
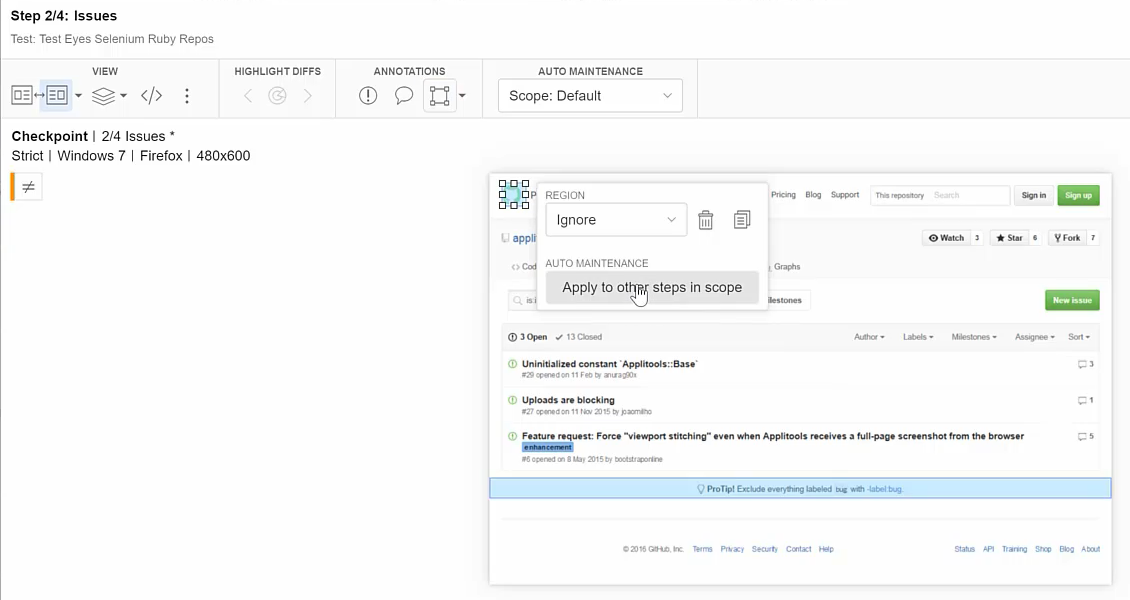
I can go ahead and do that. And then you can see that now we have this option to click this button and I'm going to click apply auto maintenance to all of the items in the scope and so now, it's going to check all of the screenshots. And then here it says that it automatically adjusts to 35 steps due to region change and steps 2 through 4, blah, blah blah.
If I come back out here and check some more screenshots, like this one for example, you can see that it automatically already has an ignore region applied here. And here is another example of that.
And so again, auto maintenance comes to the rescue and helps us to reduce the amount of work that we have to do in maintaining these images.
All right, well we've come to the end of the journey.
Thank you so much for being here with me today and taking time out of your day to watch the Automated Visual Testing with C# course. My name is Nikolay Advolodkin.
If you have any questions feel free to reach out to me on Twitter, LinkedIn, or my blog.
It was a pleasure teaching you. I hope that you enjoyed the course and here is the door, don't let it hit you on the way out.
