

Transcripted Summary
The Eyes Test Manager is a browser-based tool that gives you access to your visual UI test data and allows you to manage your test results, baselines and other meta-data associated with your tests.
The Test Manager is divided into 2 main regions: the sidebar and the center panel.
# Applitools Test Manager – Side Panel
The Sidebar is located on the left side of the Test Manager — it displays all recorded test runs, with the newest runs listed at the top.
Each run includes a batch of tests.
By default, each test run is displayed as an individual batch. However, you can use the Eyes SDK to group multiple tests together into a single test run.
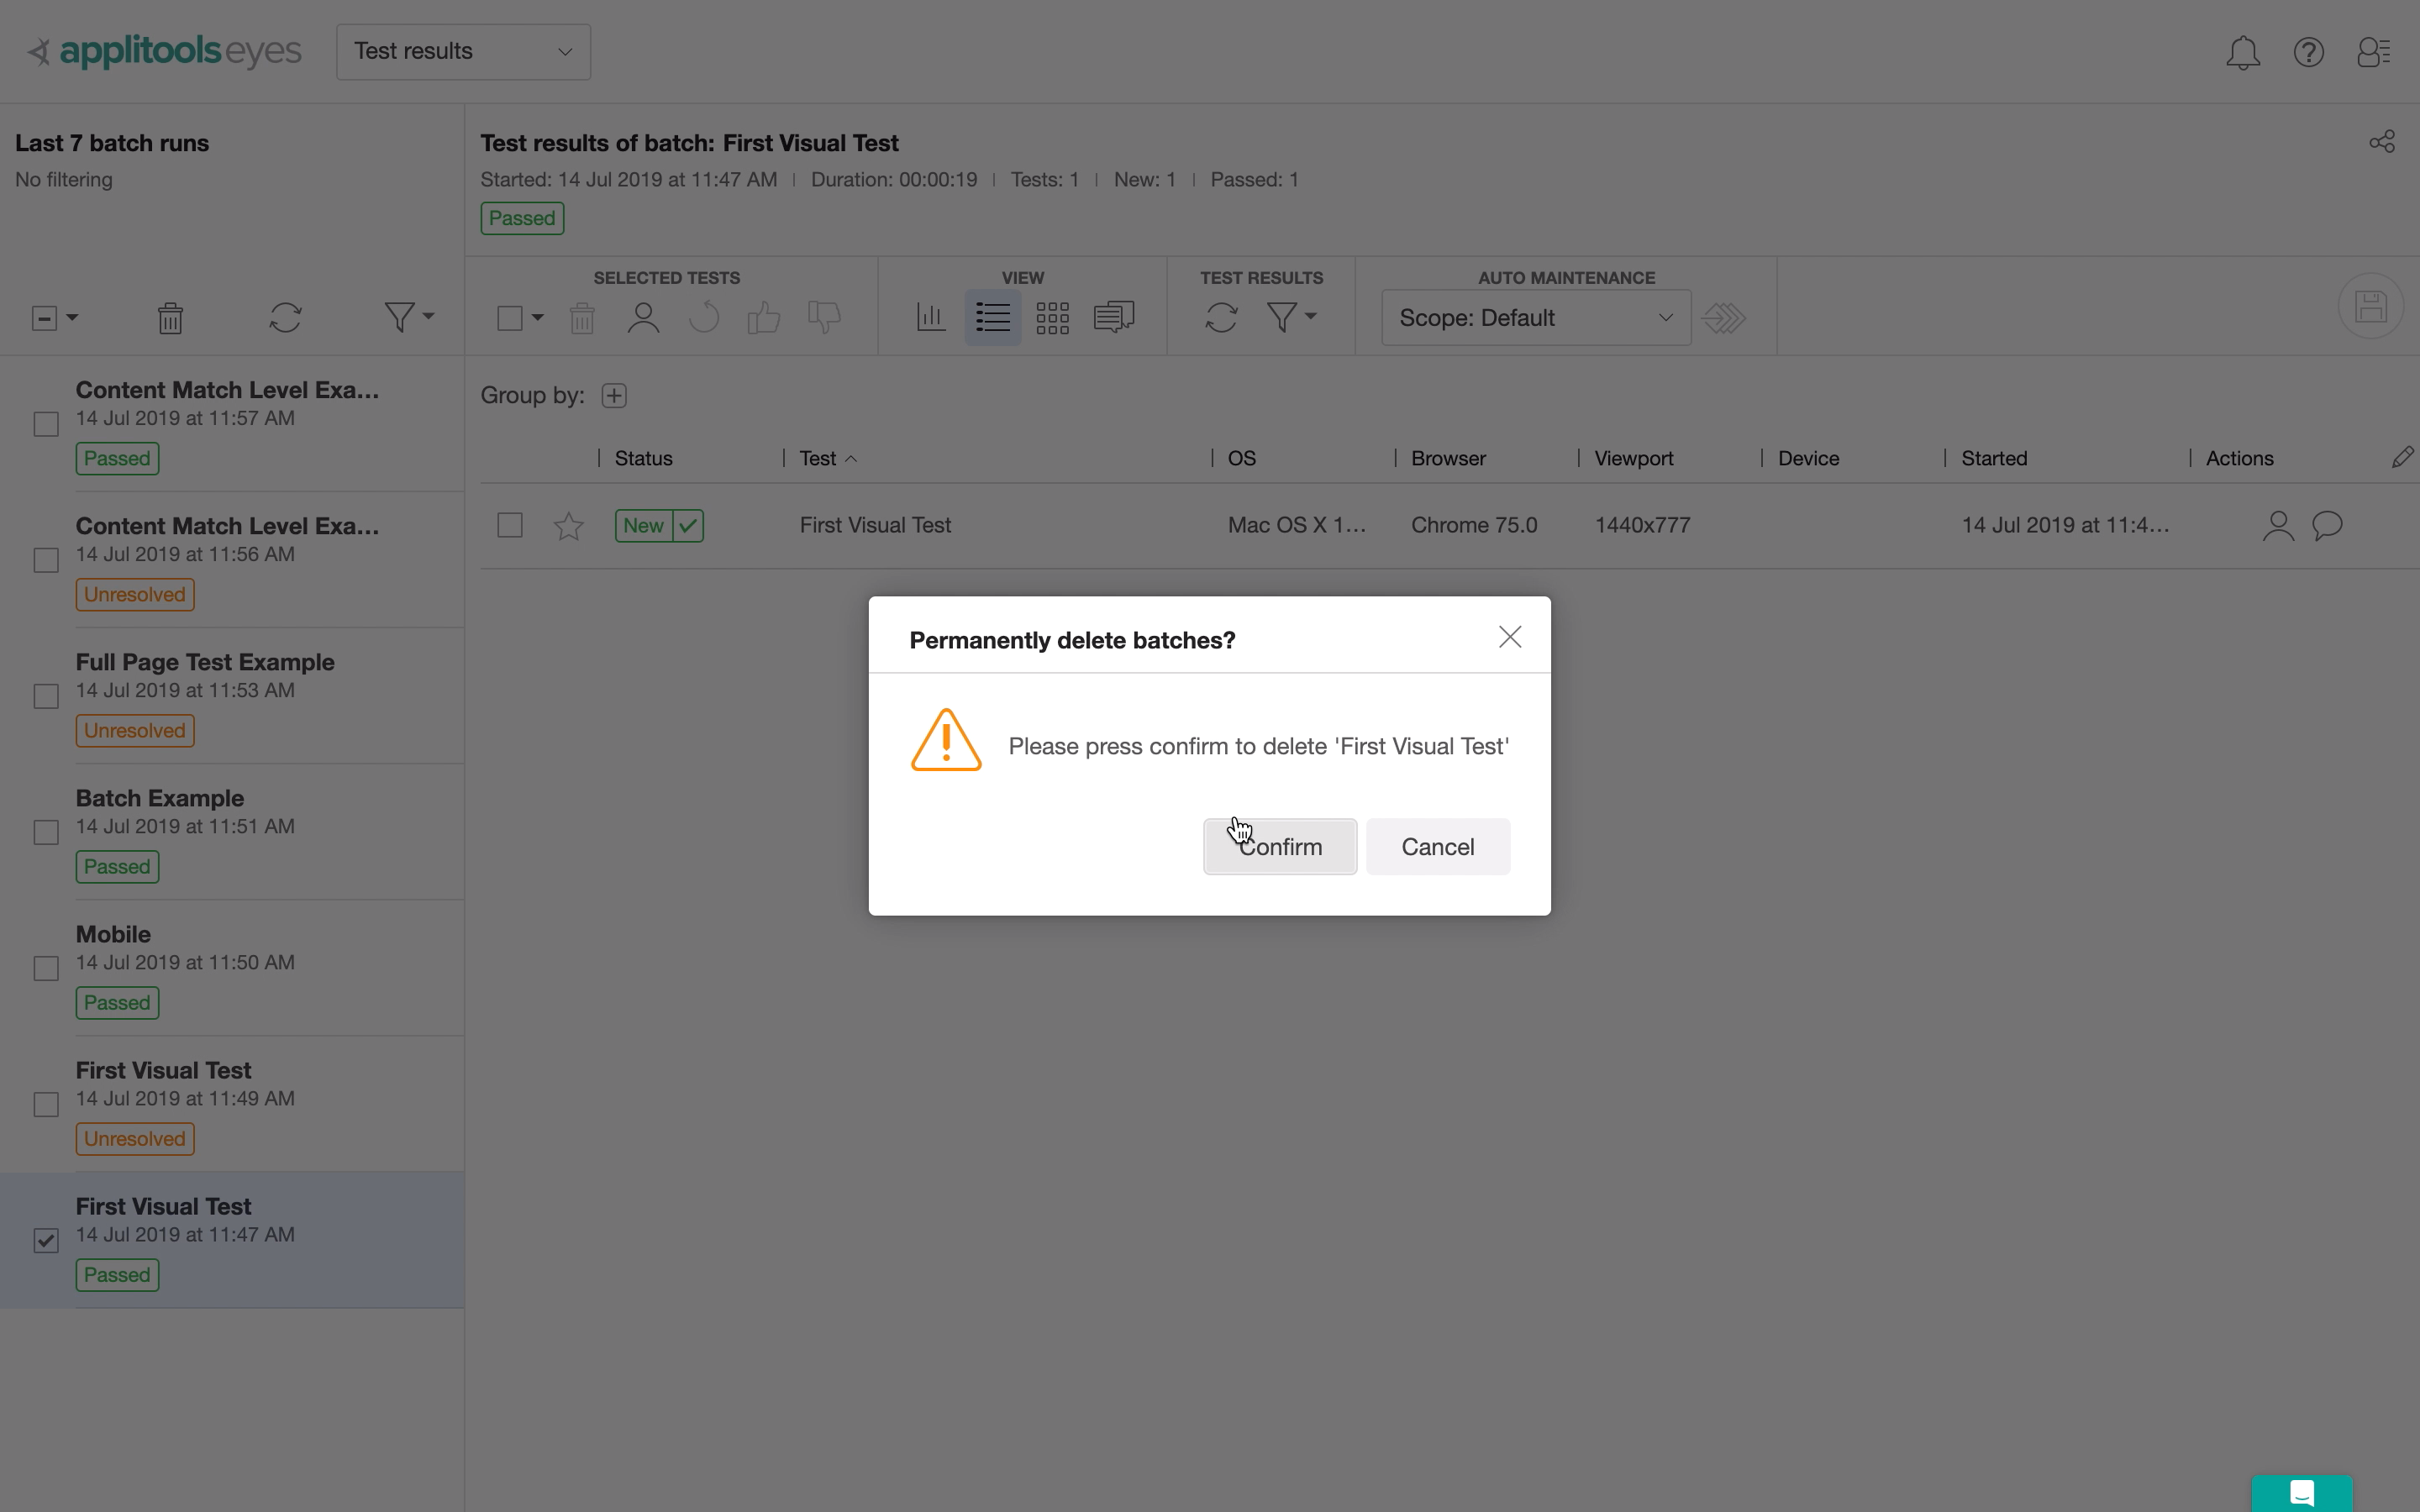
We also have the option to delete a test.
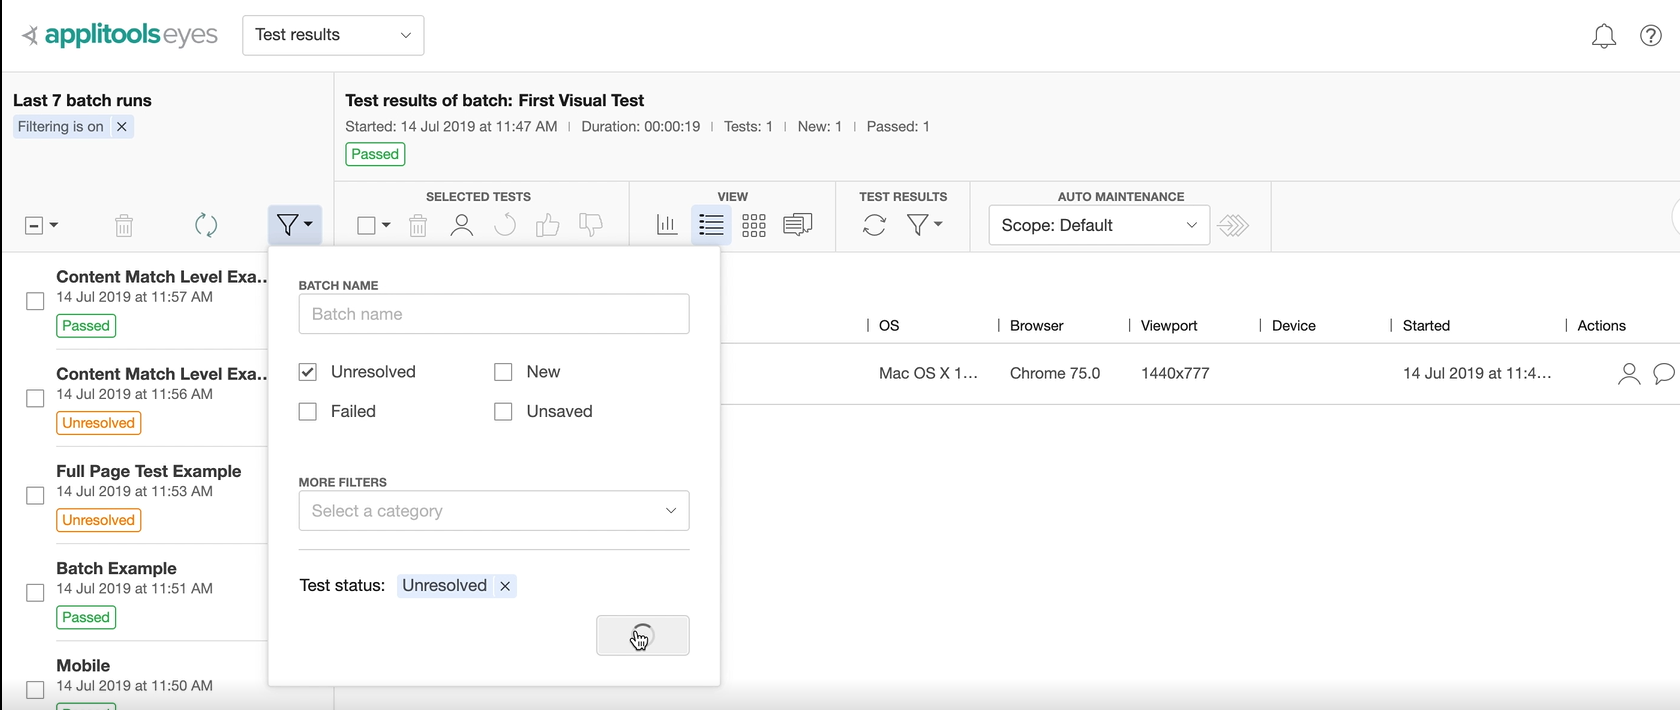
Or to filter the tests by a particular category.
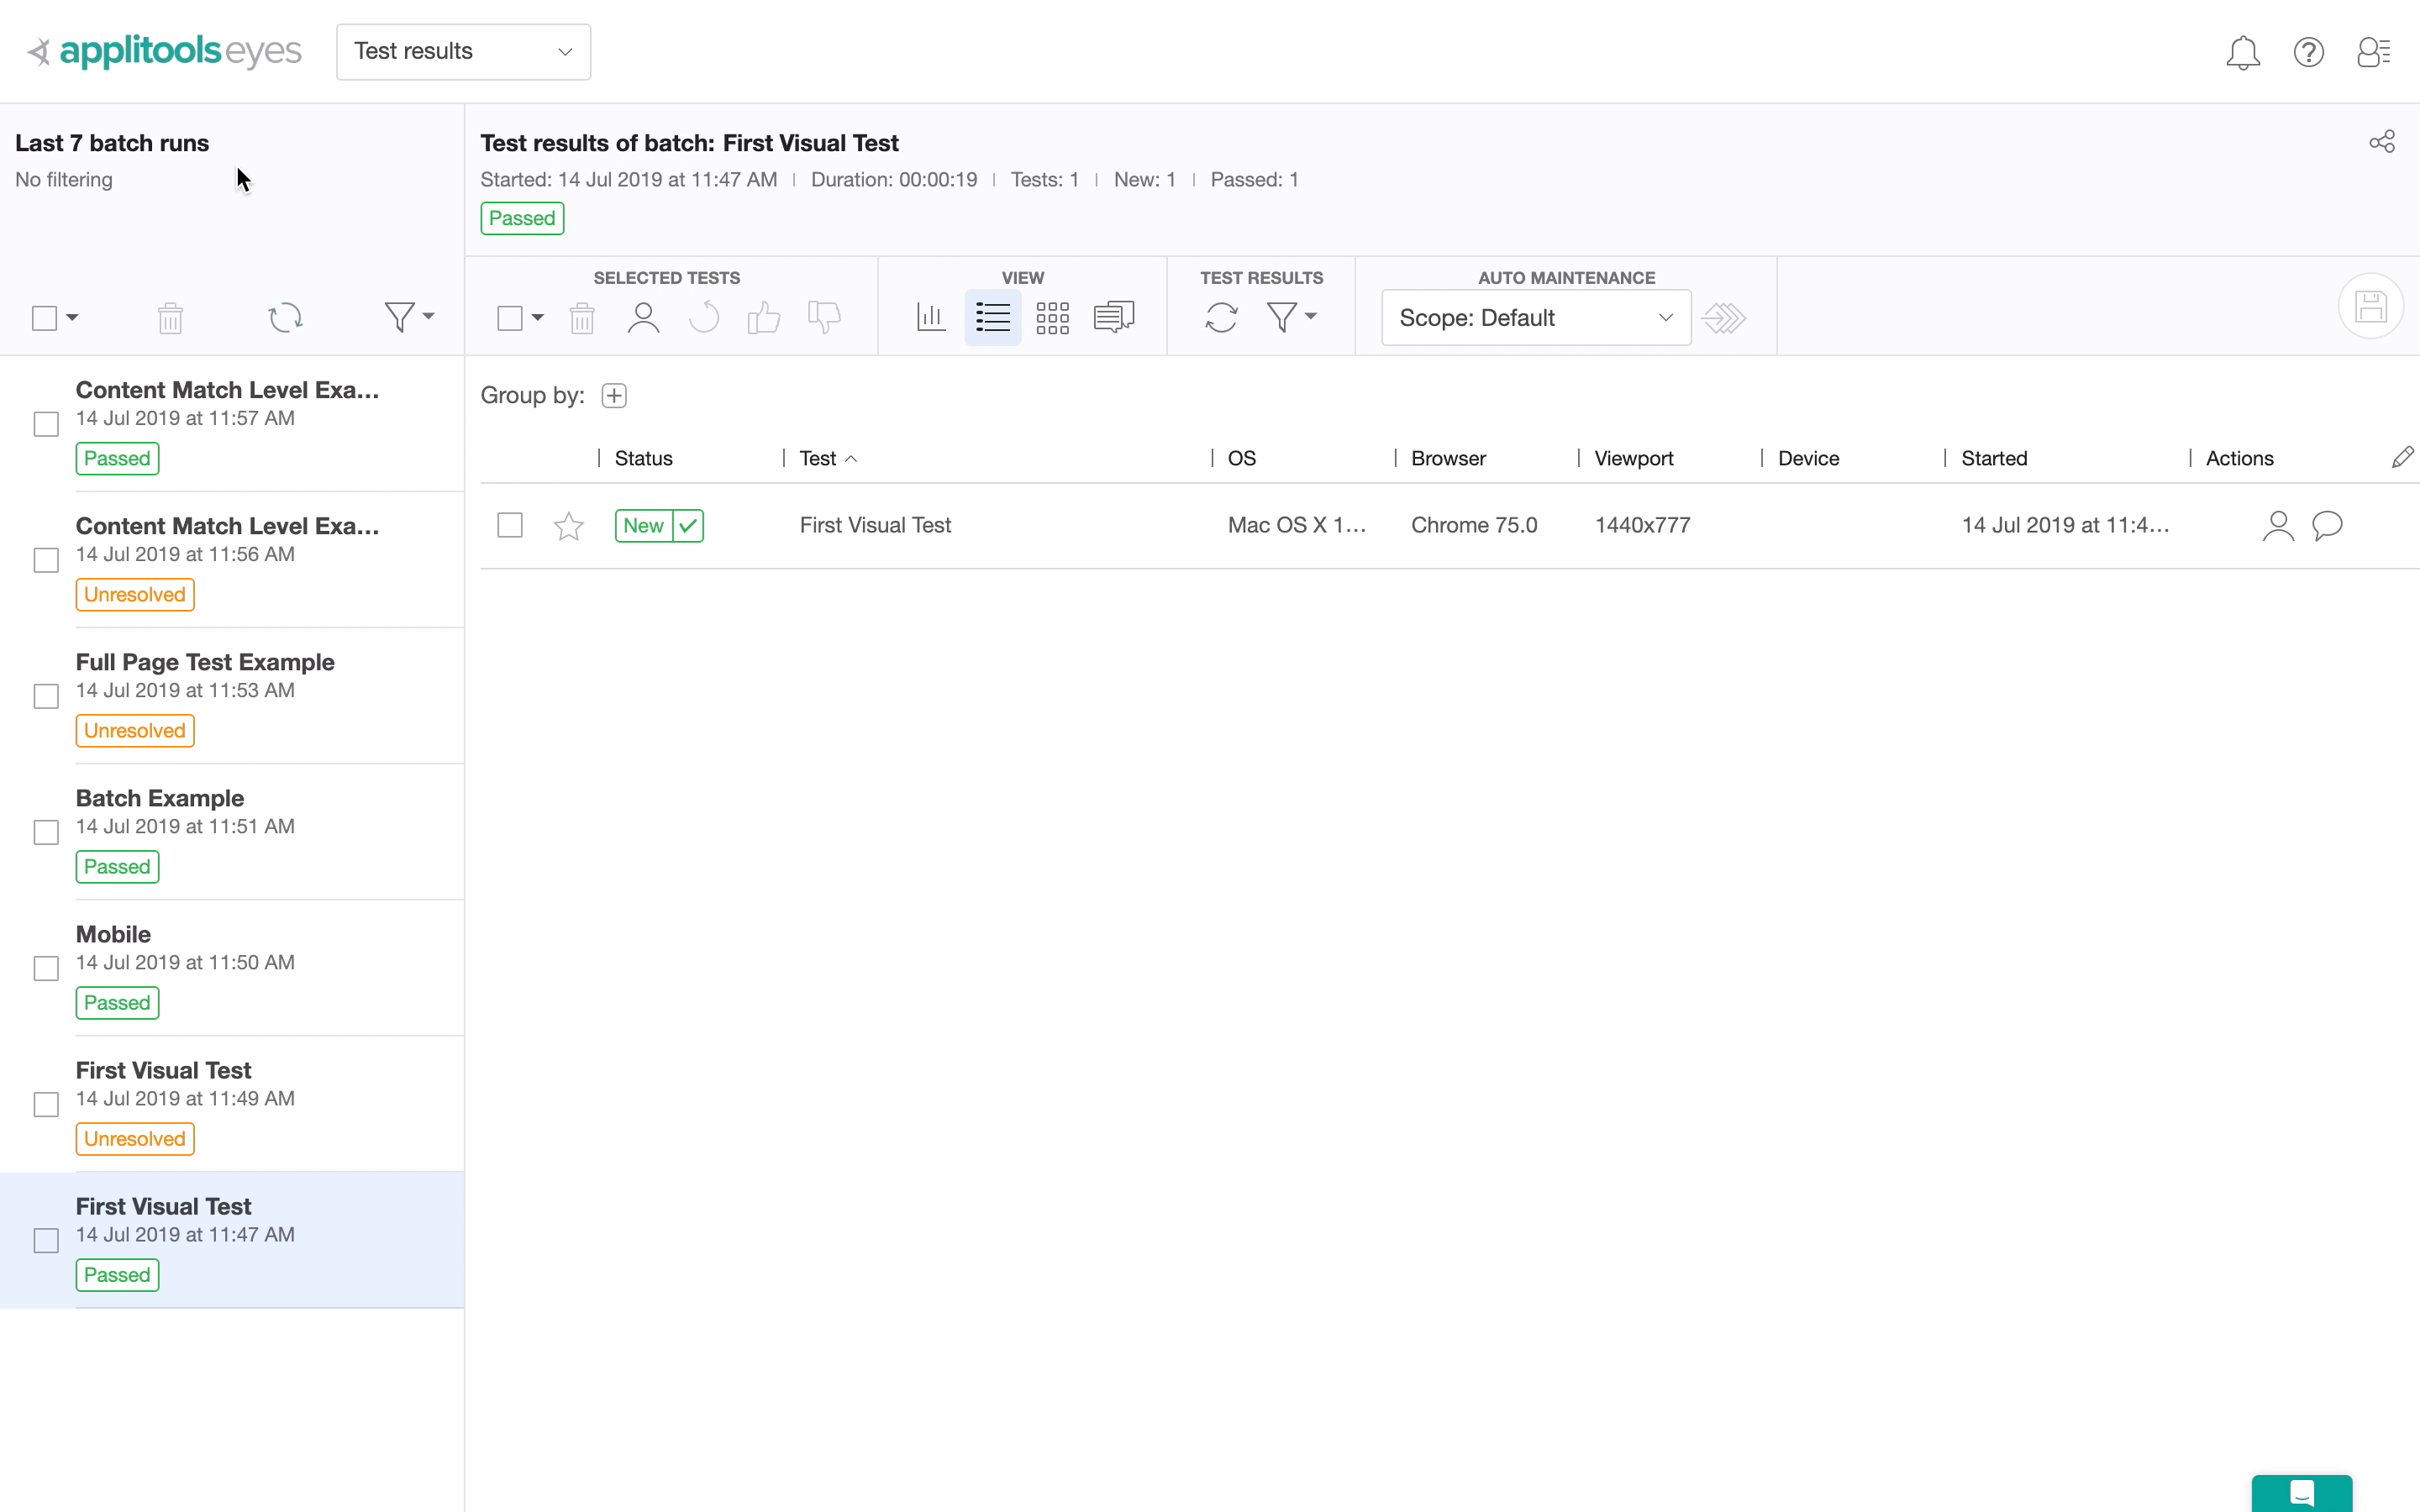
# Applitools Test Manager – Center Panel
The Center Panel shows you the details of the currently selected batch.
If we start at the top, we can see the date the test was started, the duration of the test, the number of tests and the status of all the tests.
# Applitools Test Manager – Views Options and Functionality
The Test Manager also provides a number of different views for displaying and managing your test results [accessible from the center panel].
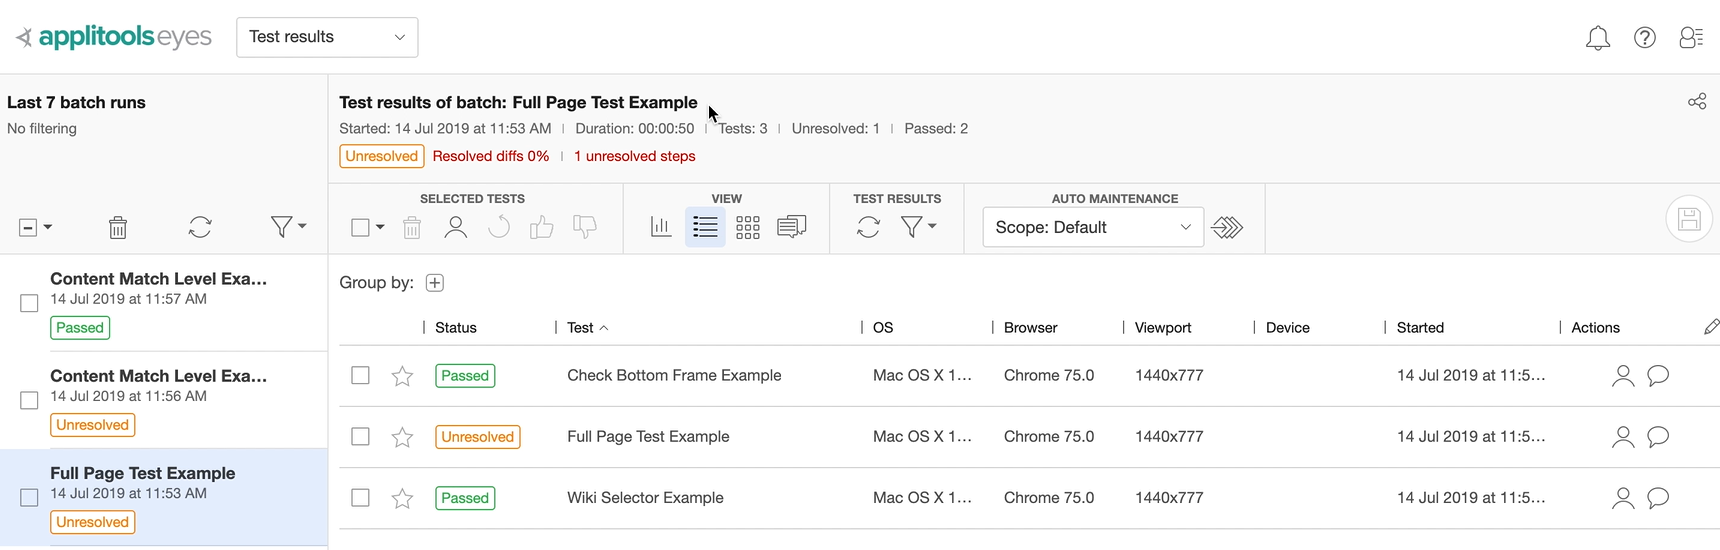
The default view is known as the Test Details view.
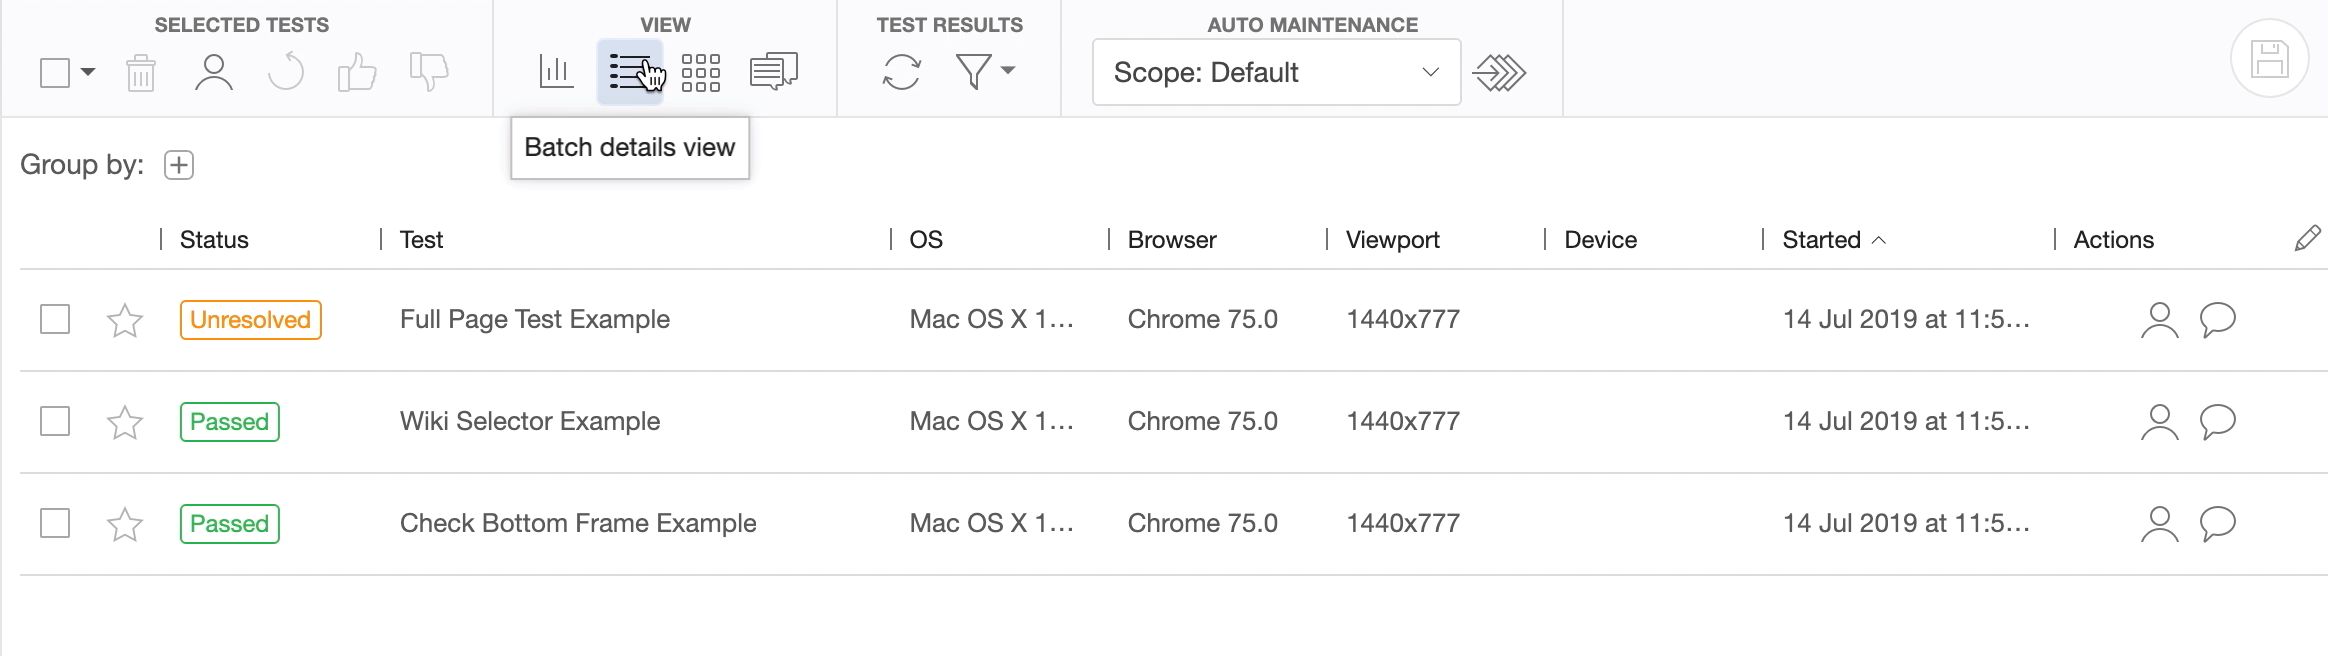
This view lets you inspect and sort tests using a variety of options.
You can group tests together and create your own hierarchies using the available properties. Clicking on a test will reveal thumbnails of the screenshots that have been sent for validation.
The next view is the Batch Steps view.
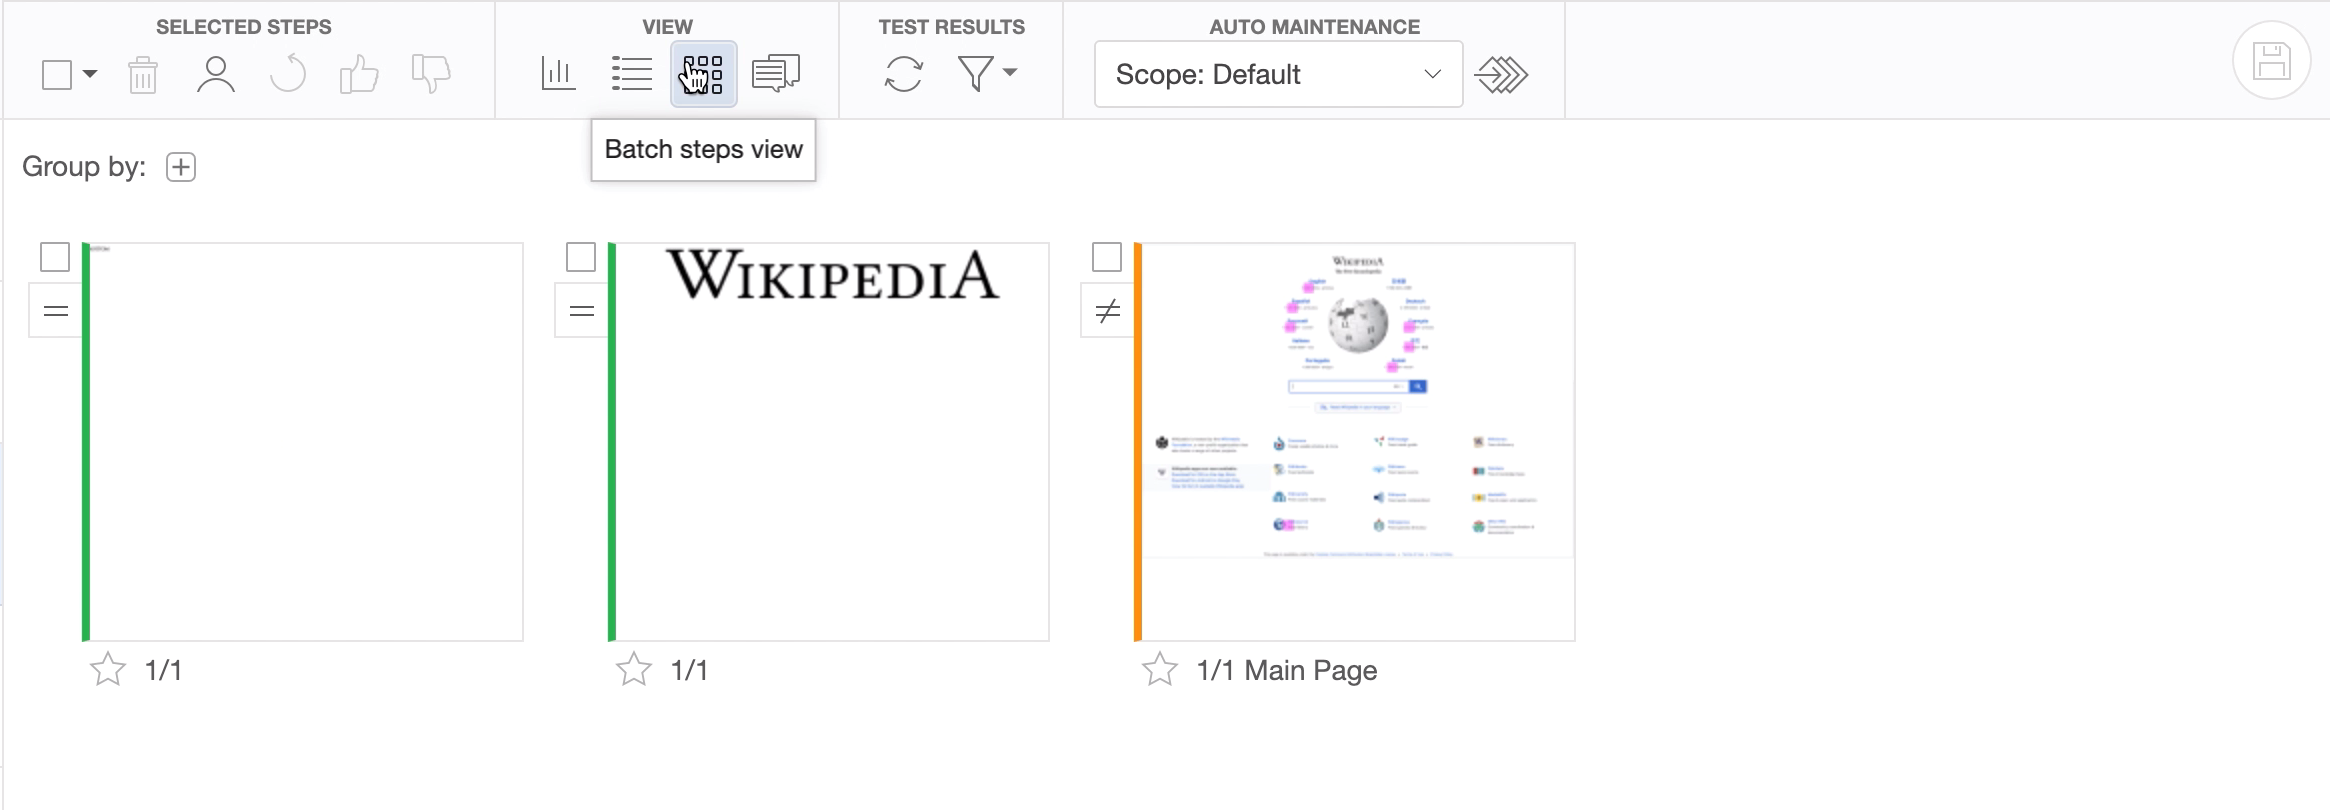
This view shows validated screenshots in a single group and ignores the batch from which they originated.
In addition, this view can create a single representative screenshot that groups a number of steps with the same or similar differences.
The next view is the Batch Summary view.
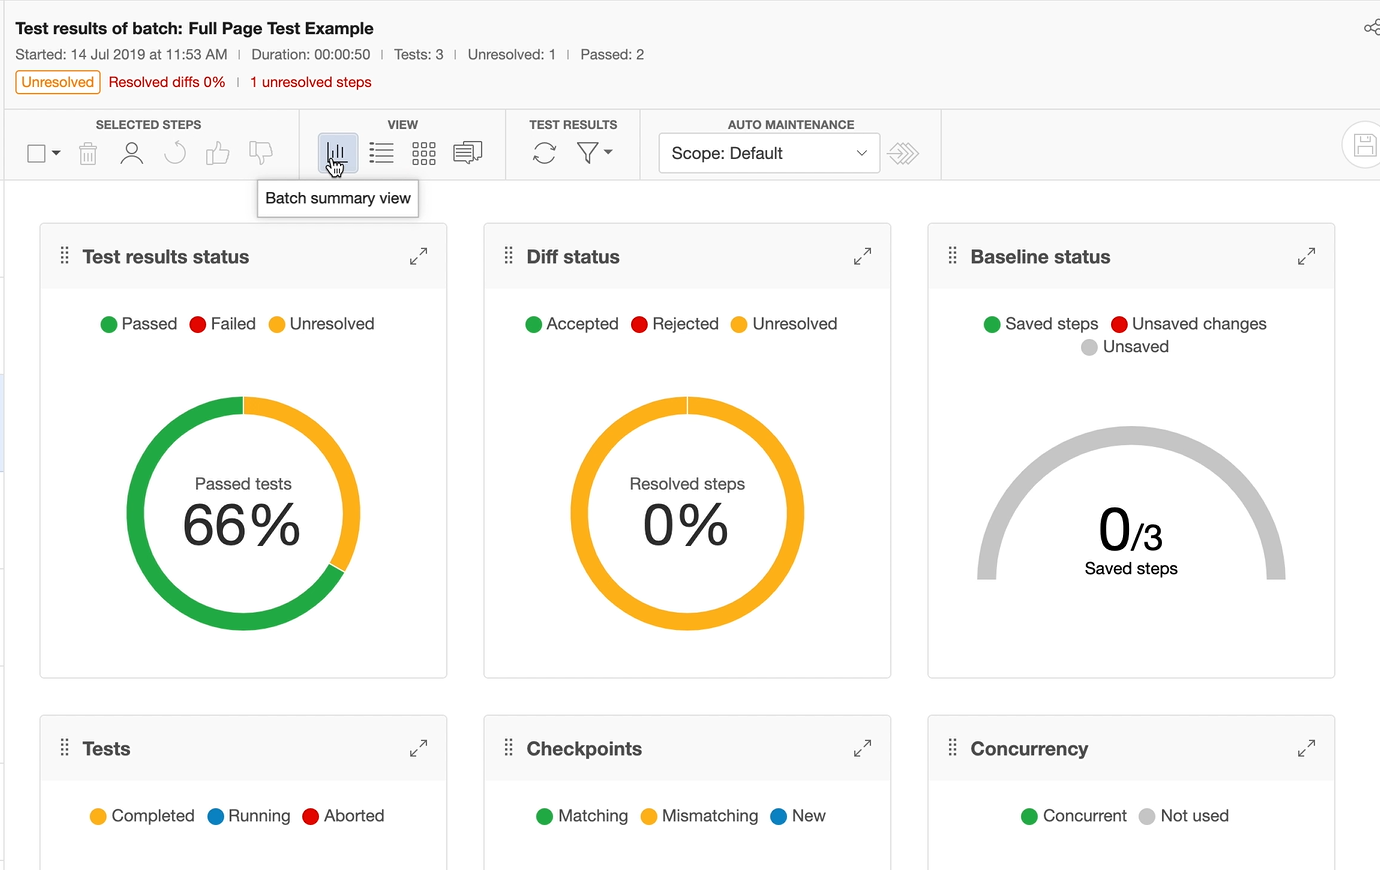
This view allows you to assess the status of the batch quickly.
It also allows you to visualize key metrics, such as the pass and fail ratios per test and the test status distribution grouped by browser, operating system, and viewport size.
When you run a test for the first time, the Test Manager marks it with a green label.
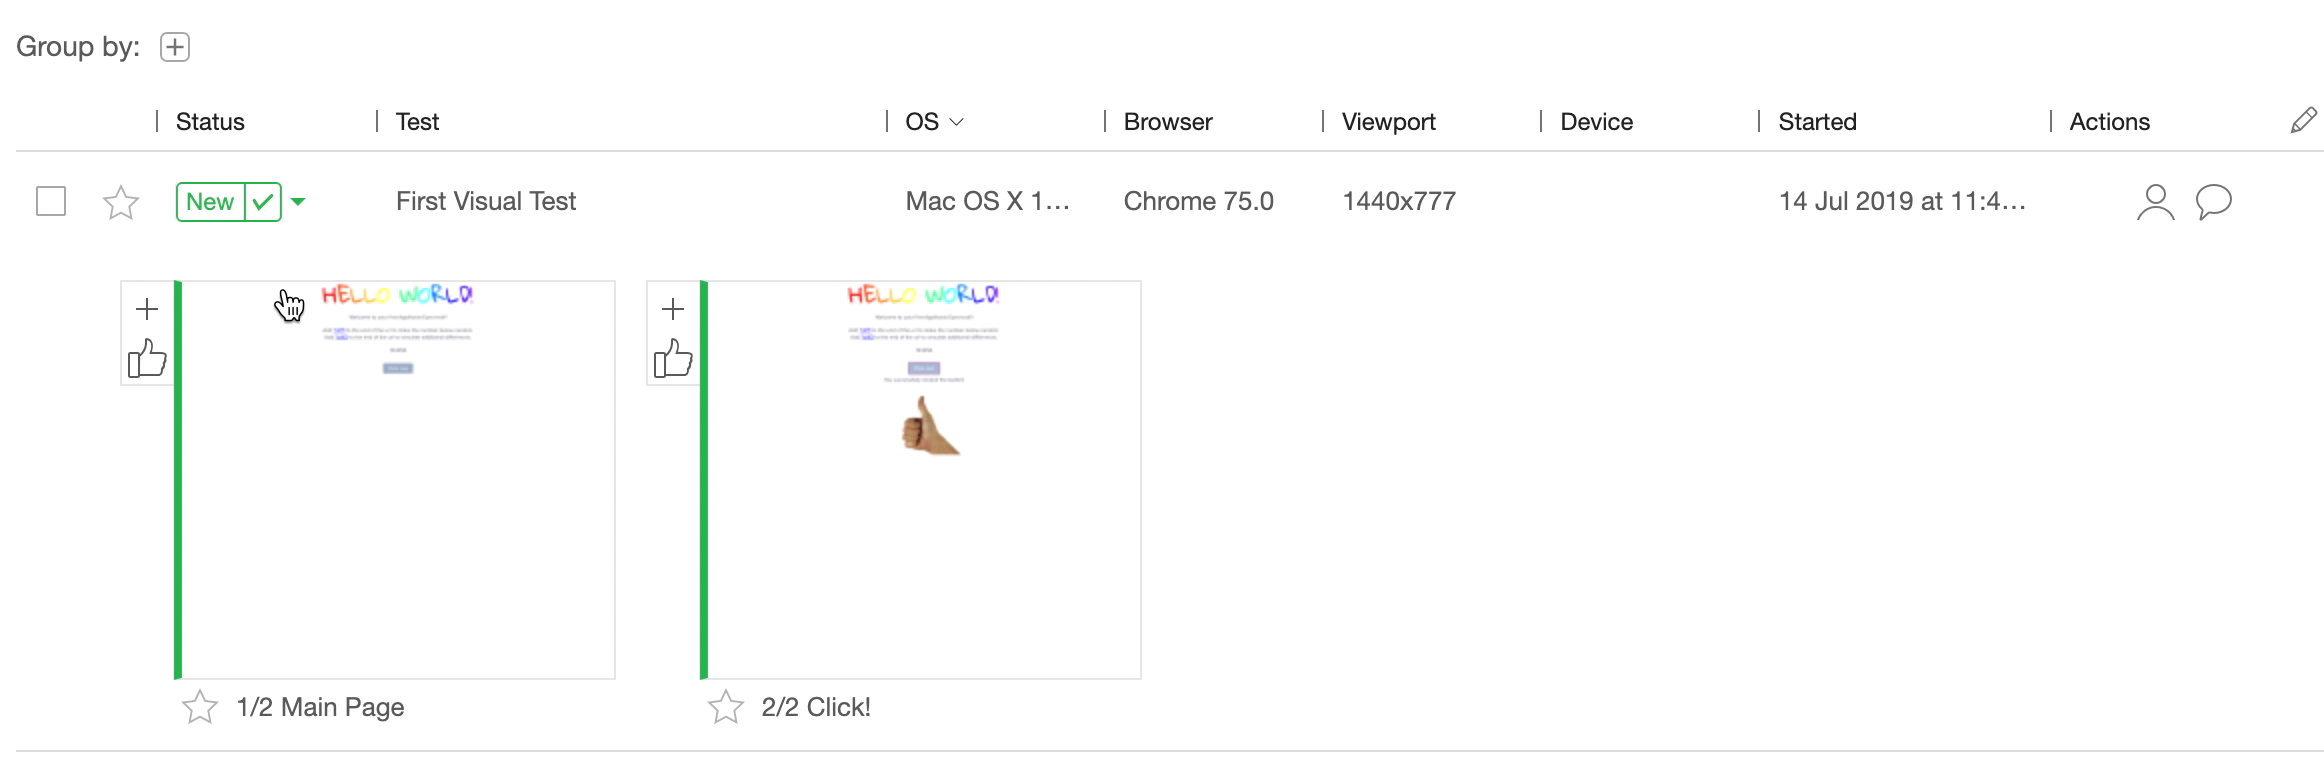
The label indicates that this is a new test run, that the test was passed, and that its screenshots were used to create a baseline.
The plus sign in the upper left corner of the thumbnail indicates that this is a new step that did not previously exist in the baseline.
The thumbs up symbol indicates that Applitools has accepted the screenshot and included it as a baseline image.
In addition, any test or screenshot that matches the baseline will be marked as passed, and its steps will appear with a green stripe and an equals sign.
When you want to review a test run you have to click on the appropriate thumbnail image and the image will be displayed in the Test Editor.
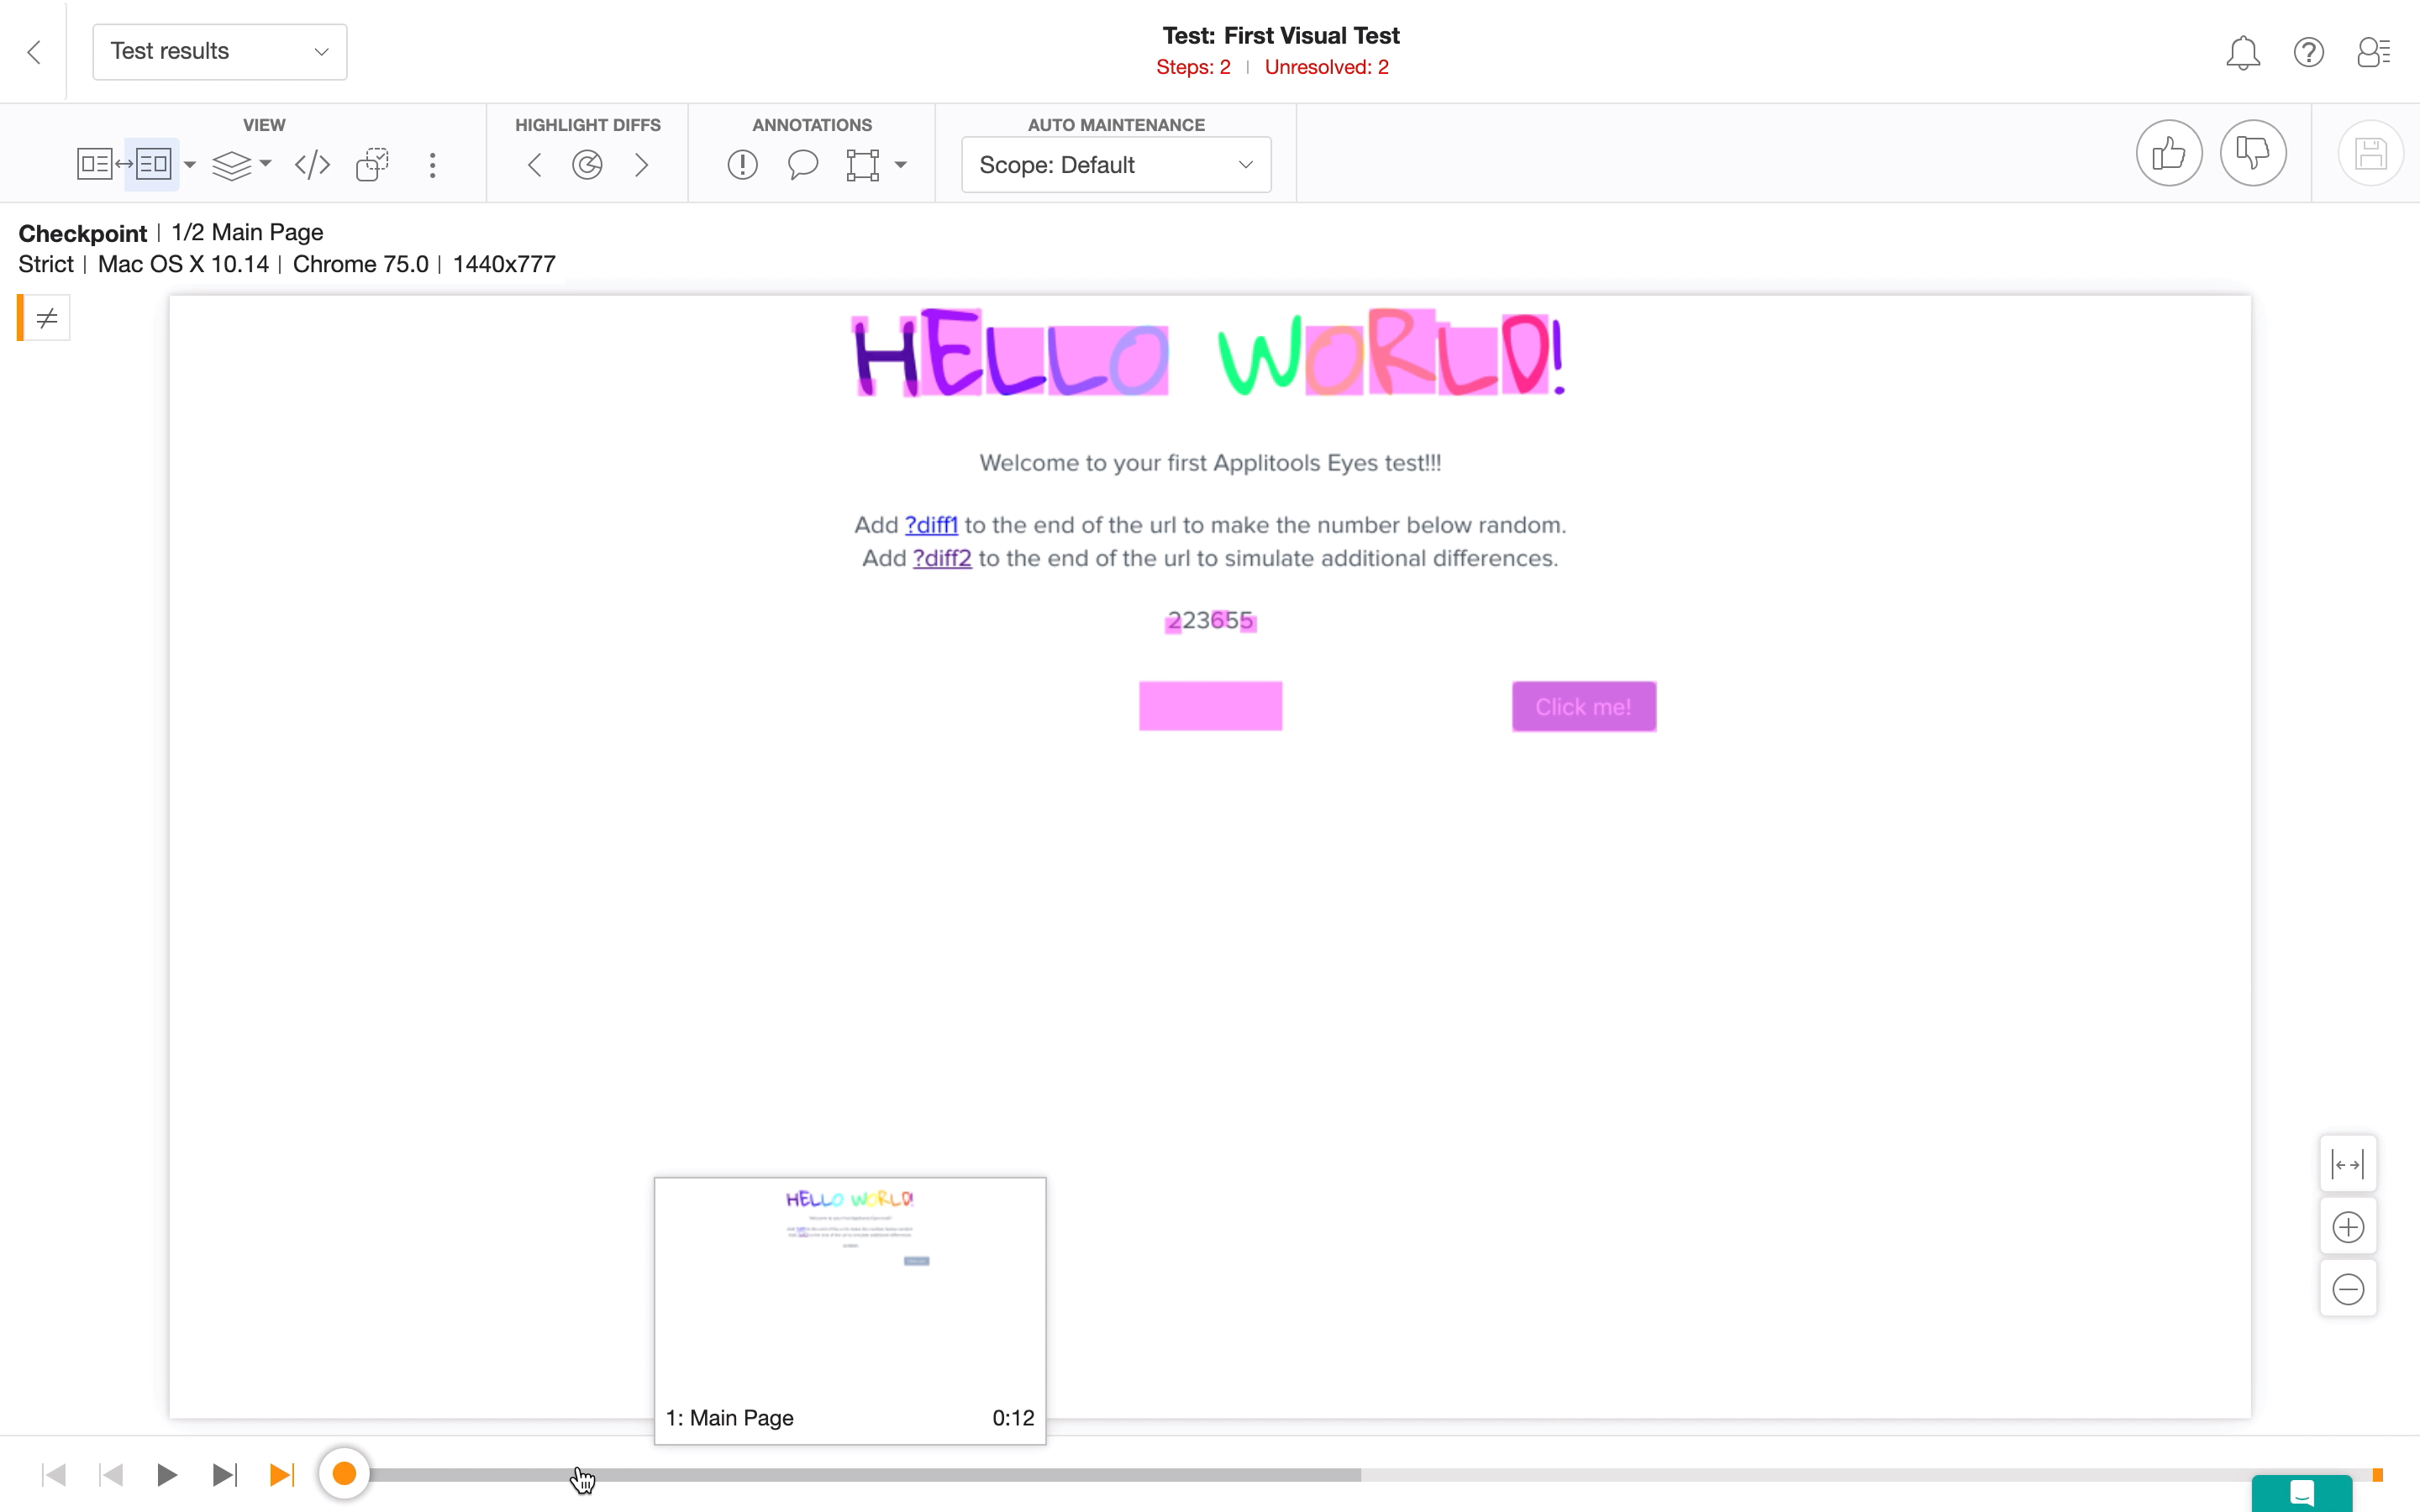
The Test Editor provides additional baseline editing tools.
For each test, a timeline is displayed at the bottom of the screen.
This shows the individual test steps and indicates the result of each checkpoint.
The views sections provide different ways for us to analyze our visual tests.
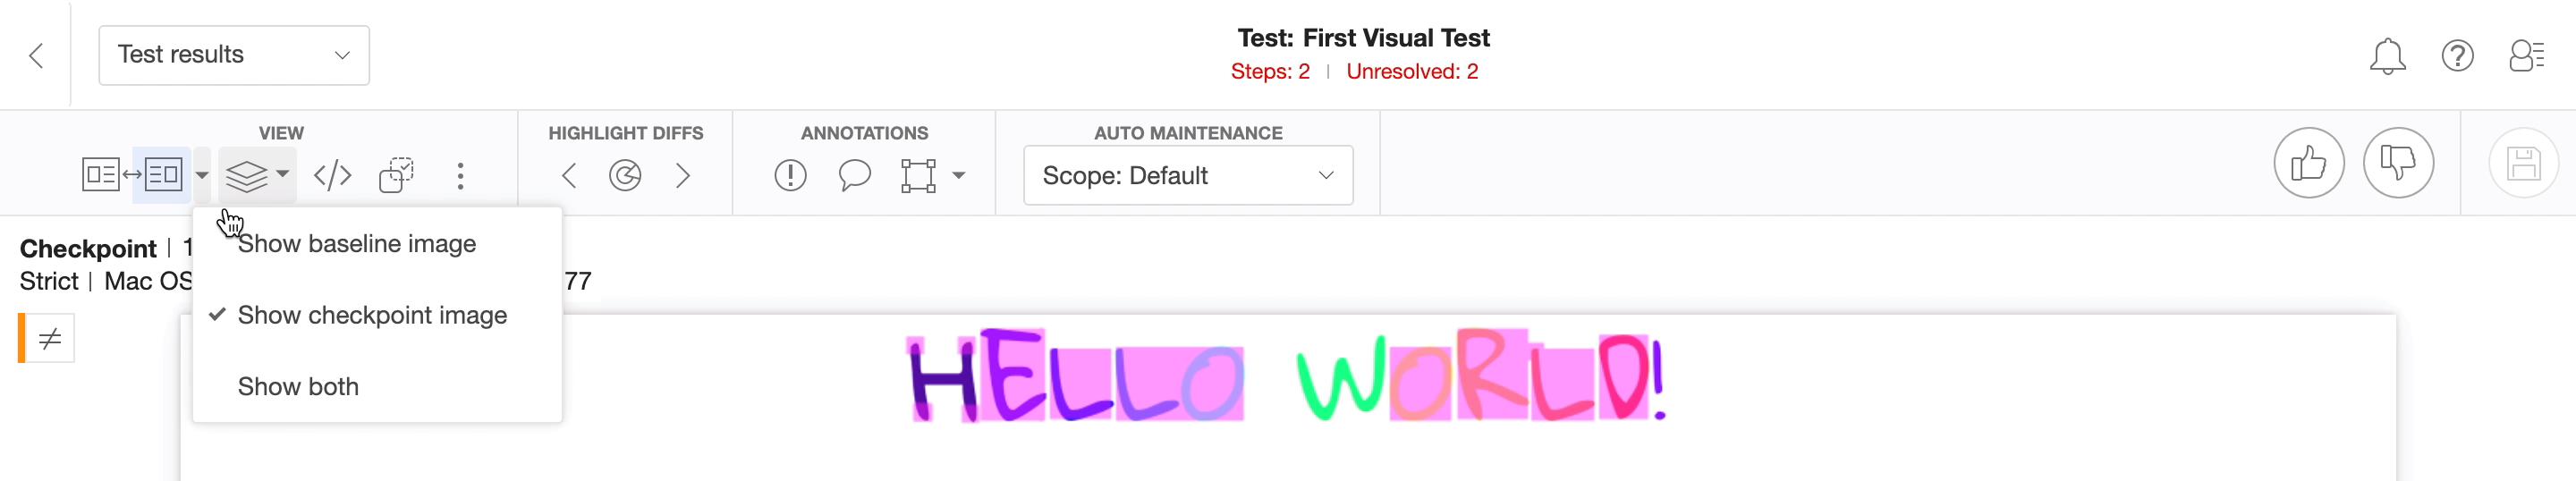
We can choose to only see the baseline image, checkpoint image, or both.
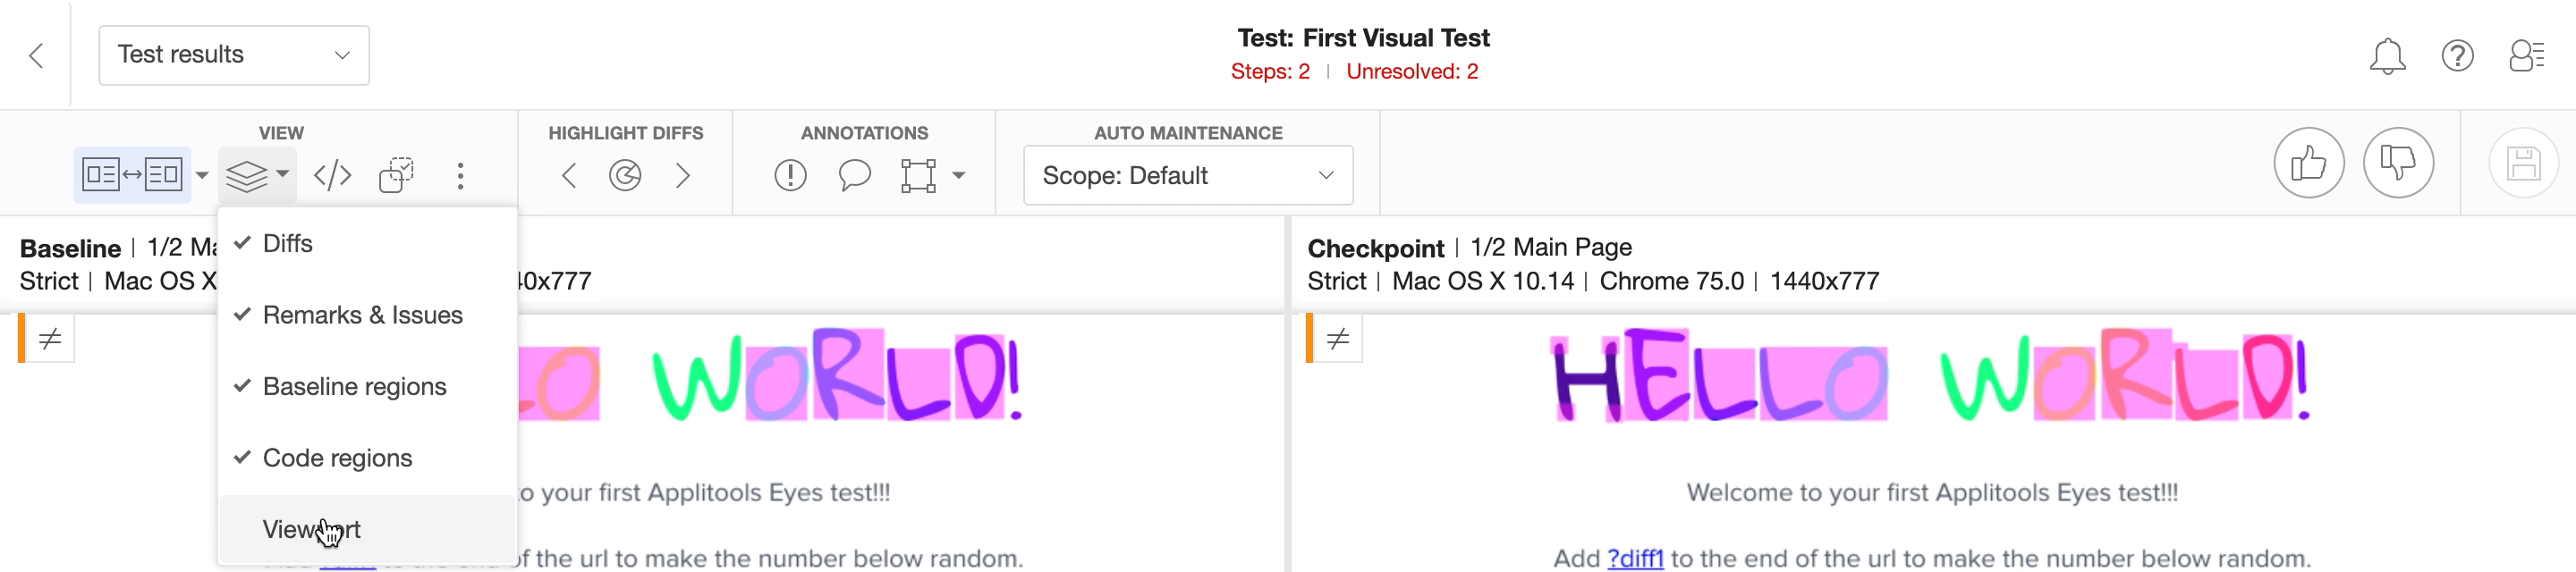
We also have the options to select which layers of the test we want to show.
If we click the menu option, we can reveal the other items in the Views section.
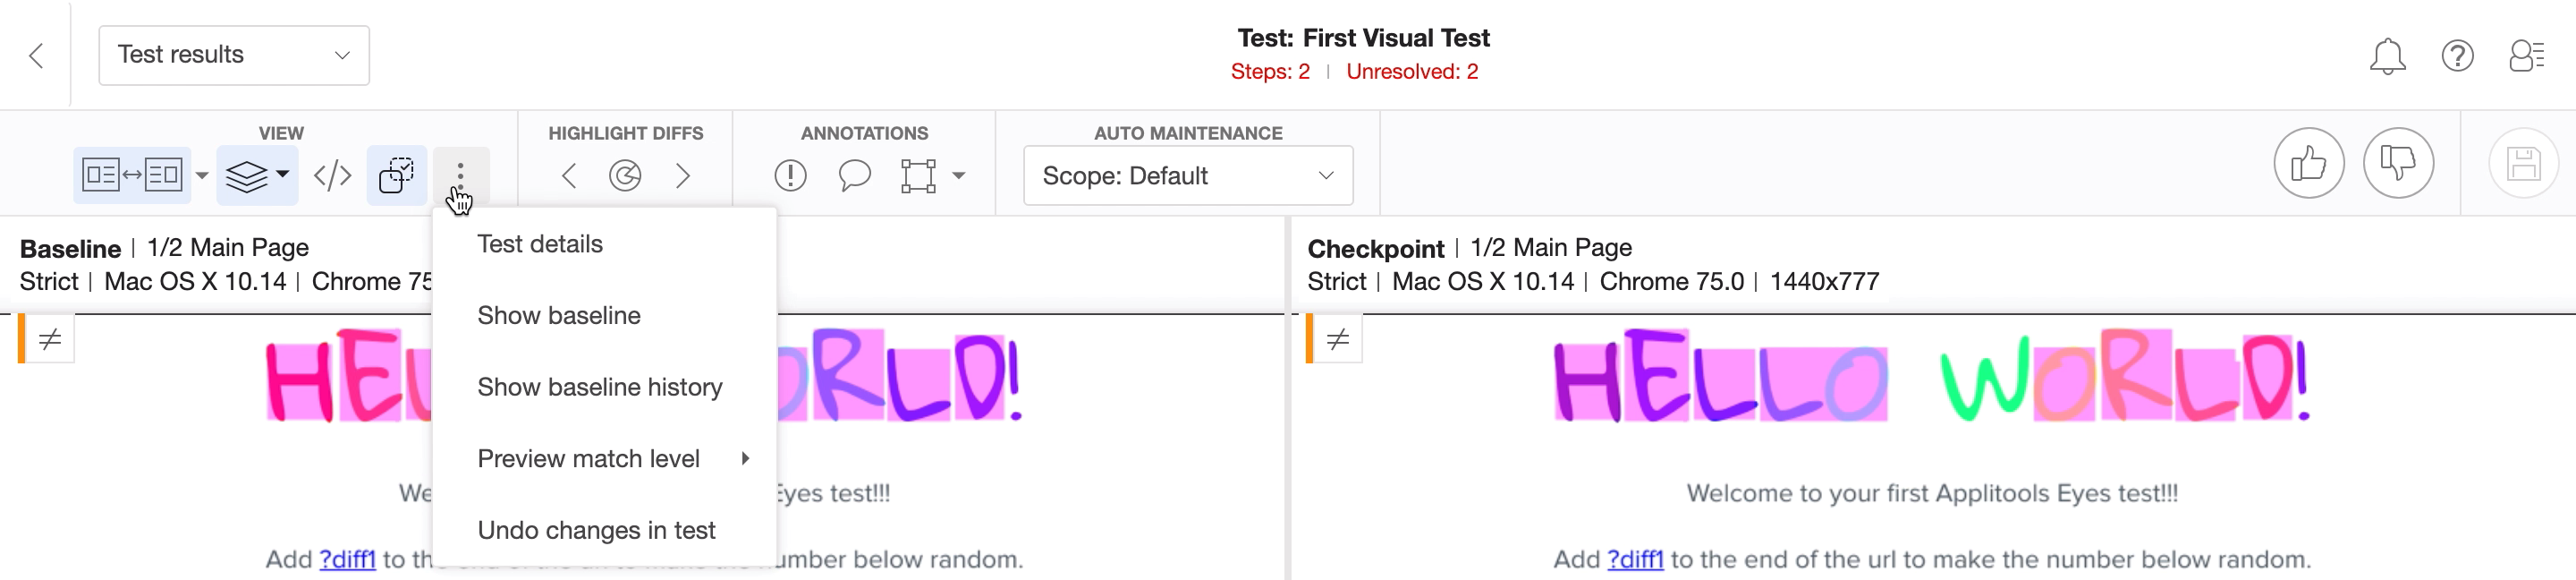
We can view the Test Details, Show baseline, Show history of baseline, Preview match levels, or Undo changes to test.
The last thing under the views section I want to look at is Root cause analysis.
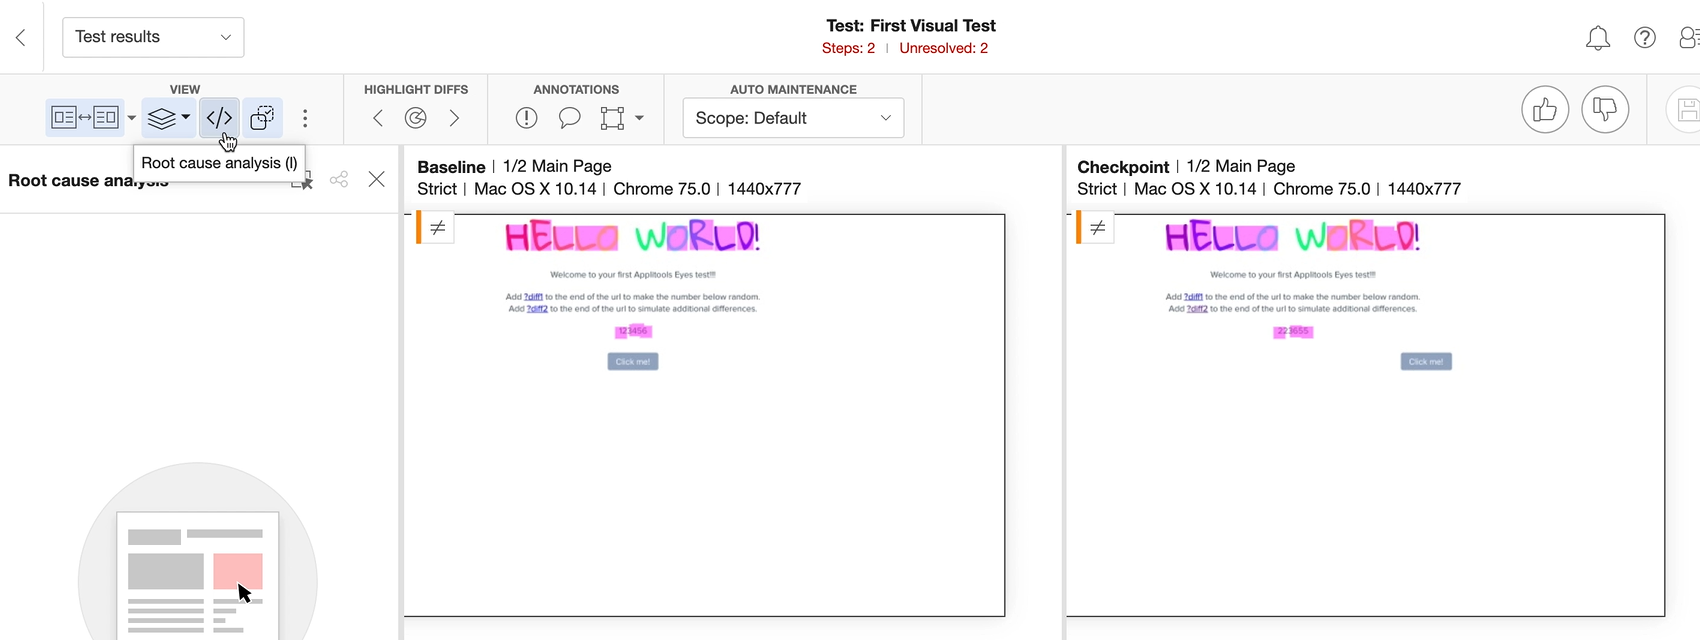
Root cause analysis provides us with the ability to detect the changes in the code that caused a visual defect to appear.
For example, let’s say we wanted to see why this number element was flagged.
If we select the element in the baseline and the corresponding element in the checkpoint, Applitools will show you the differences it finds between the DOM & CSS for the 2 images.
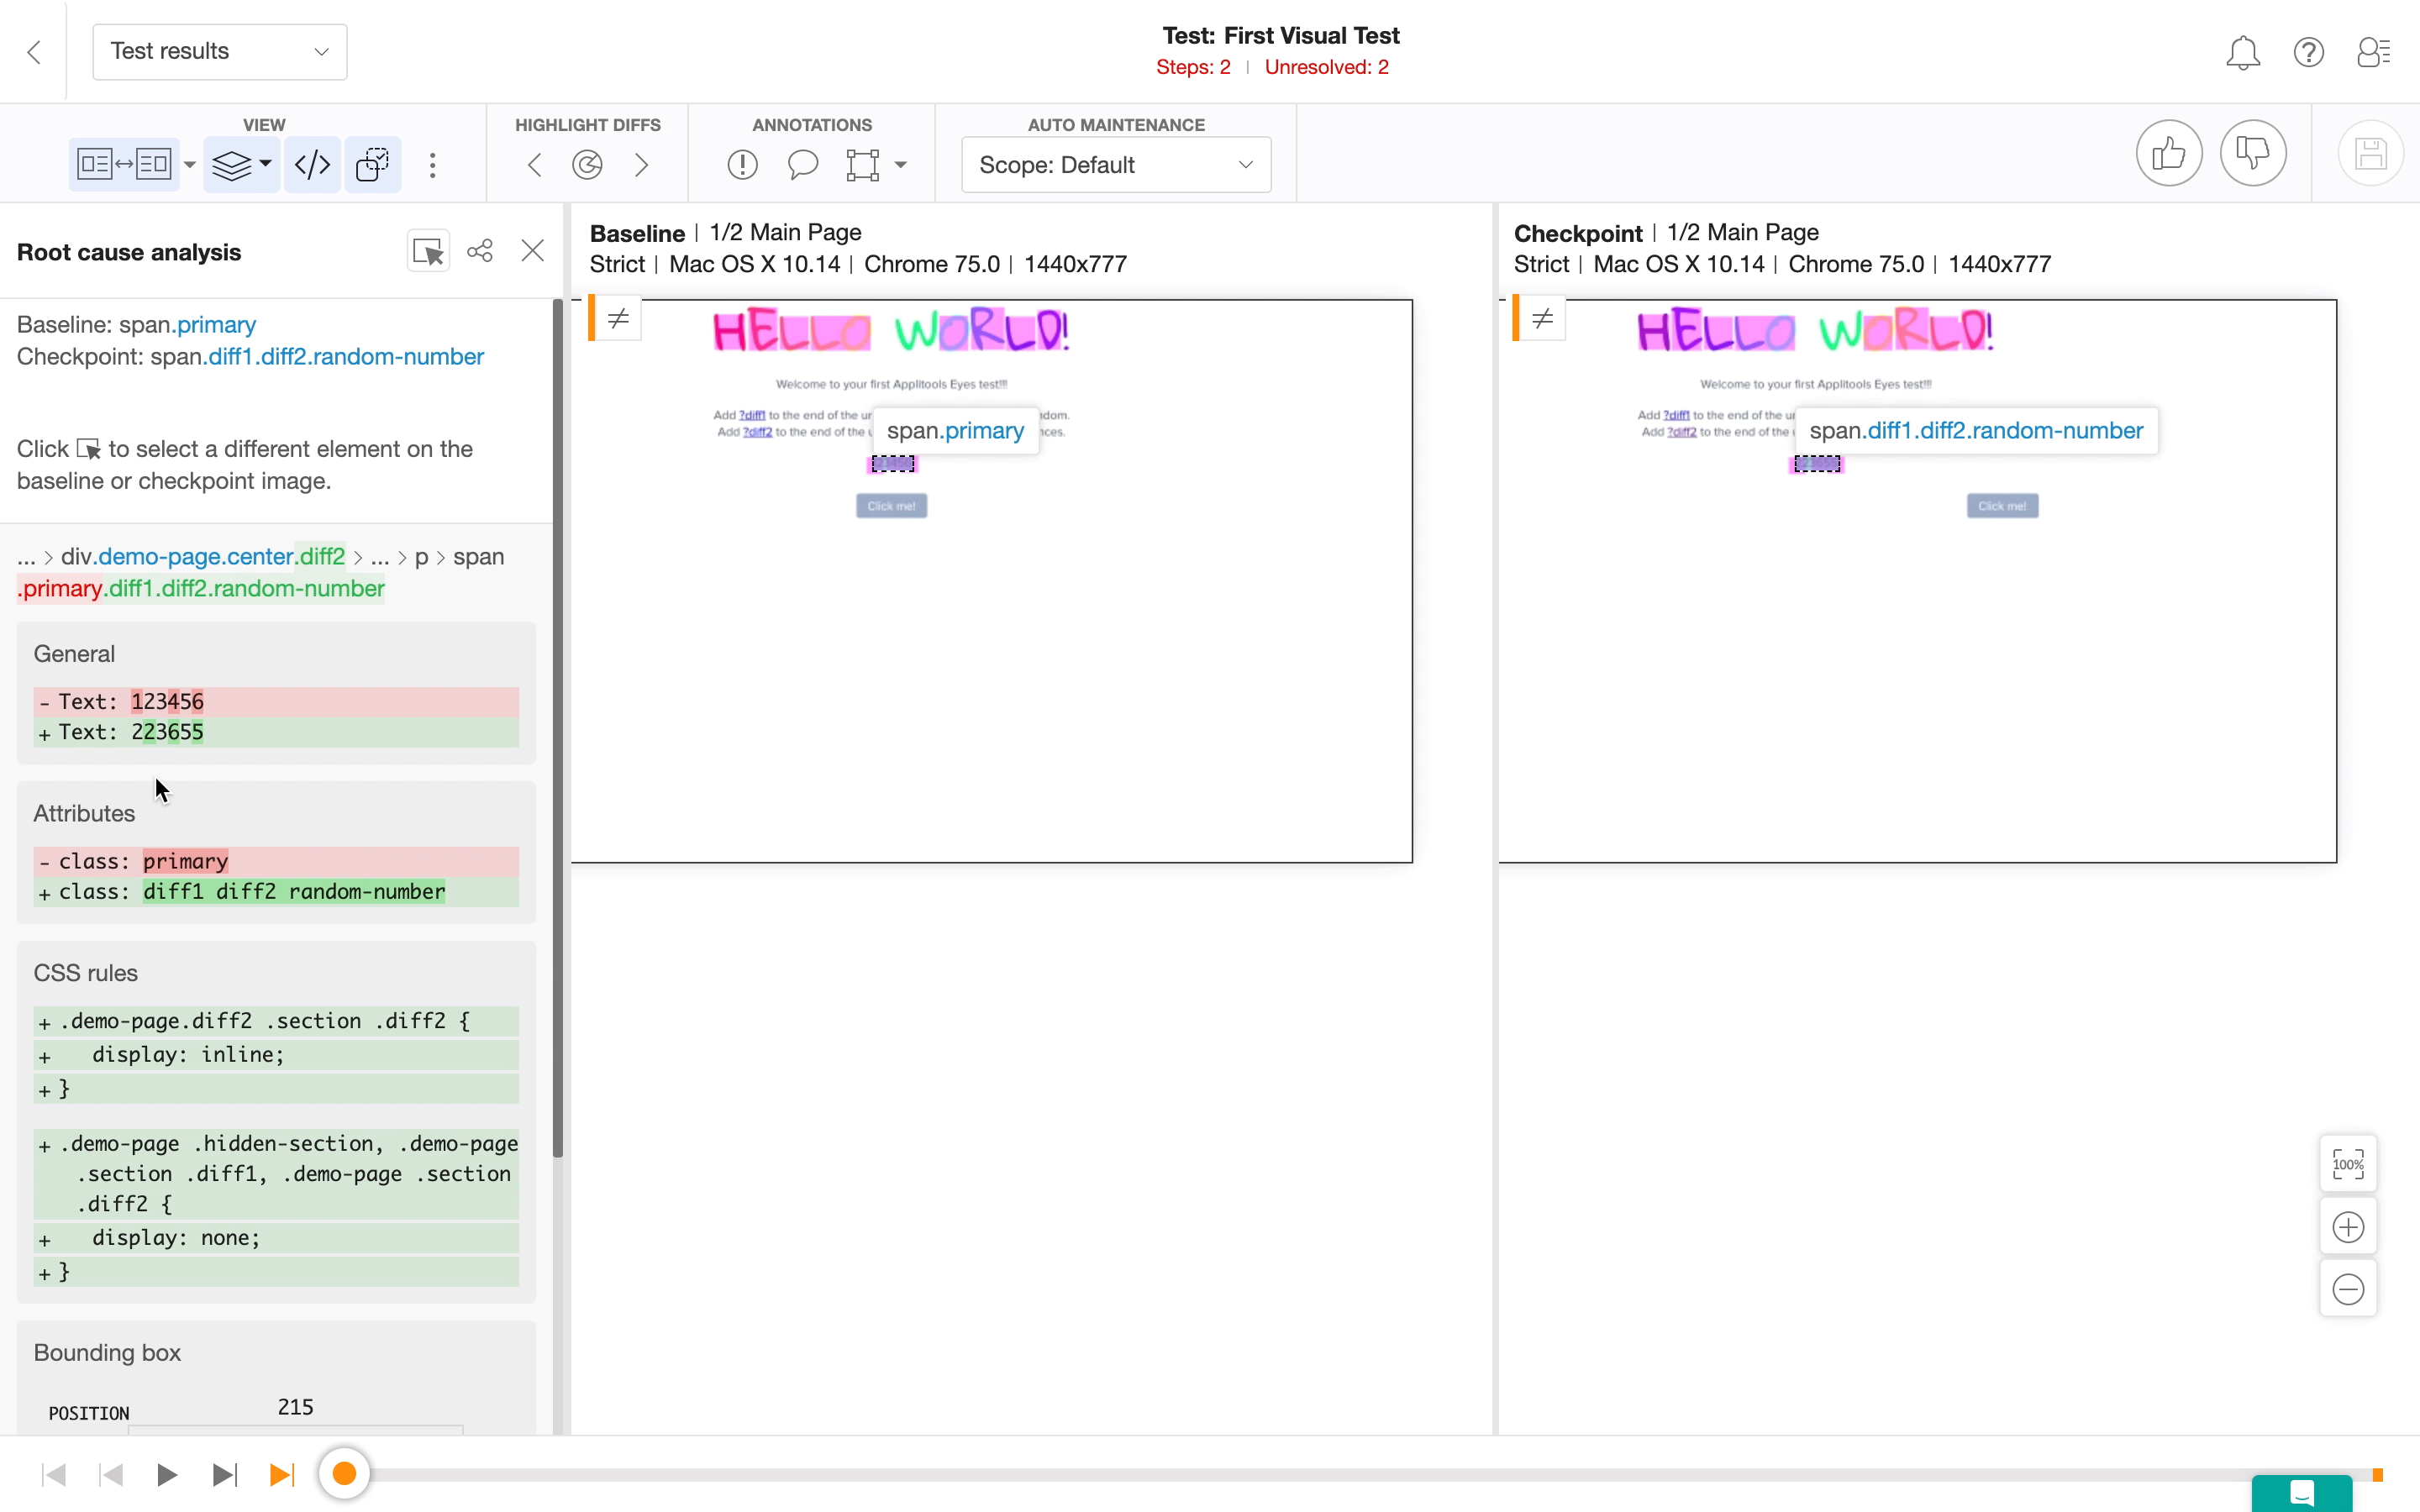
We can see that the text changed, and the classes are different — which led to the visual change in the test.
# Applitools Test Manager – Highlight Differences Section
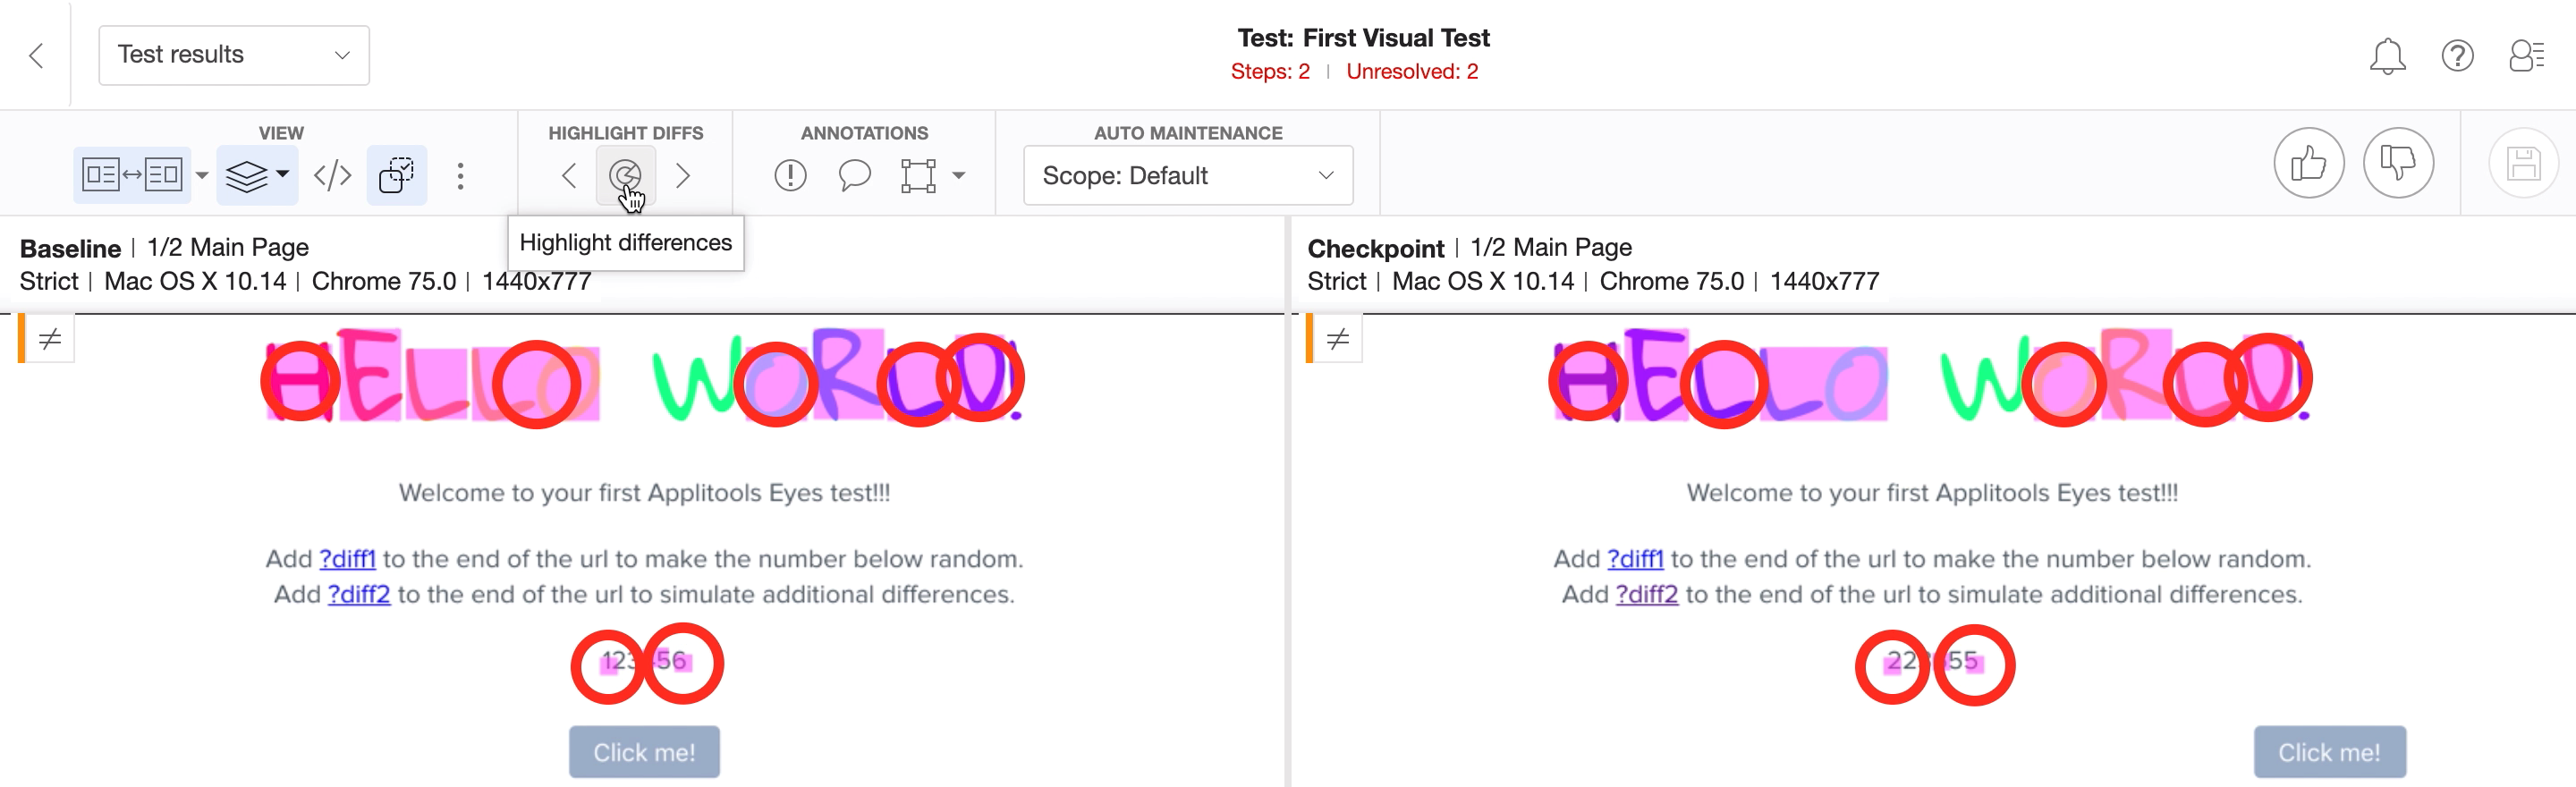
In the Highlight differences section, we also have the option to highlight the various differences spotted on the page and go through them one by one.
We also have the options to resize the image, zoom in and zoom out.
# Applitools Test Manager – Annotations Section
In the Annotations section we have the options to Add a region indicating a bug or issue, Add a remark or _Add multiple regions _for which we can choose to ignore a specific section of the page.
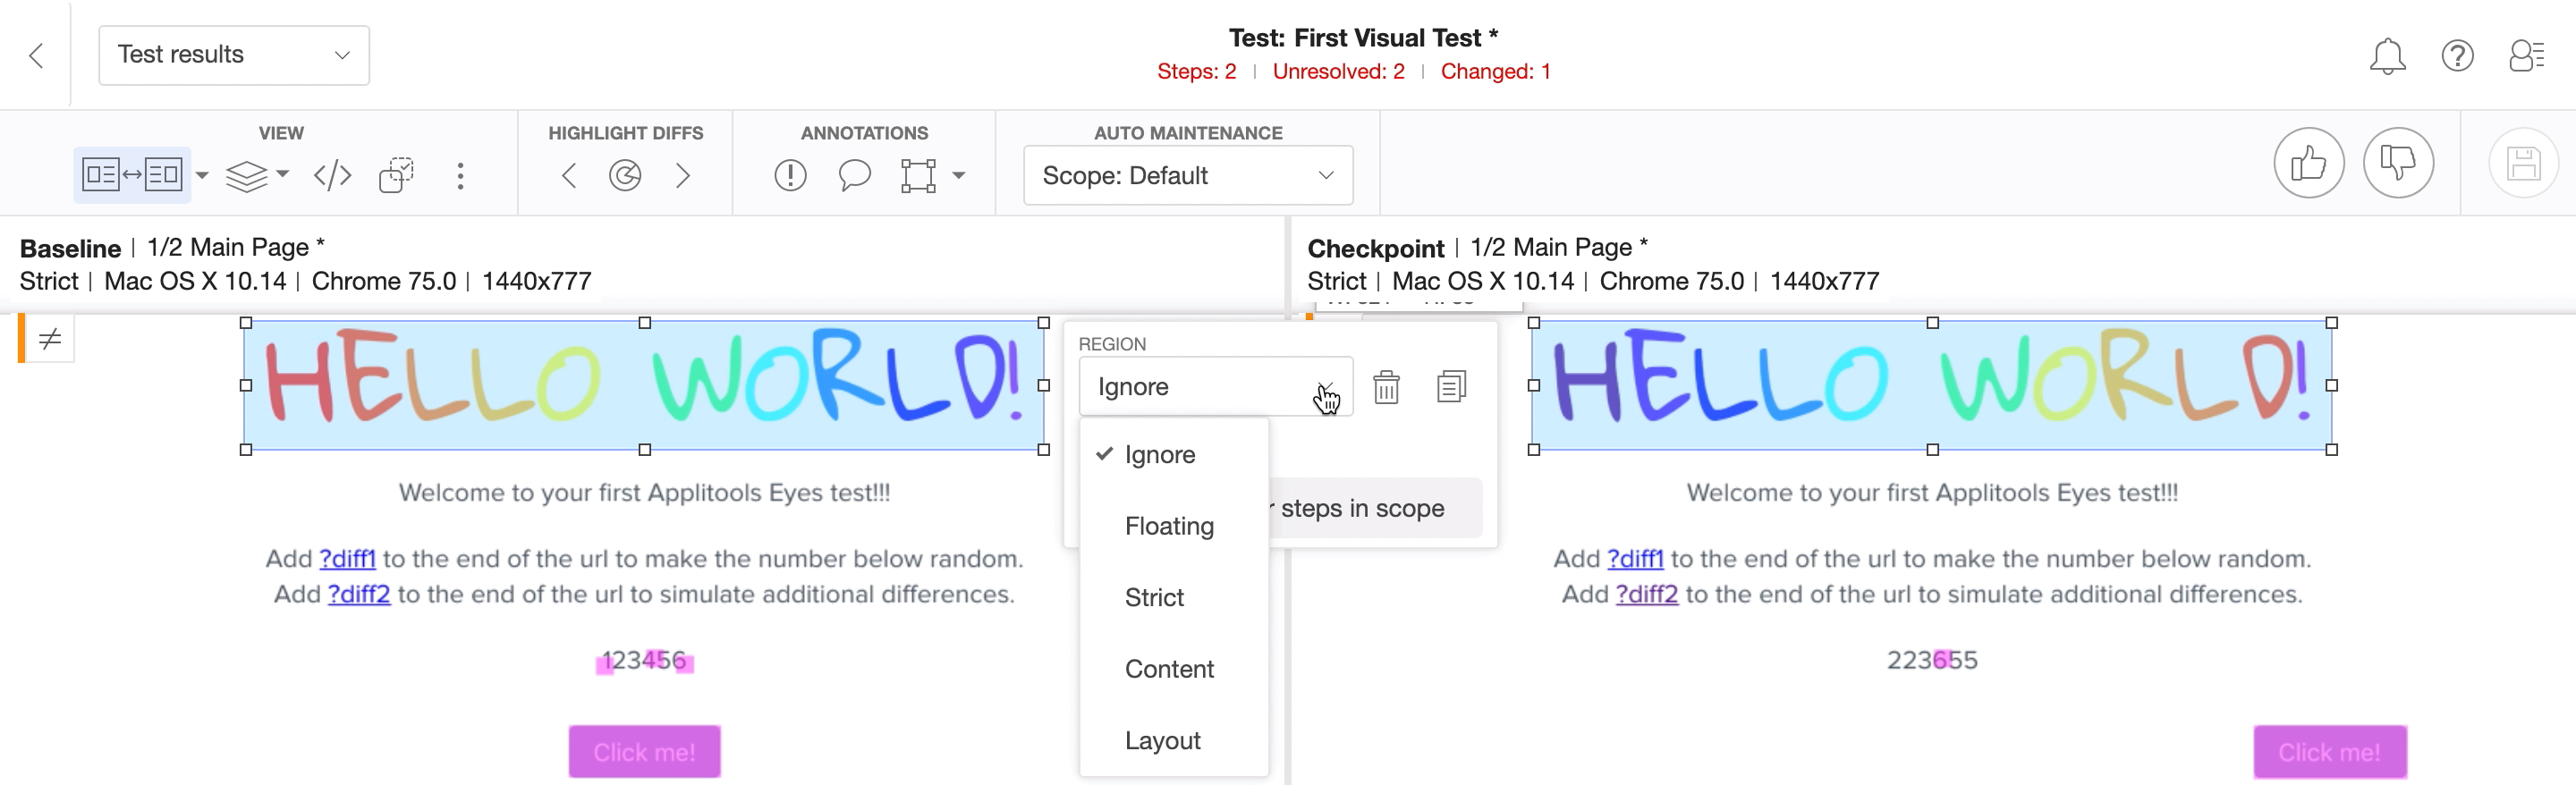
We have different match levels that we can set on the regions as well.
# Applitools Test Manager – Auto Maintenance
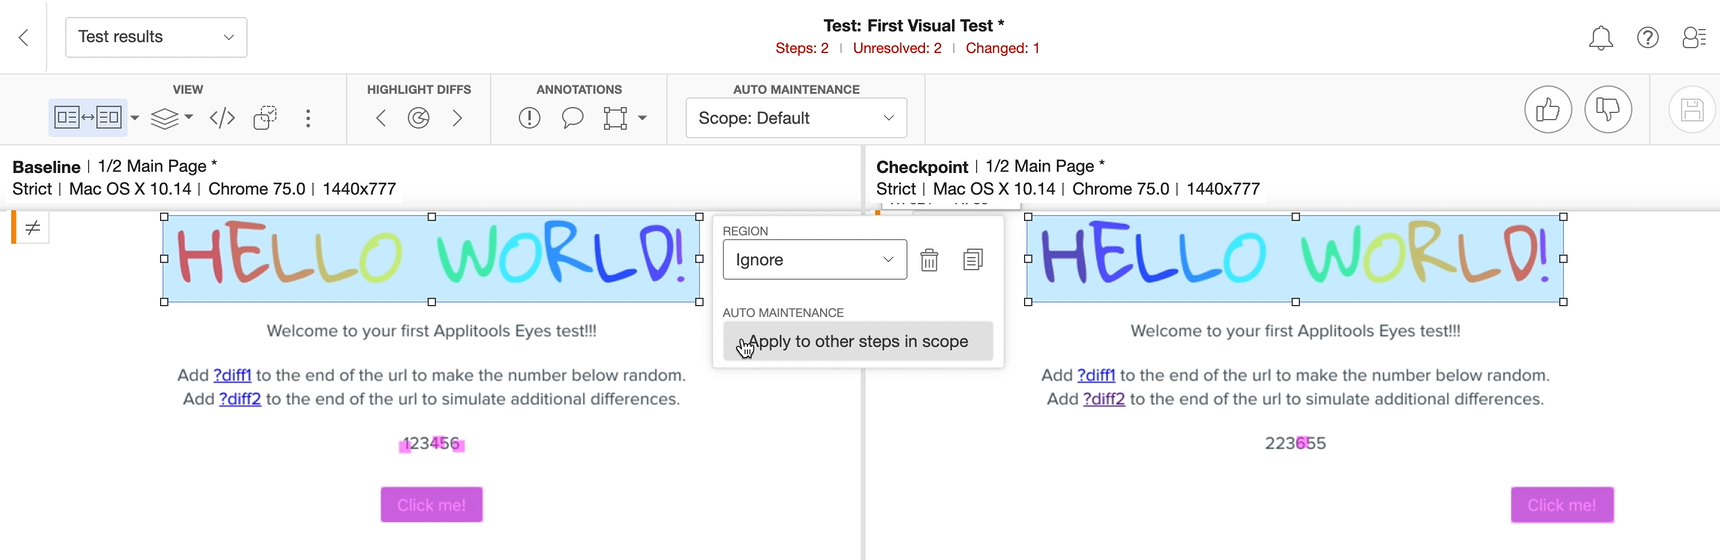
We also have the option to run A_uto Maintenance_ for our tests.
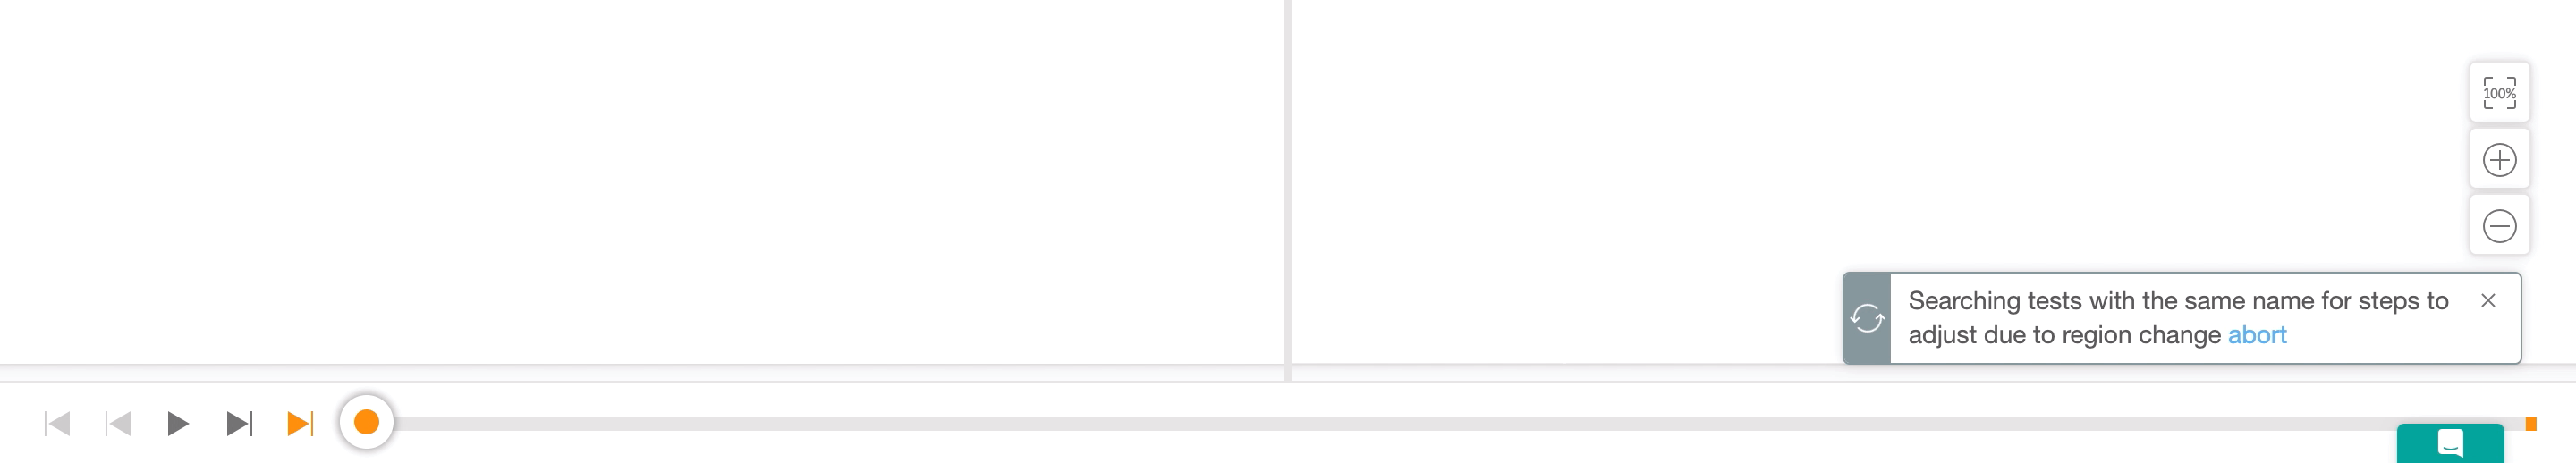
A quick example of this can be used with the region we just ignored. Let's run the auto maintenance to see if we can ignore this region of other tests that we have.
If we look to the bottom right, we can see that a pop up appears telling us that Applitools is looking for others tests which the auto maintenance can be applied to.
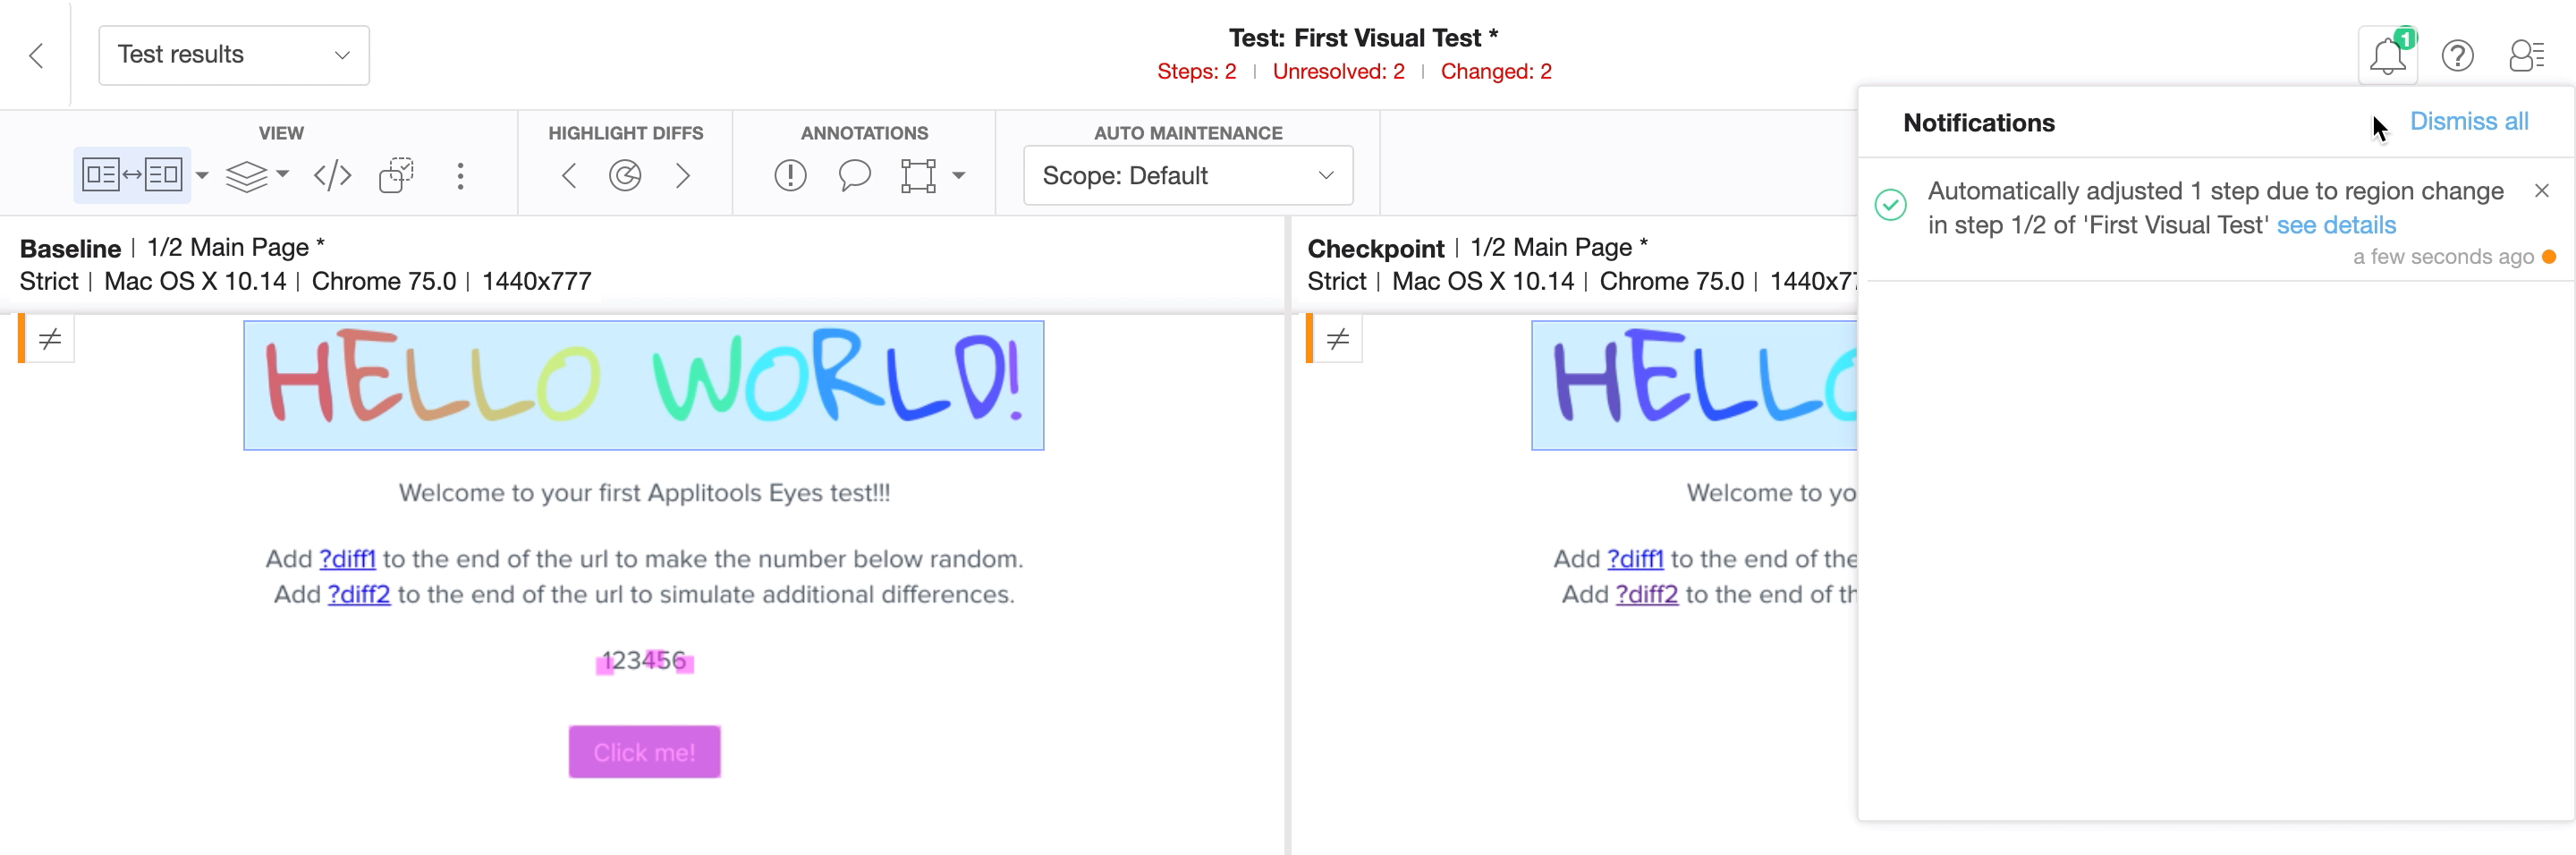
Once it's finished a notification will appear in the top right telling us what changes happened.
Let’s see the details, as we can see the second checkpoint in our test was auto updated based on the region ignore that defined.
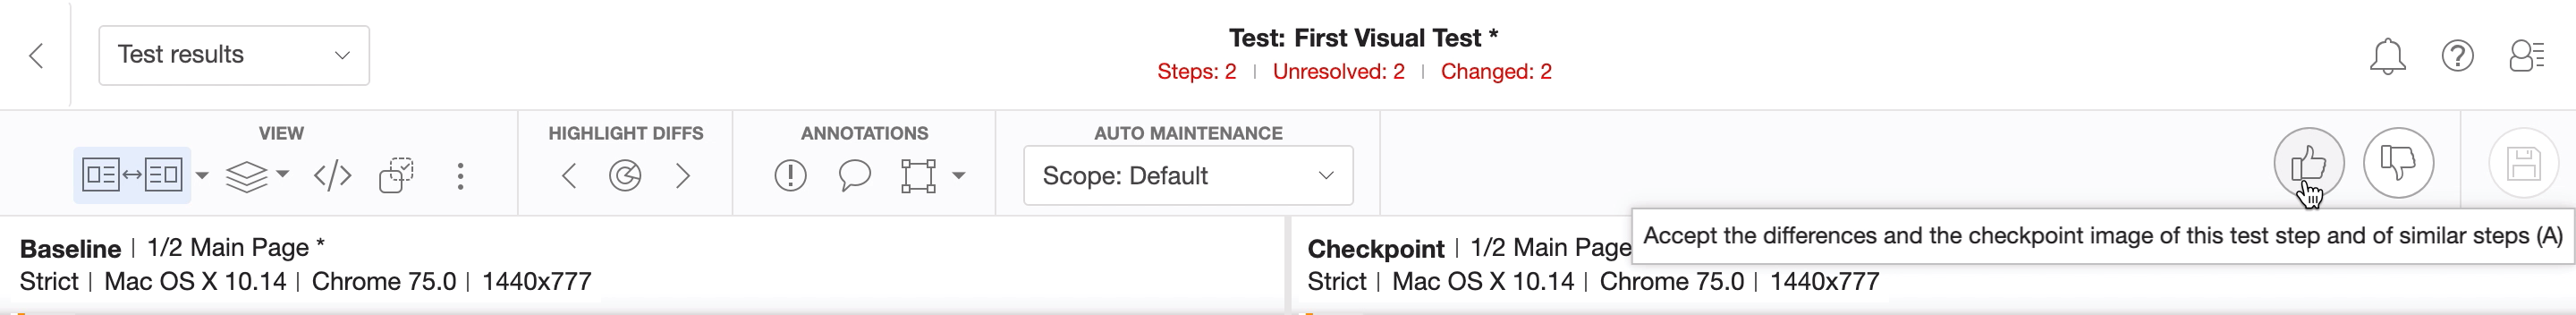
Once we are satisfied with the changes we have made in the Test Manager, we can then proceed to either accept all the changes to the baseline or reject them.
So that covers most of the basics for the Test Manager.
In the last chapter of this course will look at some of the integrations and collaborations that Applitools provide.
