

Transcripted Summary
Direct Link to Colab - https://colab.research.google.com/drive/1QvlPgNkxxDjp2n6sgcue41rjiIg1E6FO
We'll be using Python in a tool called Google Colaboratory, or just Colab for short.
Colabs are free and behave just like a Google Doc, so you can share it, put it in your Google Drive, and more.
Colabs are awesome because they have the Python environment already set up for you. Libraries are already installed, and even give you access to CPUs, GPUs, and TPUs in the cloud.
It's great for machine learning and other things.
The links and files to the Google Colab and the data sets we'll be using are provided in the resources section or on my GitHub Gist page.

I recommend watching the video first and then trying it out on your own afterwards, but that's entirely up to you.
Now, we're ready. Let's go.
All right, here we are in Google Colab.
In this example, we already have the data collected and given to us in a pretty clean and structured format.
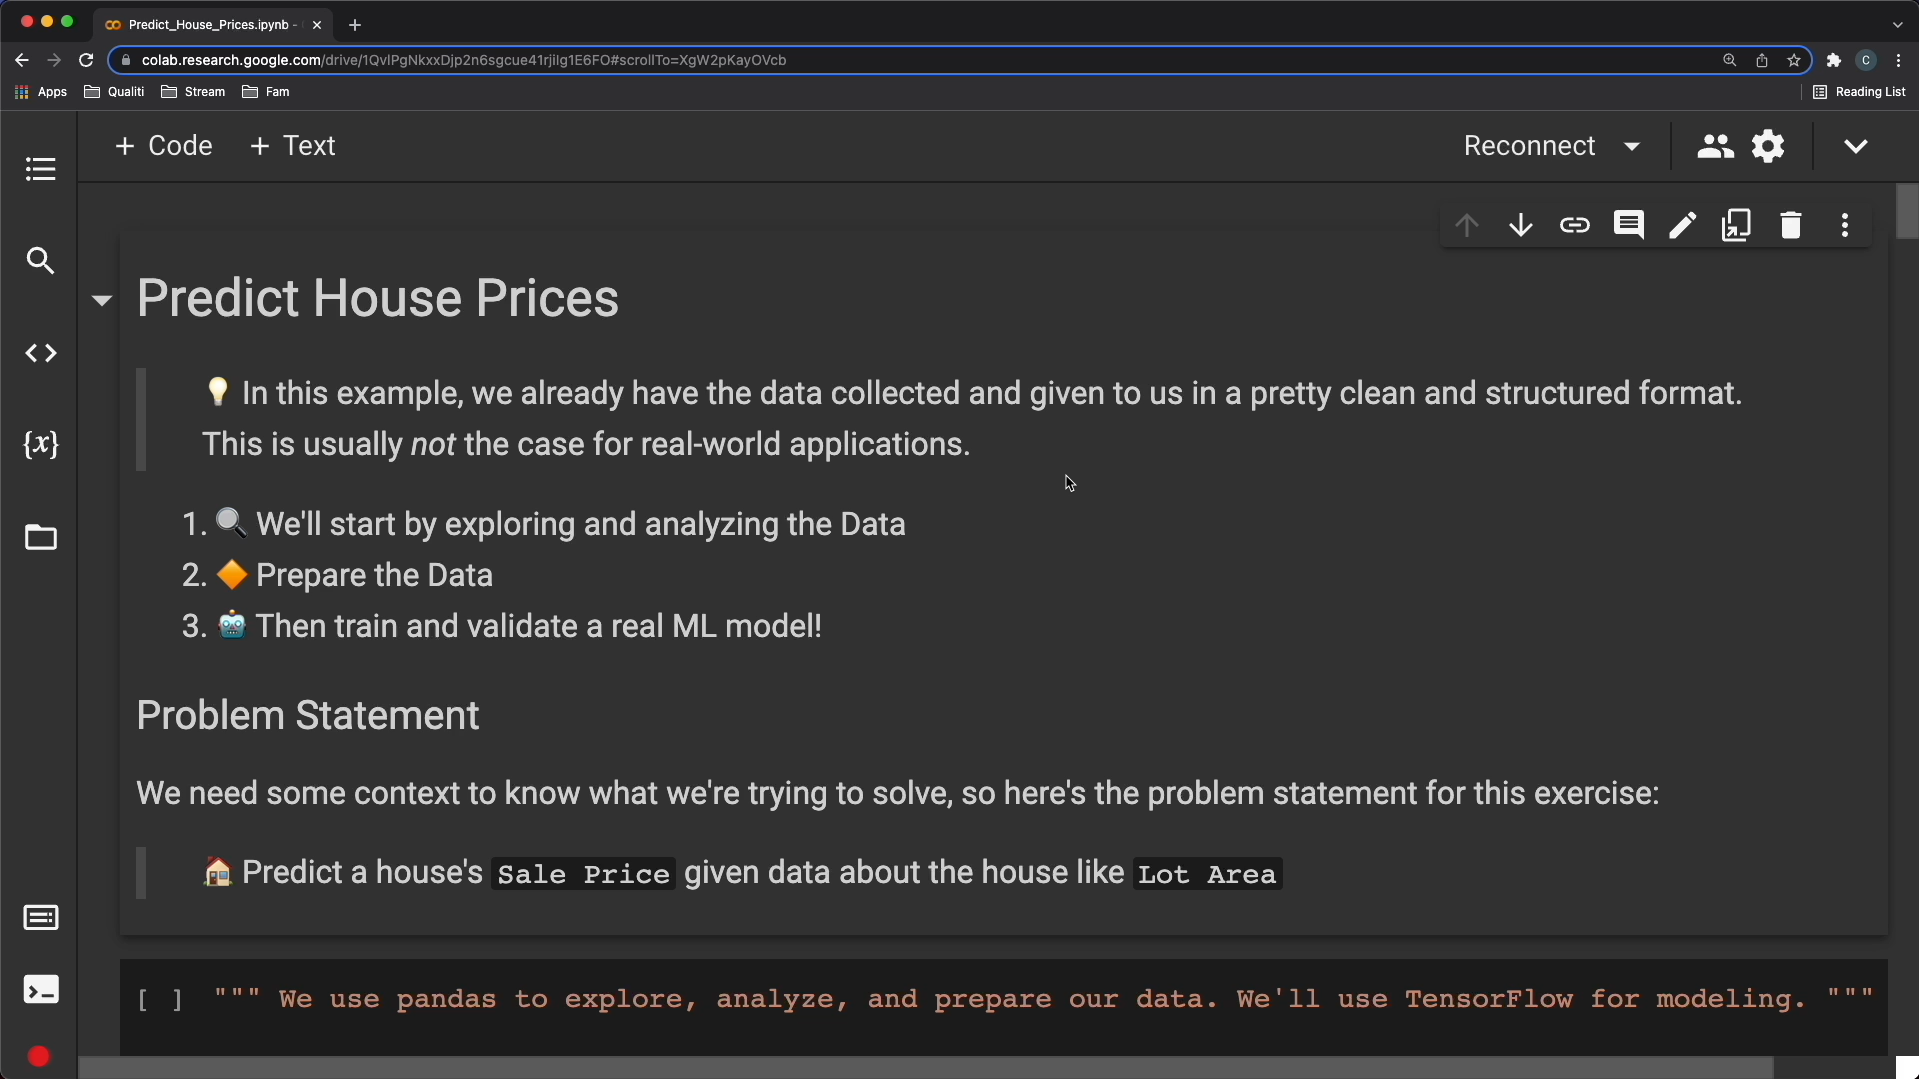
This is usually not the case for real-world applications.
We're going to start by exploring and analyzing the data. We'll then prepare the data, and train and validate a real ML model.
We need some context to know what we're trying to solve, so here's the problem statement for this exercise.
Predict a house's sale price, given data about the house, like lot area.
Let's move on to the first cell now.
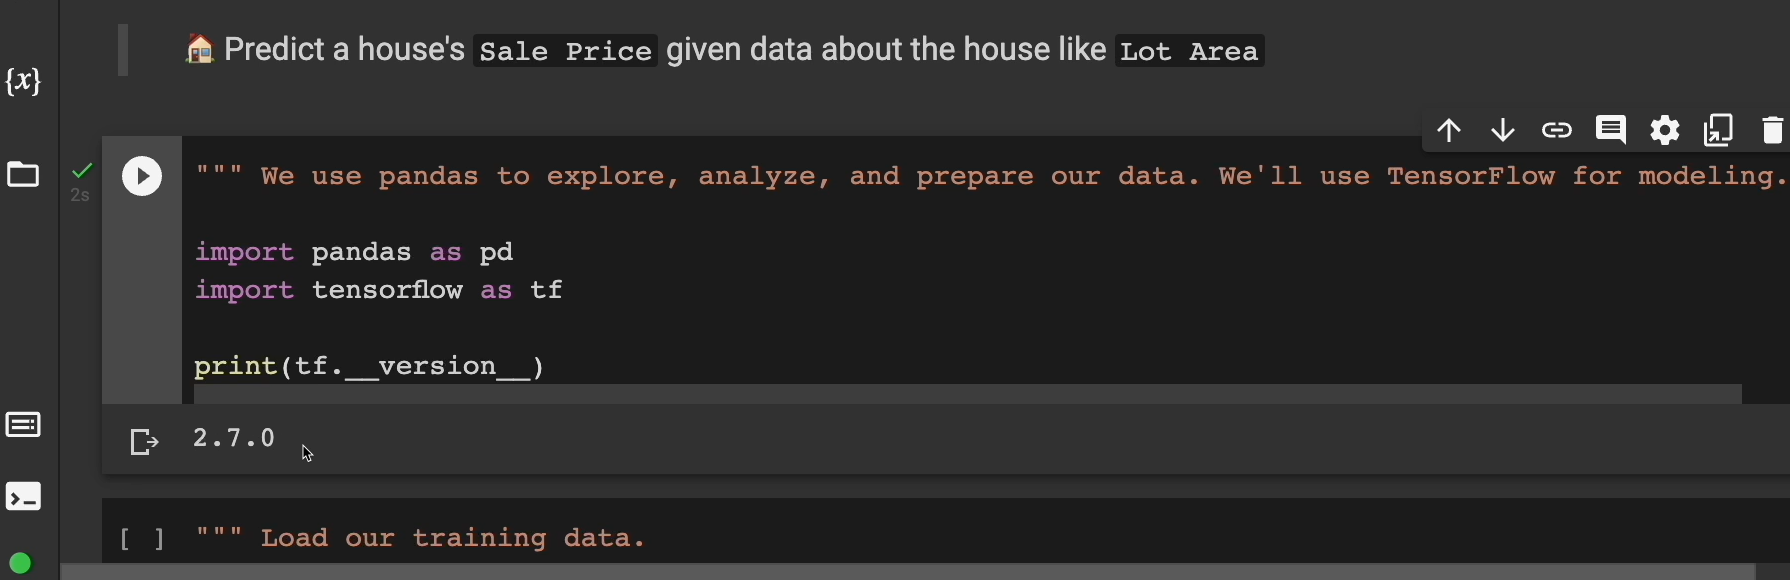
We're going to be using pandas, which is a Python library, to explore, analyze, and prepare our data.
We'll use TensorFlow for modeling.
So, click on this run button and let's run the cell.
And you can see as of this recording, we are working with TensorFlow 2.7.
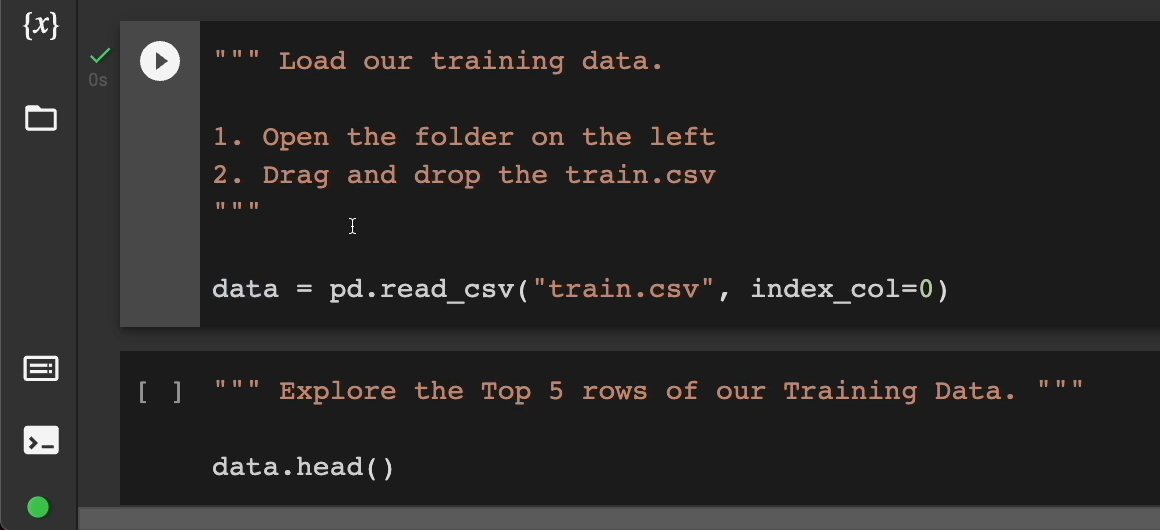
Next, we're going to load our training data.
We're going to open the folder on the left here, and then we're going to drag and drop our train.csv file into this white space here.
So let me go to my finder where I downloaded it. Here it is. I have train.csv. Click and drag. There we have it.
All right, let's load it. Click run here.
And now data has a Pandas dataframe inside of it.
data = pd.read_csv("train.csv", index_col=0)
We can explore the top 5 rows of our training data by running this cell, using data.head(). And we'll get a lot of information about the data we're working with.
Here's the top 5 rows and all these columns are the different features we're working with.
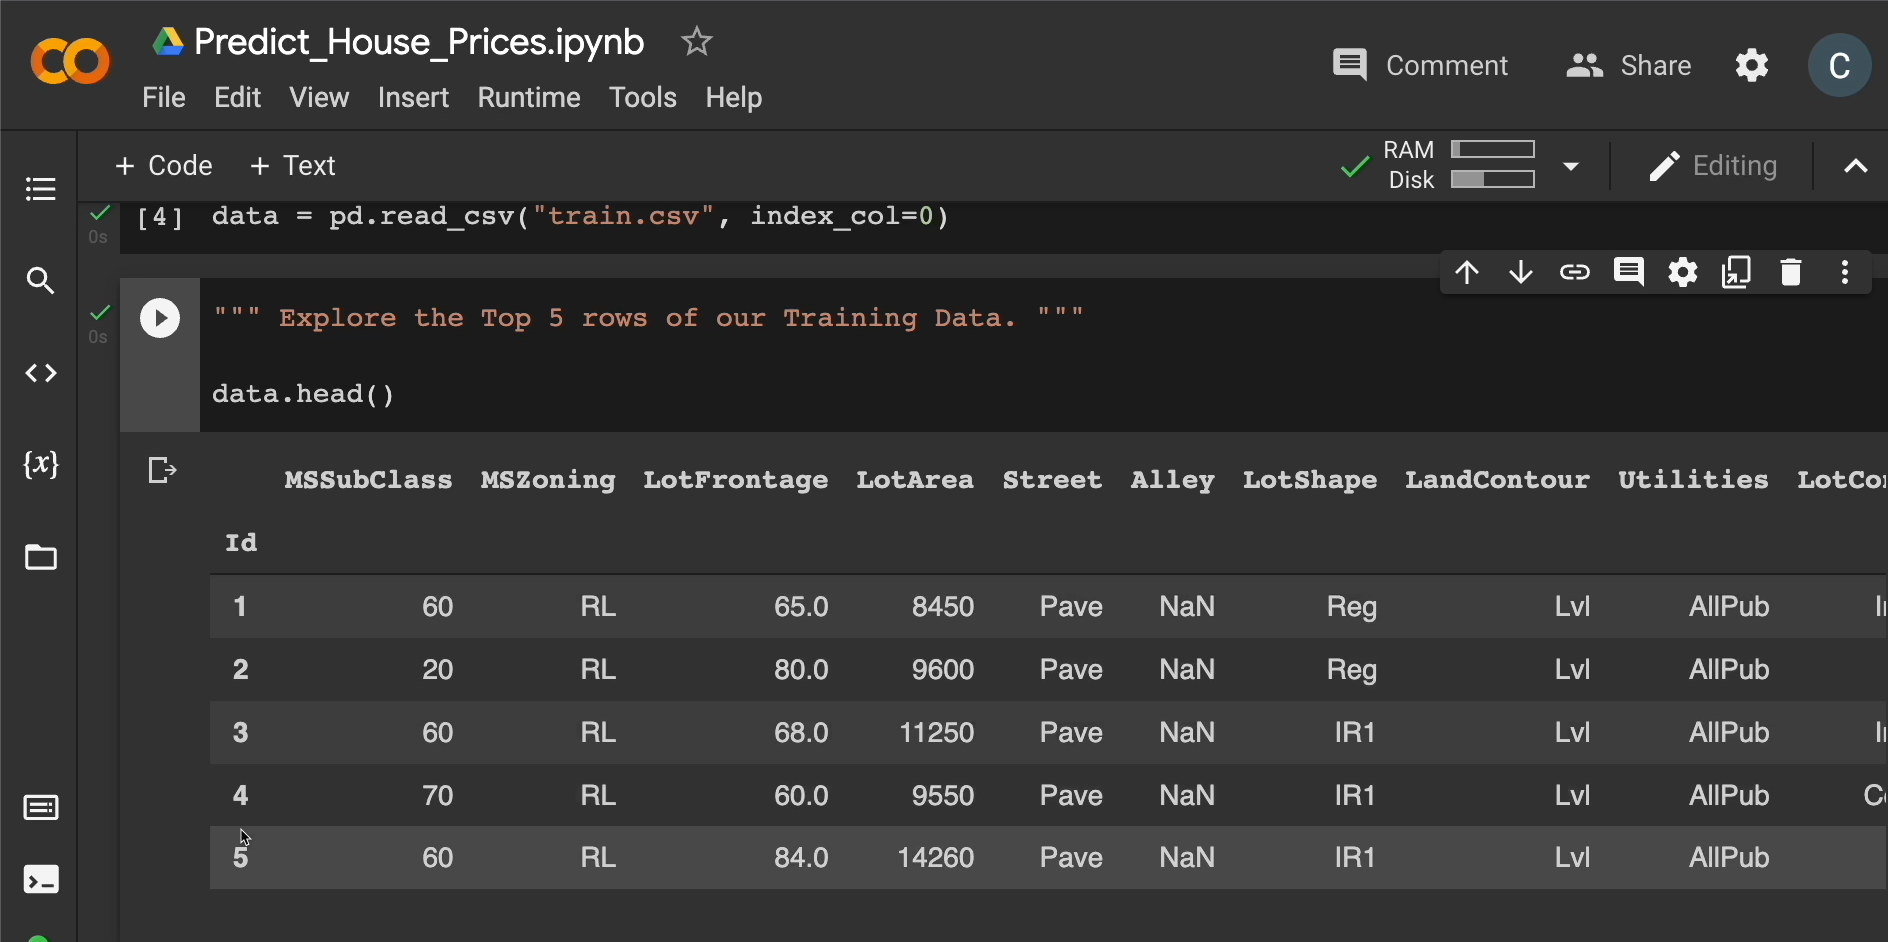
Some houses were built in 2003, 1976.
We will also notice that there are things like NaNs, which means there's no number here, no value. So, we're missing data as well.
But, goodness, we can go through here and explore quite a bit.
Moving on, we can look at our data in different ways to gain additional insights, like the average, or mean, of different columns using this data.describe method.
Click run here and you'll see what I mean.
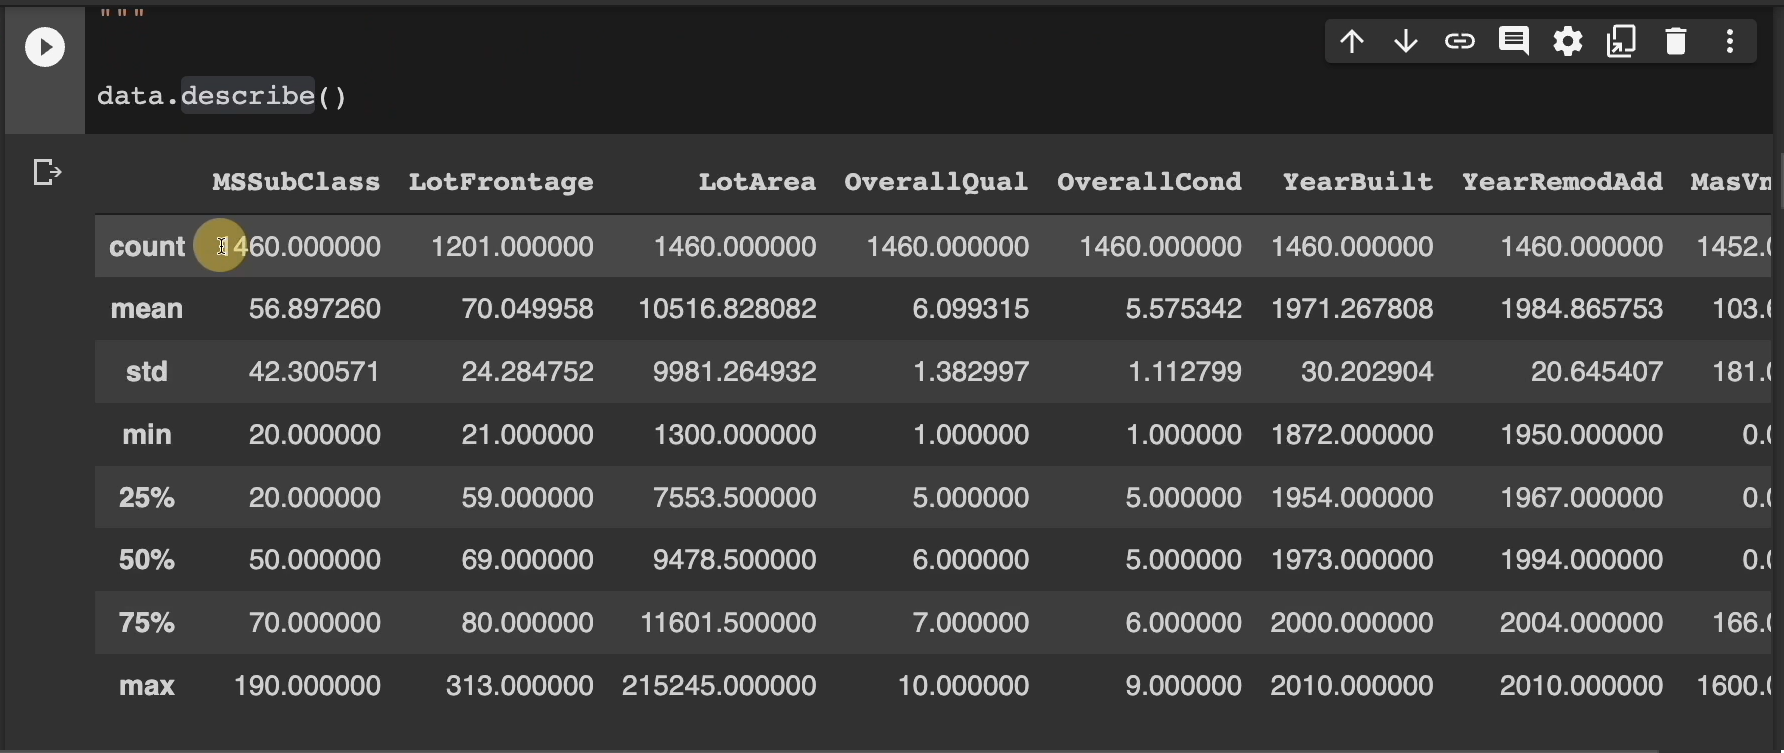
Each column now has different metrics shown, like how many are there here.
The mean, or the average, for all the values in this column. Standard deviation.
What's the smallest value in this column? What's the highest value in this column?
And all this information for everything we see in here.
Moving on, we can display a list of all the columns we currently have access to using data.columns.
We need to decide which should become our features and what should become our labels.
So, let's run this cell and, sure enough, you see there's quite a bit of information we get to work with.
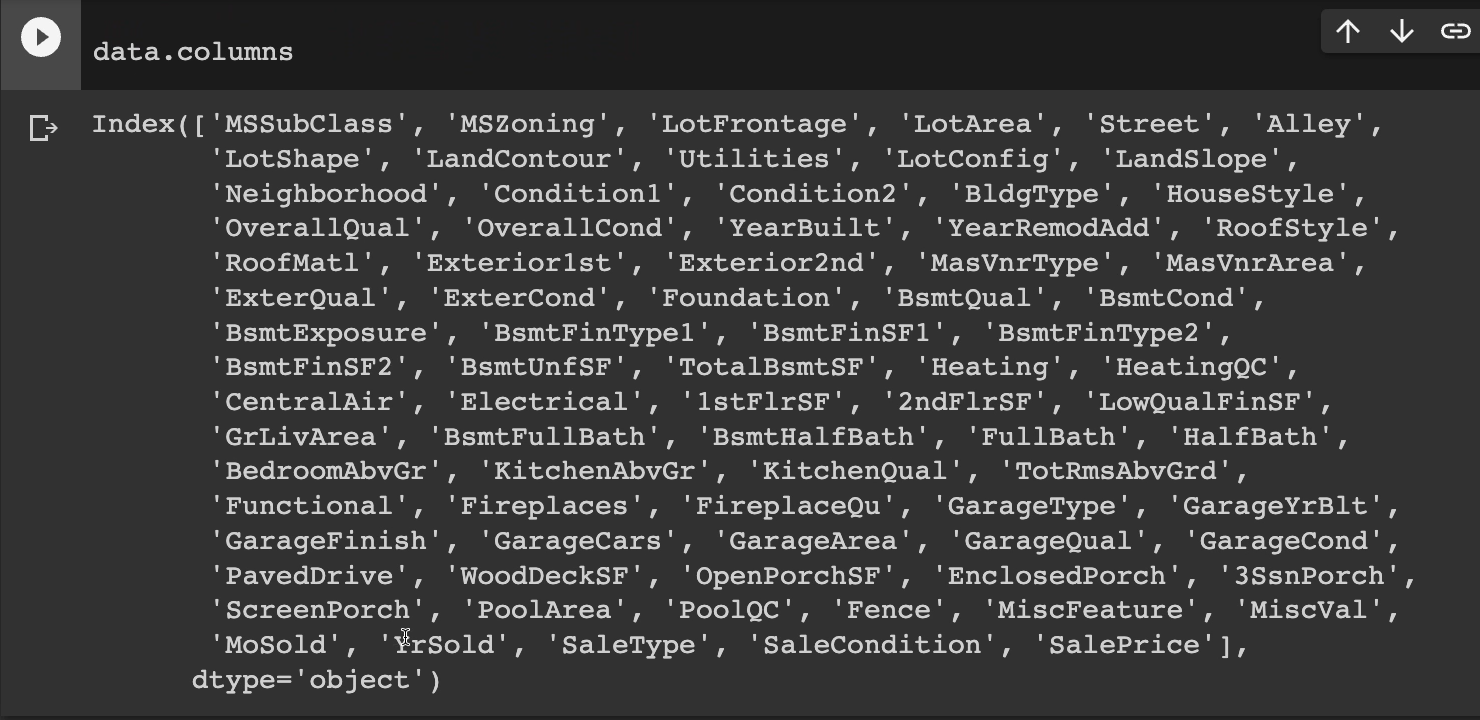
For our label, we're probably going to want the sale price, right, since that's our problem statement. We want to predict the house price. We want to predict the sales price.
So, “SalePrice” is going to be our label and everything else would be our features, but which ones we want to use?
Do you just use all of them? Let's keep moving on.
Next up we want to prepare the data.
This is where terms like feature engineering happen.
In this example, the data is pretty clean, structured, and straightforward, so there's not too much more to be done here.
Let's define our features and labels and prepare them for training.
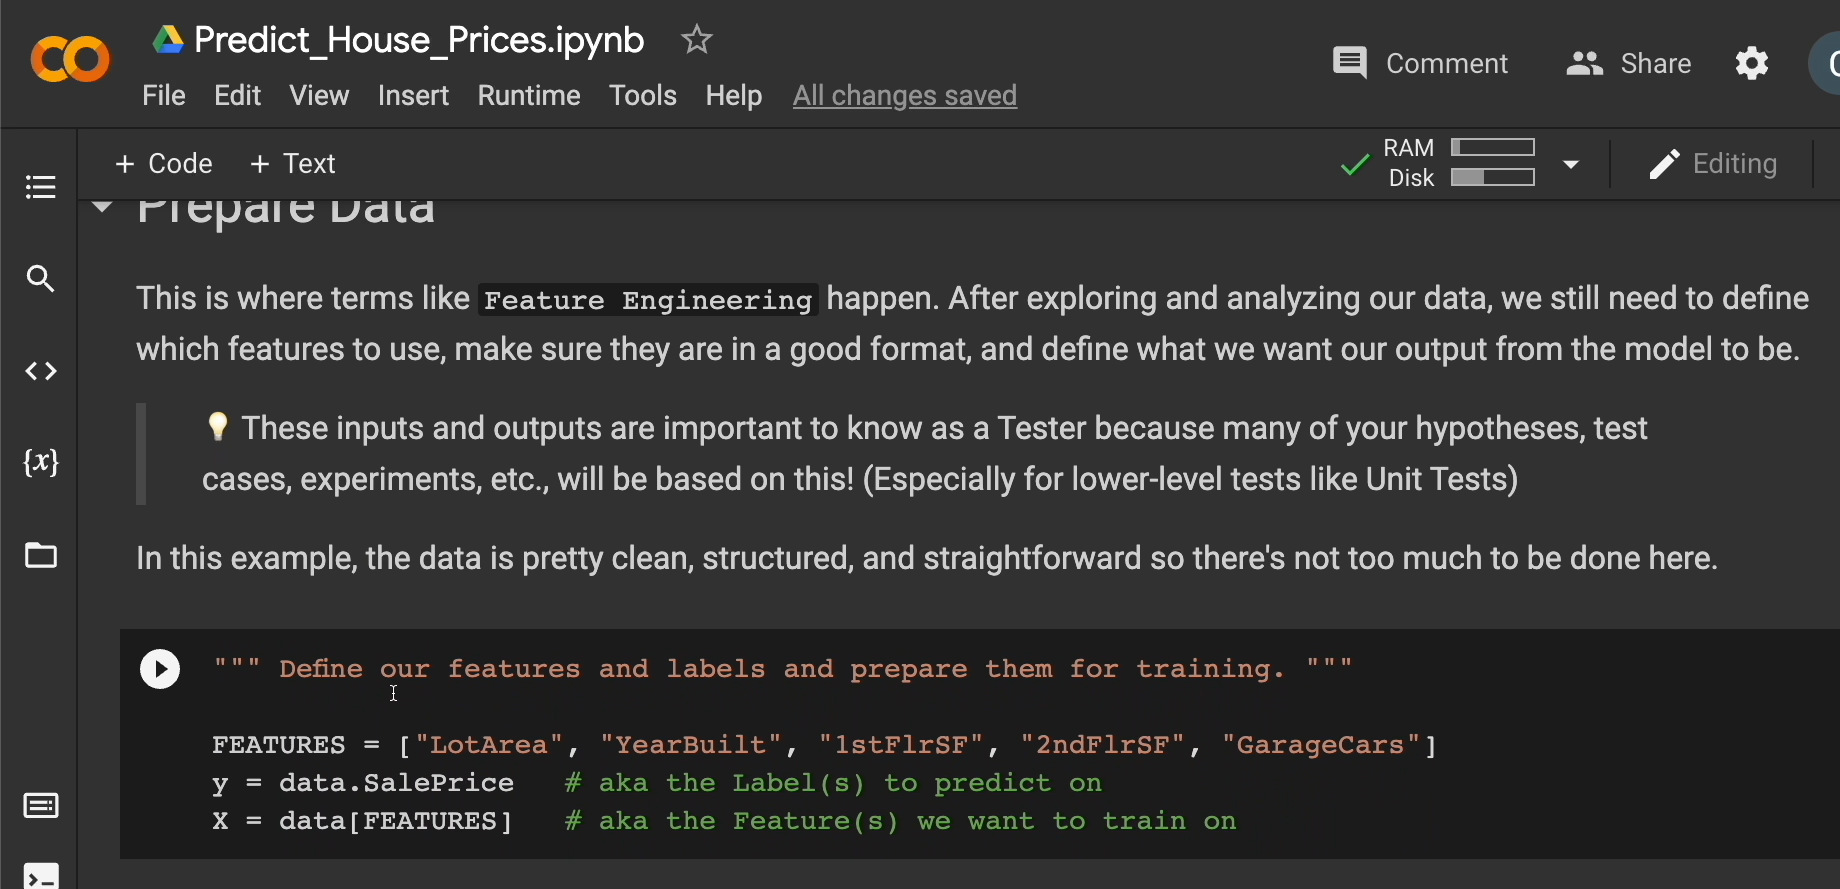
For the features, let's use these 5. We'll use lot area, the year it was built, the first-floor square footage, second-floor square footage, and how many cars can you fit in the garage.
We'll define our Y — the Y is the labels to predict on.
In this case, it's going to be our sale price.
Then our X would be the features we want to train on.
And we're going to say data, give me just these features.
FEATURES = ["LotArea", "YearBuilt", "1stFlrSF", "2ndFlrSF", "GarageCars"]
y = data.SalePrice   # aka the Label(s) to predict on
X = data[FEATURES]   # aka the Feature(s) we want to train on
Let's run this cell to make sure we get those variables defined.
And scroll down, because now it's training time.
This is where terms like Parameter Tuning happen.
Testers may help the least here, depending on how much ML they actually know. But nothing stops you from pairing, ensembling, or asking questions. I recommend collaborating and integrating with your team as much as possible.
All right, scrolling down. Let's keep moving on.
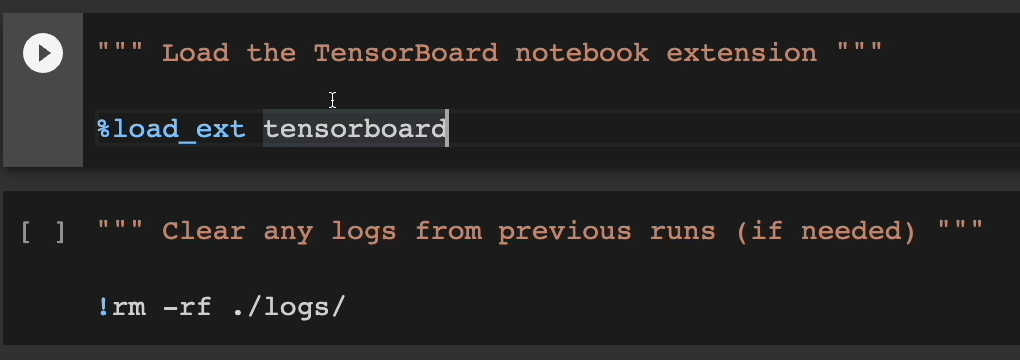
We're going to use tensorboard here to visualize some of our results.
So run these 2 cells real quick.
Next up, we're going to go into modeling.
You don't need to know what's happening here too much.
Let me comment out this one line real quick.
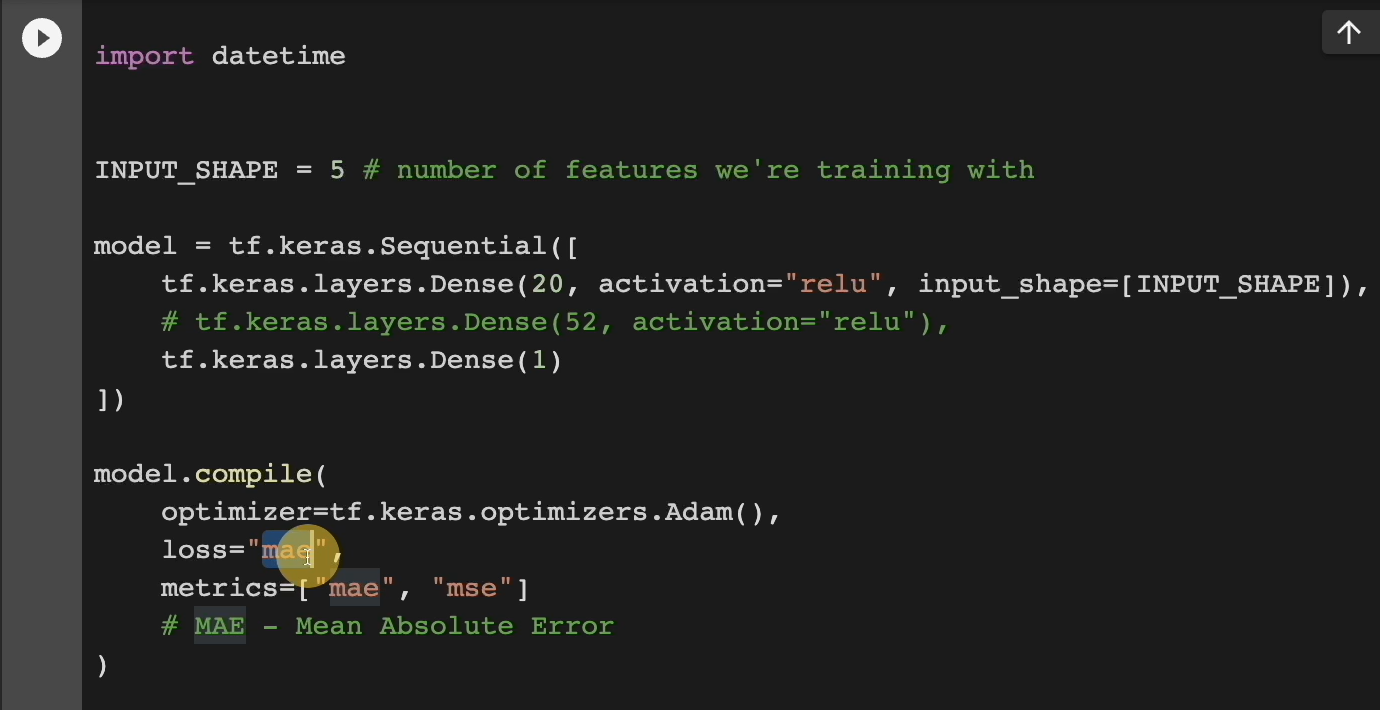
Just know that we have a neural network with 20 neurons and we're going to pass our training data into this.
We're going to be using the mean absolute error (“mae”) as our loss.
This means how far off our prediction was from the actual. So, if a house is $300,000 actually, and we predict $400,000, the MAEs going to be $100,000. We were $100,000 off.
But don't worry too much about what's going on in here. This is very much machine learning code.
So just click run for now.
Scrolling down, we're now going to train, aka “fit” and evaluate the model.
We're going to have it go over 5 EPOCHS, which is almost like 5 rounds of training if you will.
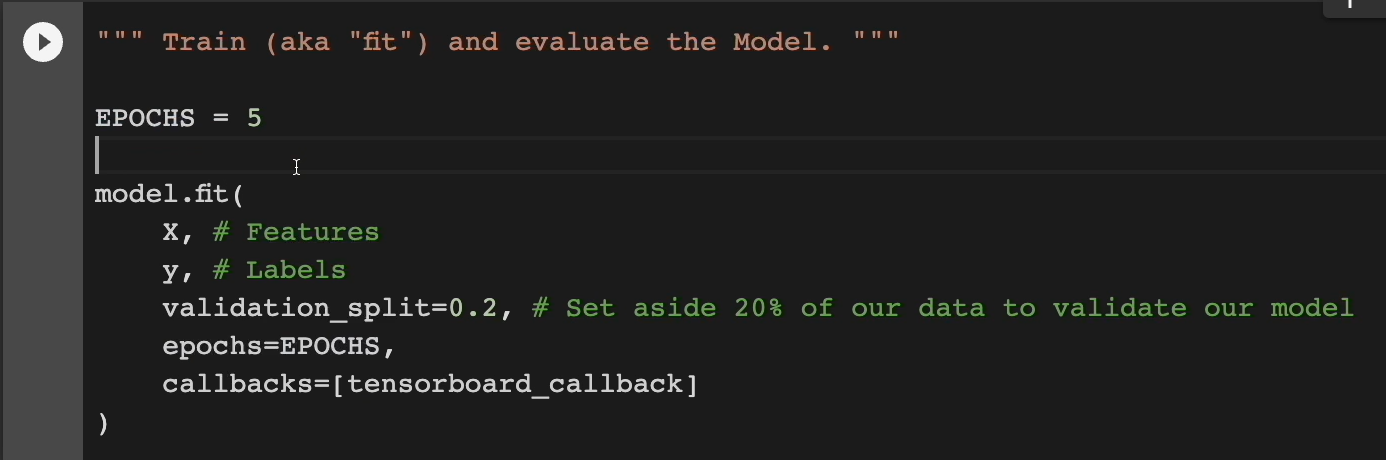
We're going to pass in our features, our labels. And then we're going to set aside 20% of our data to validate our model, and 80% is going to be used for training.
EPOCHS = 5

model.fit(
    X, # Features
    y, # Labels
    validation_split=0.2, # Set aside 20% of our data to validate our model
    epochs=EPOCHS,
    callbacks=[tensorboard_callback]
)
Let's run this and go through the 5 iterations.
Ooh, that was pretty quick because we're not dealing with a lot, but let's see how well we performed so far.
We get some metrics here. For example, we see the mean absolute error and the first time it went around, it was $181,000 off. And after five Epochs, hey, we got a little bit better.
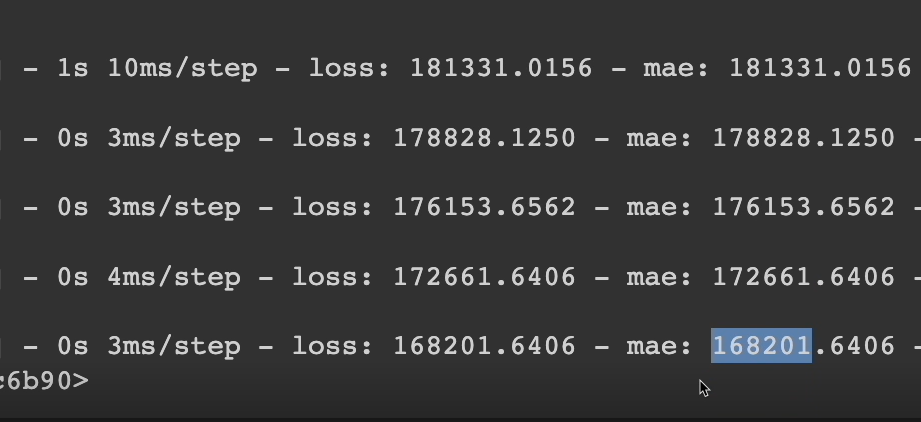
We're only $168,000 off on average, which for house prices still isn't very good.
Well, let's move on for now.
Let's visualize our training and validation and we're going to use TensorBoard to do so.
So run this cell. We're going to take a little bit to launch this tensor board, but you'll see the visualization I'm talking about.
It loads this and we're able to see the training.
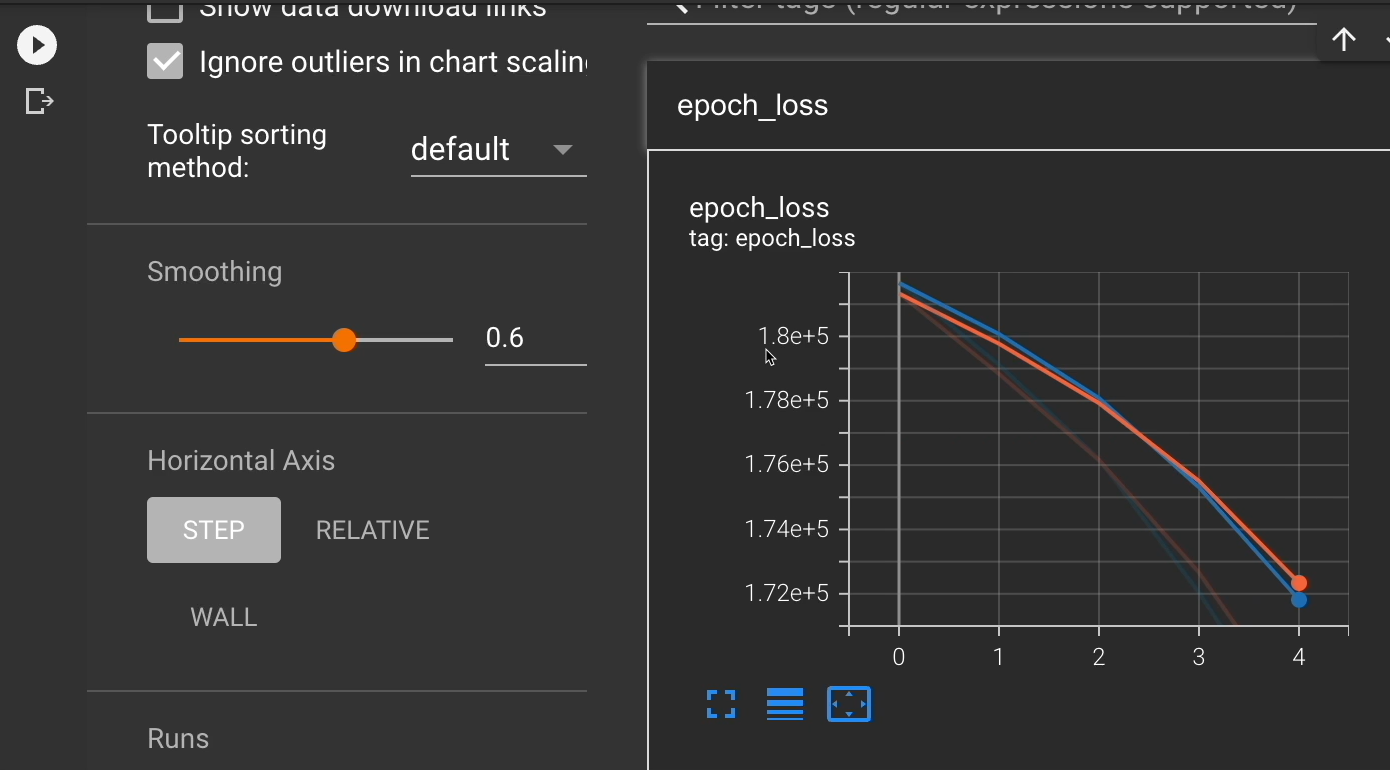
Notice how we were here in our error. And after 5 iterations we got down to here.
Now, nothing is really flat lining. So, I could hypothesize that if I were to train for more Epochs, I would continue to get lower and lower loss, aka, better and better results.
We'll keep scrolling down for now, so that we can test the model here.
Once training and validation are in a solid state, there will be a trained model, or models, ready to be tested past the training data.
You know what that means? You can hit the model with all the testing skills you got.
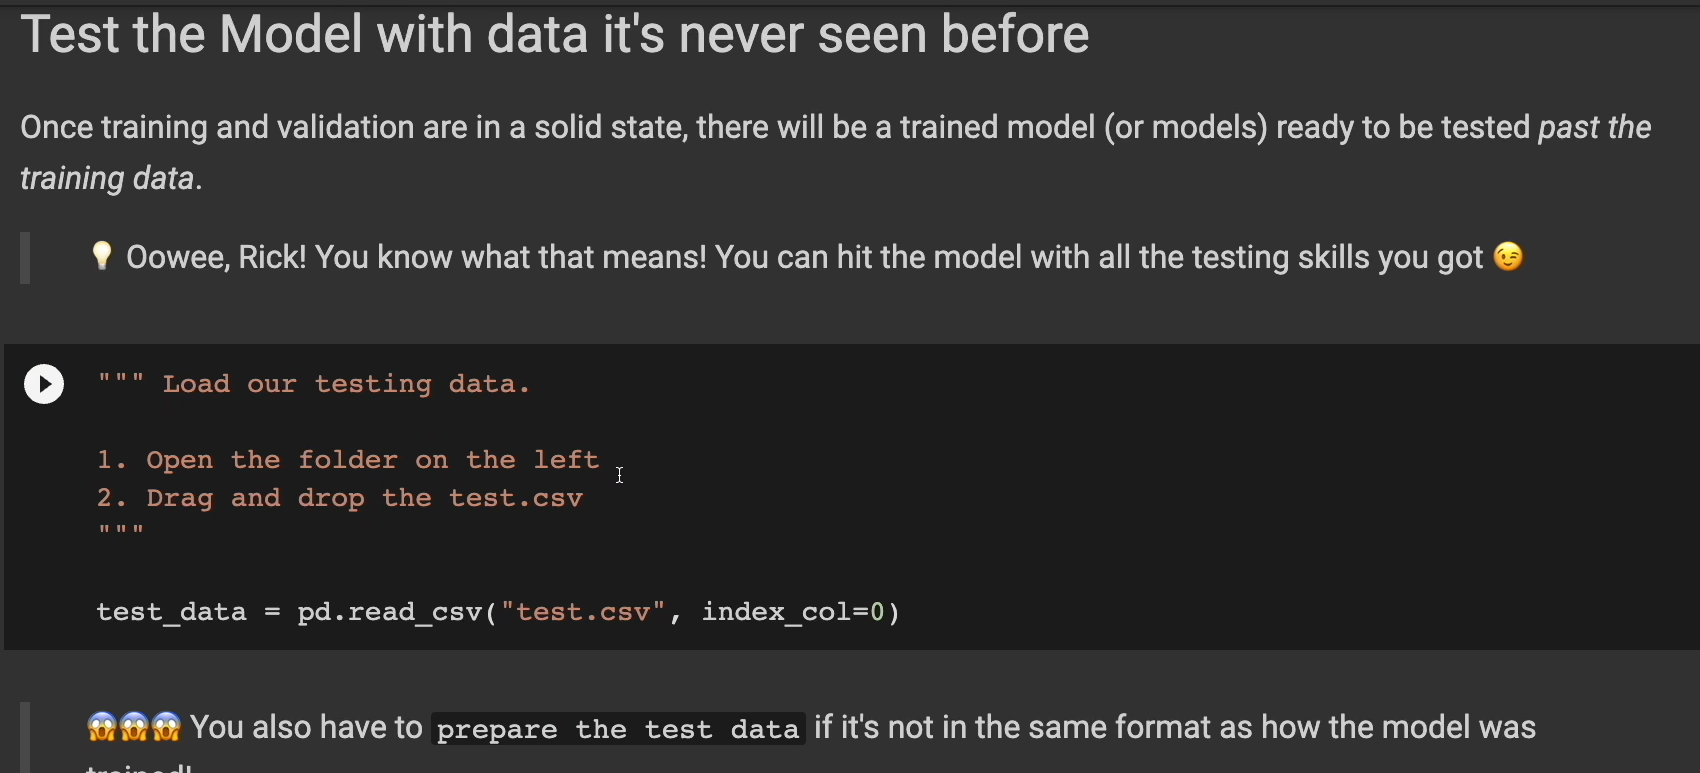
Let's load our testing data now.
We'll do the same thing where we open this folder here, and then we grab our testing data. Here's this test.csv.
Click and drag over here, wait for it to load. There we go. And run the cell to load it in.
It's good to note that you also have to prepare the test data if it's not in the same format as how the model was trained.
So here let's get our test data ready. We're going to use the same features.
test_X = test_data[FEATURES]
Run the cell.
Now we can make predictions against our test data.
Let's use the model.predict function to make these predictions.
predictions = model.predict(test_X)
Run that.
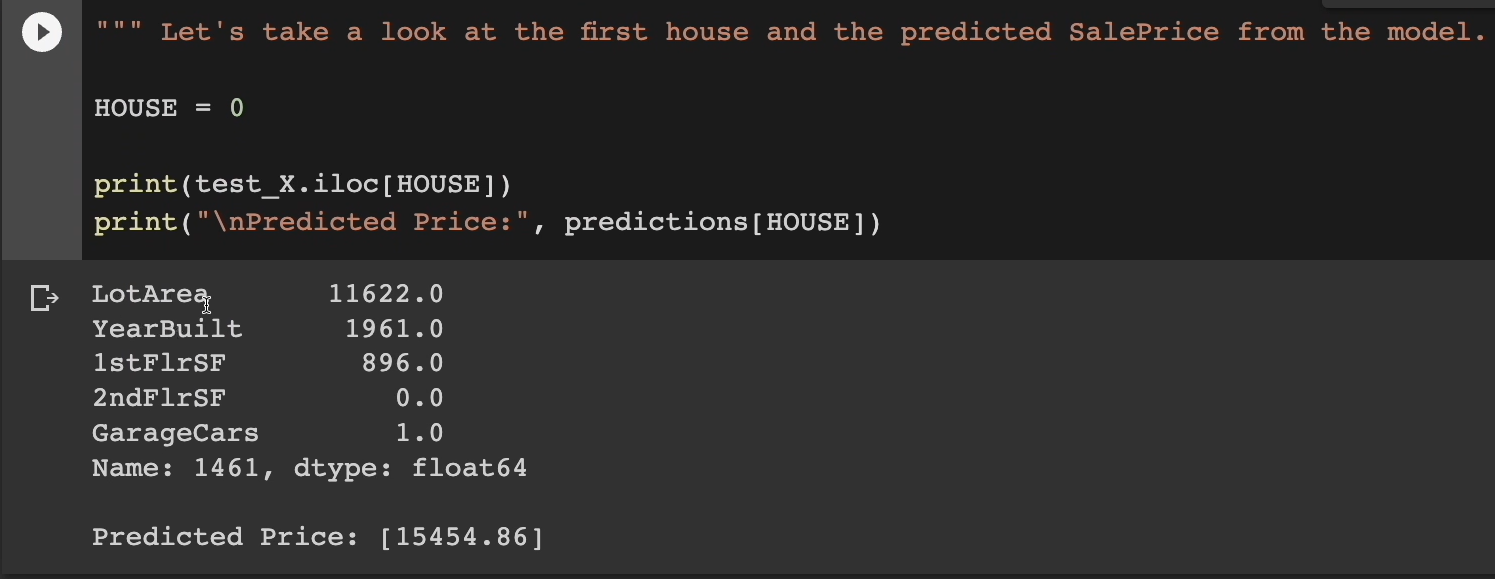
Let's take a look at the first house and the predicted sales price from the model.
HOUSE = 0

print(test_X.iloc[HOUSE])
print("\nPredicted Price:", predictions[HOUSE])
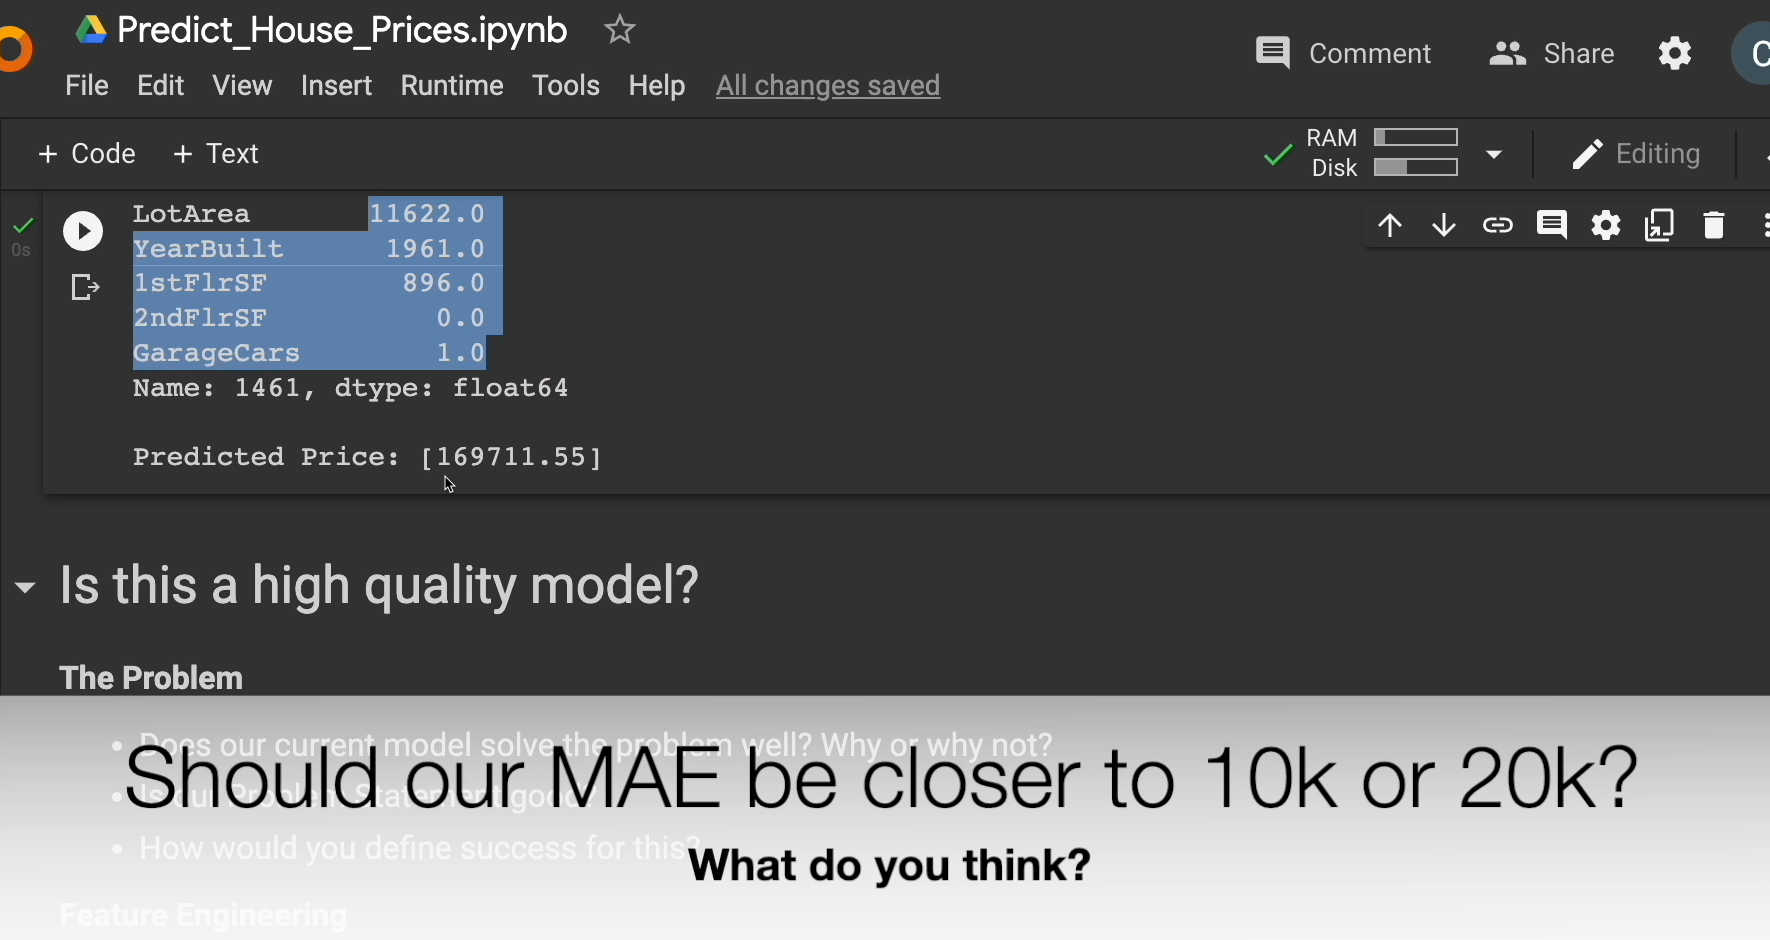
We're going to look at the 5 features, the information about this house.
Here we go.
The lot area. We can see the year was 1961 that it was built. It doesn't have a second floor and they have a one car garage.
In this case, the model is predicting that the price of this house will be $15,454.
Now is that a good prediction? I actually don't know. That maybe a little low. Maybe we expected it to be higher.
Whatever the case, we know that, at least in our training, that we could improve.
So, let's go back up and let's change just one little thing here.
We're going to uncomment this and introduce a second layer of neurons, 52 neurons to be exact.
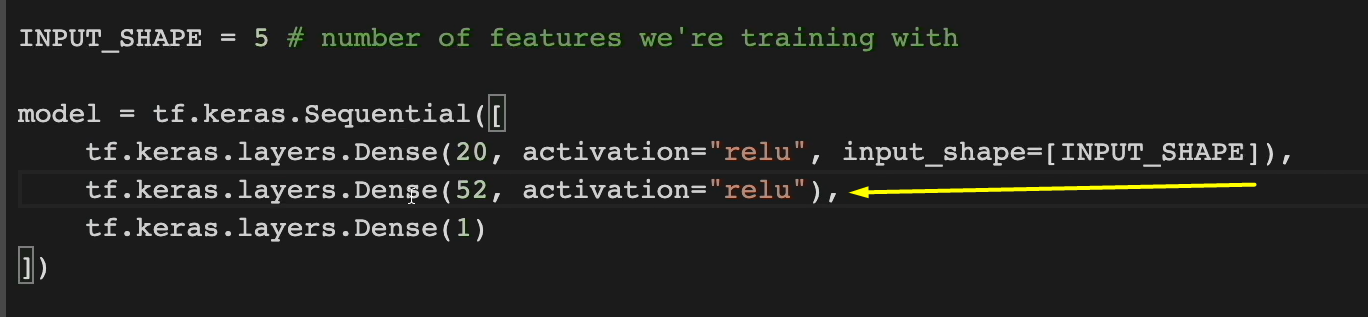
Let’s run this again to see how this model performs against the other one.
Let's do training on this new one, get 5 of them, and notice how at the beginning it was $176,000 off. But at the end of Epoch 5, now we're only $76,000 off.
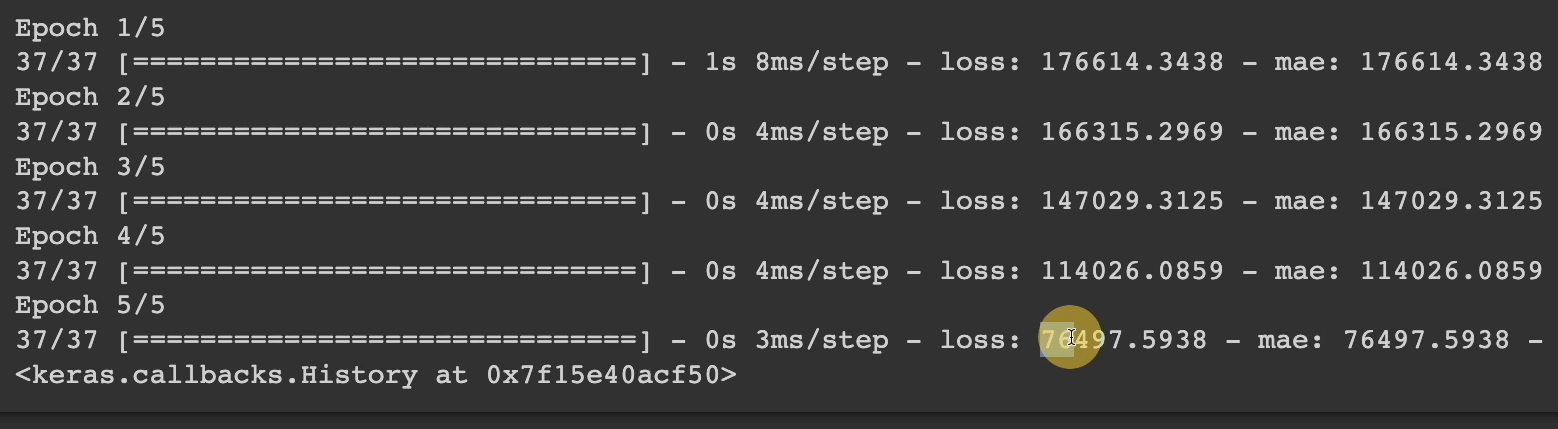
So, we increased or improved our loss by $100,000, getting much closer or more accurate predictions.
It's pretty good.
Let's look at what TensorBoard says for us here.
Let's click on this run and sure enough, it's going to show us both runs, the first run and the second one.
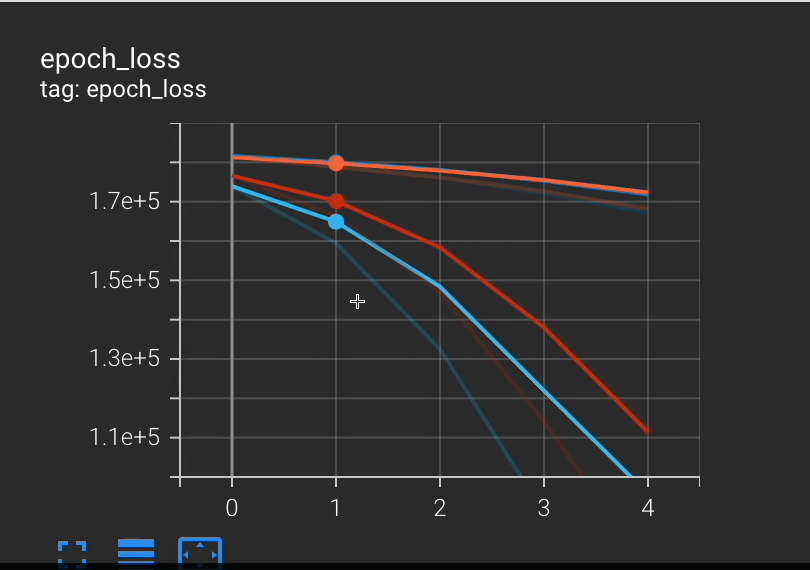
And we can continue exploring, analyzing, and whatnot, using these visualizations.
** Let's go back down to our testing of stuff.**
We don't need to reload our test_data. That's the same. Or the test_x.
But we do need to get a new list of predictions because our model is completely different.
So run this to get new predictions and let's look at the first house now. Run this cell again.
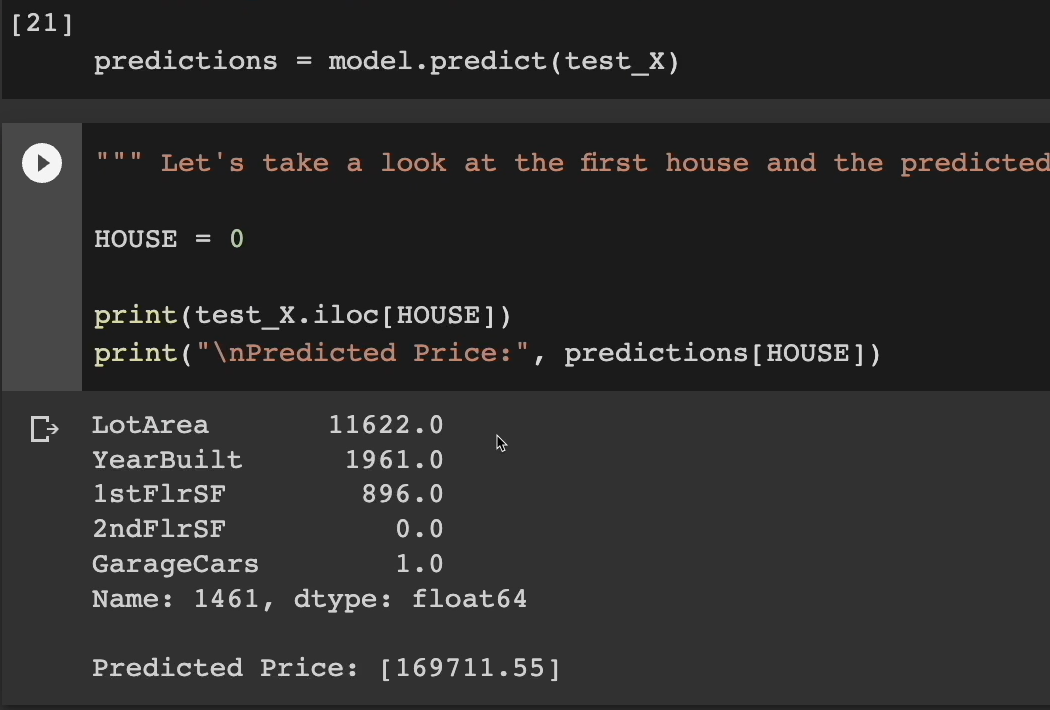
We have the same house as before, but this time our model is predicting that it's closer to $169,000, which seems a lot more realistic to me than the $15,000 from the first model.
But to end this video, I want to go into this question of, is this a high-quality model?
Let's look at some of the aspects of the model to help us determine this.
Let's first look at the problem. Does our current model solve the problem well? Why or why not?
Is our problem statement good? Maybe it's too vague. We don't really have any KPIs to tell us whether or not this is good enough.
What did we actually expect from this output? If we had this input, do we expect something closer to 20,000, or 10,000?
We don't know.
So maybe that's part of the problem with our problem statement is we don't have enough expertise or knowledge to know what this number is supposed to be given this input.
Interesting.
And then how would you define success for this?
Looking at the feature engineering side of things, are the current features we're using the best way to evaluate the price of a house?
What if we included full bath, or other features? Are there features missing that would help us predict better, like location?
I think location matters a lot in the price of a house, but we ignored that completely. Do we even have that in our data set?
Let's look at the data here. Do we understand the data we're working with?
There are definitely some of the features inside our data I don't know what they meant. There's like Ms. Subclass. I don't know what that is.
Do we need to pre-process, normalize, or transform our data in any way?
We saw that there were zero values. There was missing values that with the NaNs.
What are the biases that exist in our data? For example, overall quality and overall condition seem to be on a scale of one to 10, but who determined the overall quality? Was this something that our team did or maybe a third-party inspection company?
How much weight should the overall quality and condition play in our model's evaluation? We're currently not using them as our features, but should we include them in our feature set?
Moving on to privacy and security.
Is any of our data or the way we collect and stream it a privacy risk?
Are we streaming and storing things in a secure way? Are our predictions safe as well?
**The performance — how performant is our ETL process? **How performant is our raining or retraining? How performant is the inference?
Right now, our training was really fast because we only had 5 Epochs with very few features, but if you had a large data set, this could take minutes. This could take hours.
**How about inference? **How fast were predictions able to be made?
Again, in our example, this was really fast, but if we had this behind a lambda or maybe behind a REST service, how long would it take to get the predictions back to the user?
Interesting.
I'm sure you're thinking of other things, and that is exactly the point. Your existing skills and experience as a tester can already be applied for ML and AI. And this is only from prepared data to train and validate the model.
There's so much more that goes on before and after that needs your testing skills and expertise.
