

Hi, my name is Abby Bangser, and I'm excited to share with you this course - Introducing Observability.
Observability has grown in popularity recently as a way of thinking about system support.
We will discuss the definition and application of observability and how it applies to your job as a test automator.
We will do this by diving into the terms, techniques, and tools behind applying observability to a real world case.
So, why do I think we should talk about Observability?
Most experienced engineers agree that their key to success is in understanding, debugging and extending existing code - not solely in writing new code.
Realizing the impact that existing code has on our effectiveness has led to a heightened focus on how engineers can support their future self or future teammates in a faster entry to understanding and being effective in their codebases.
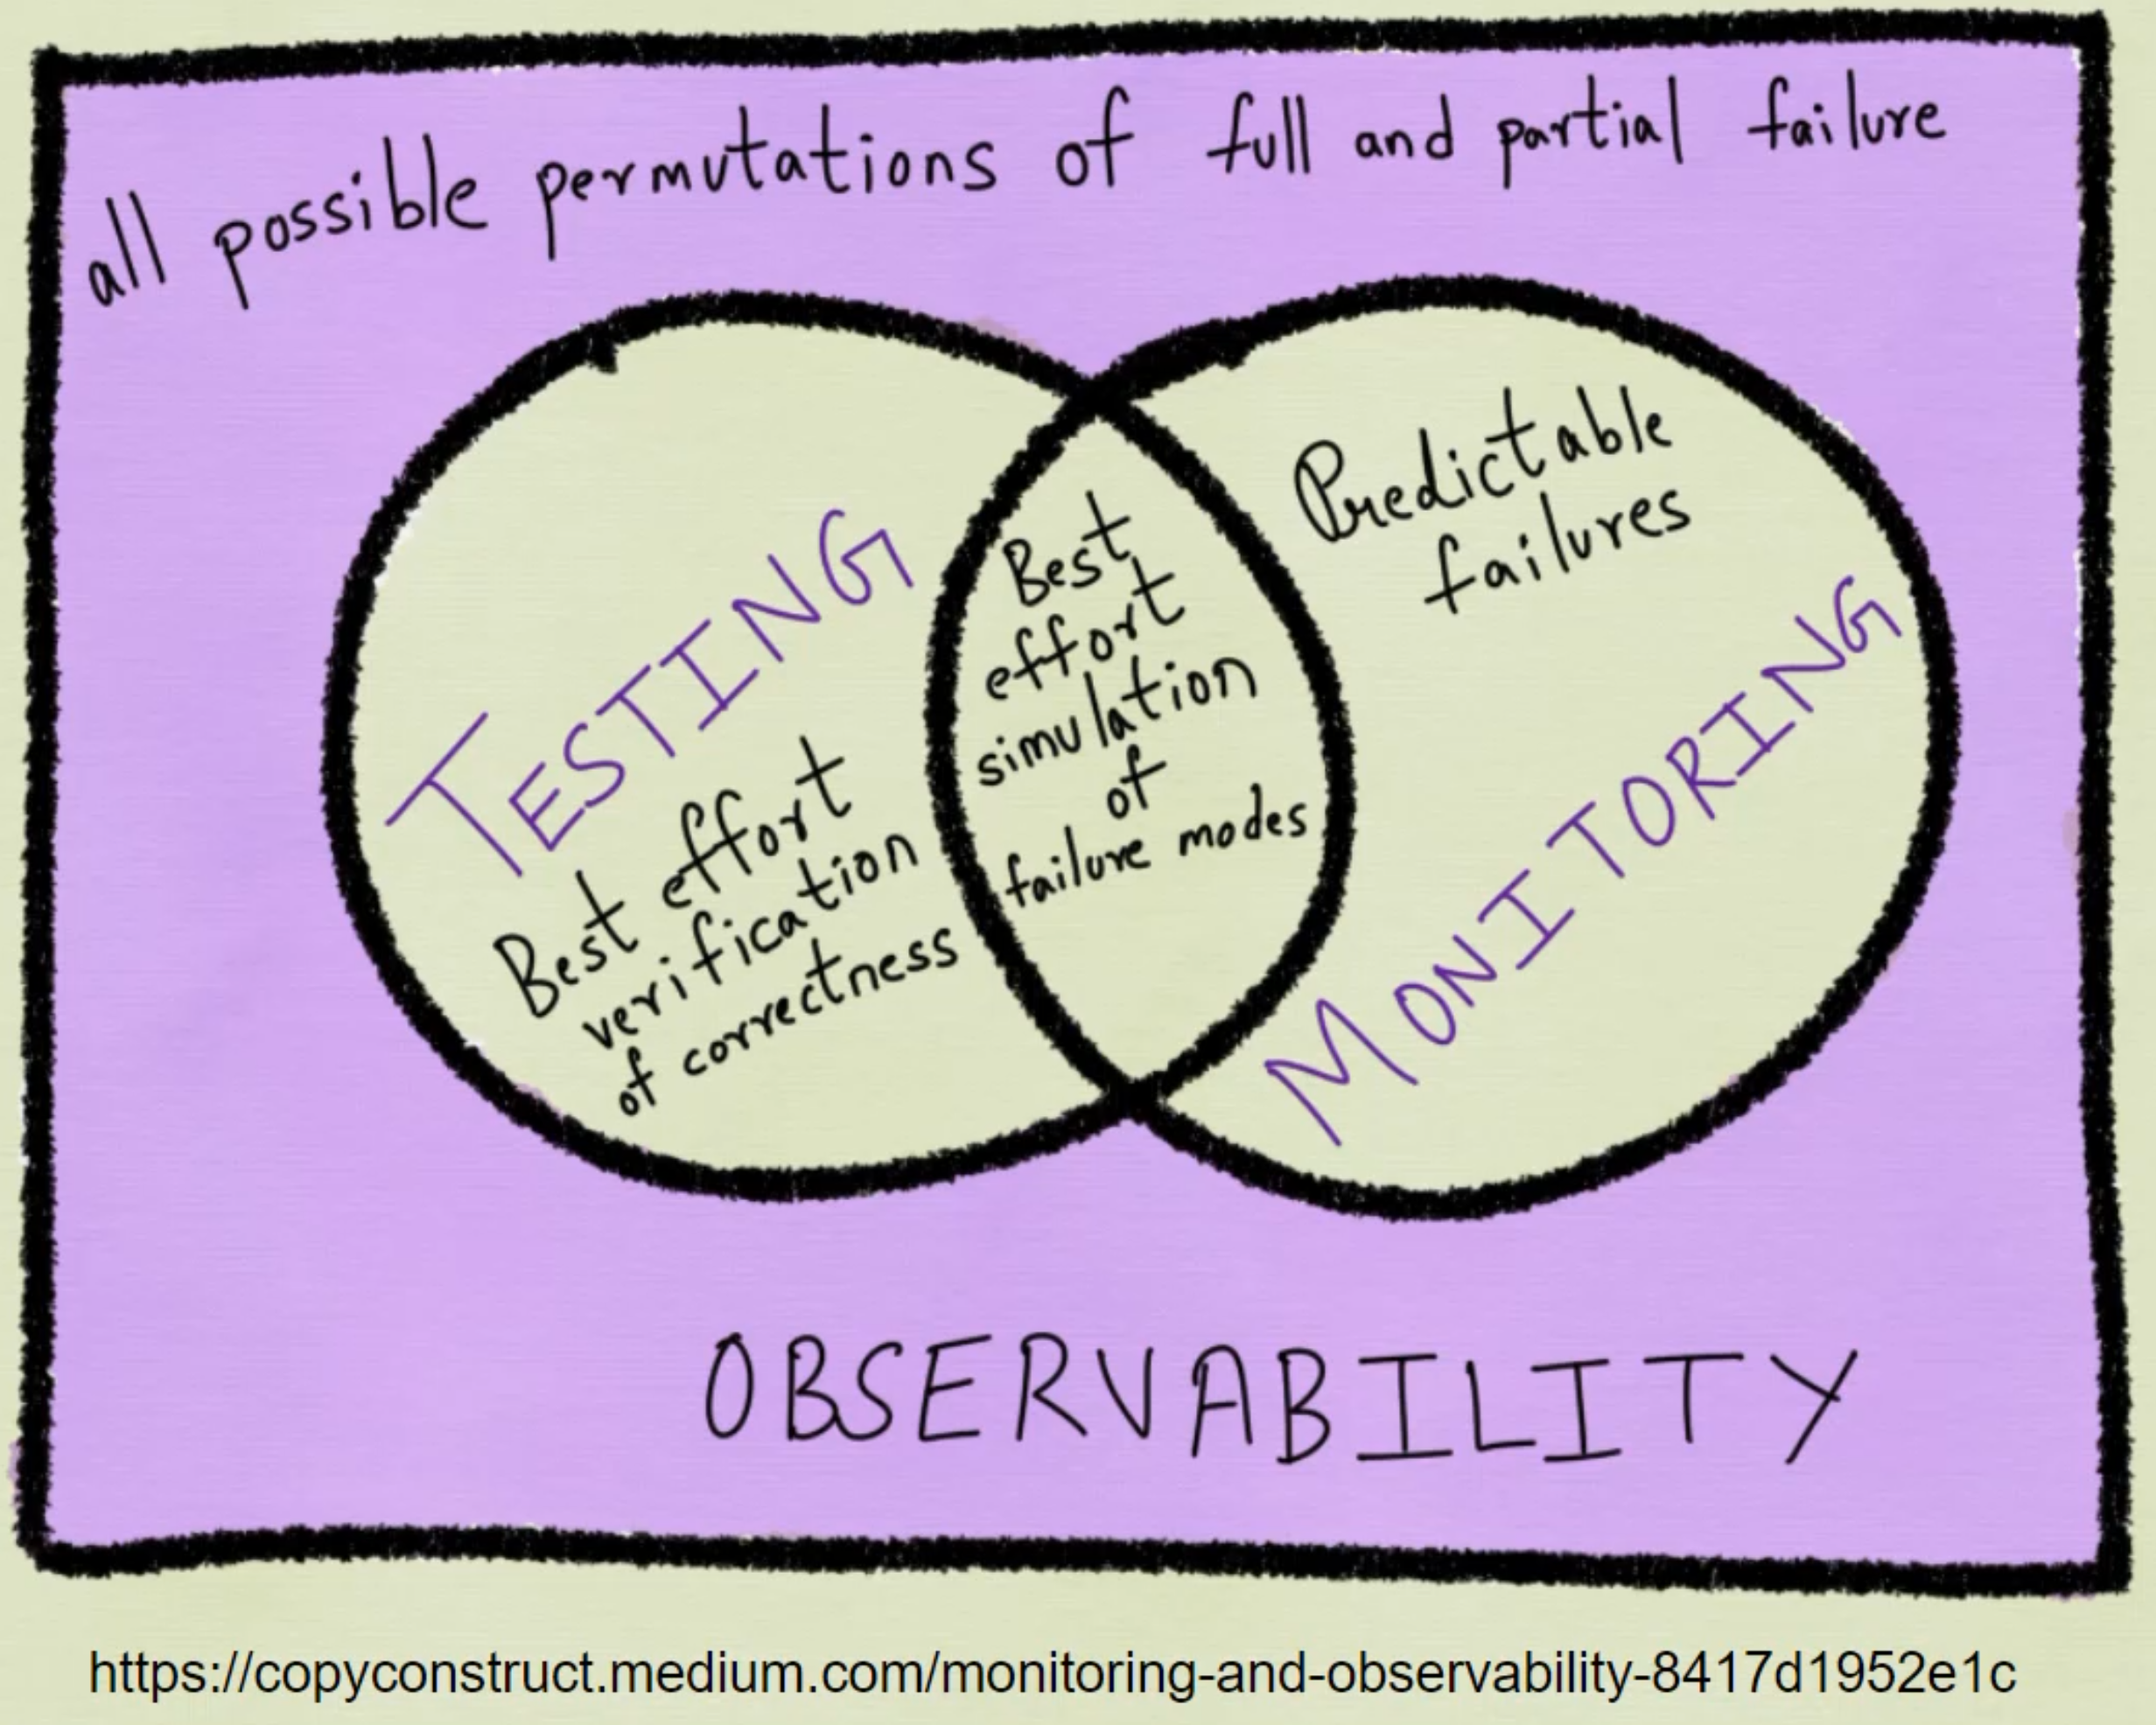
One of the biggest ways engineers can provide future operability is to find ways to expose information about how it is their current systems are operating.
The data that is collected can be described as telemetry and can be formatted, stored, and queried in a number of different ways.
Each format lends itself to a slightly different style of graph and display, therefore providing a unique view into how the system is behaving.
Beyond just querying and graphing, this telemetry is also the basis for automated alerting and remediation, which can result in less downtime when issues do arise.
So what is our goal during this course?
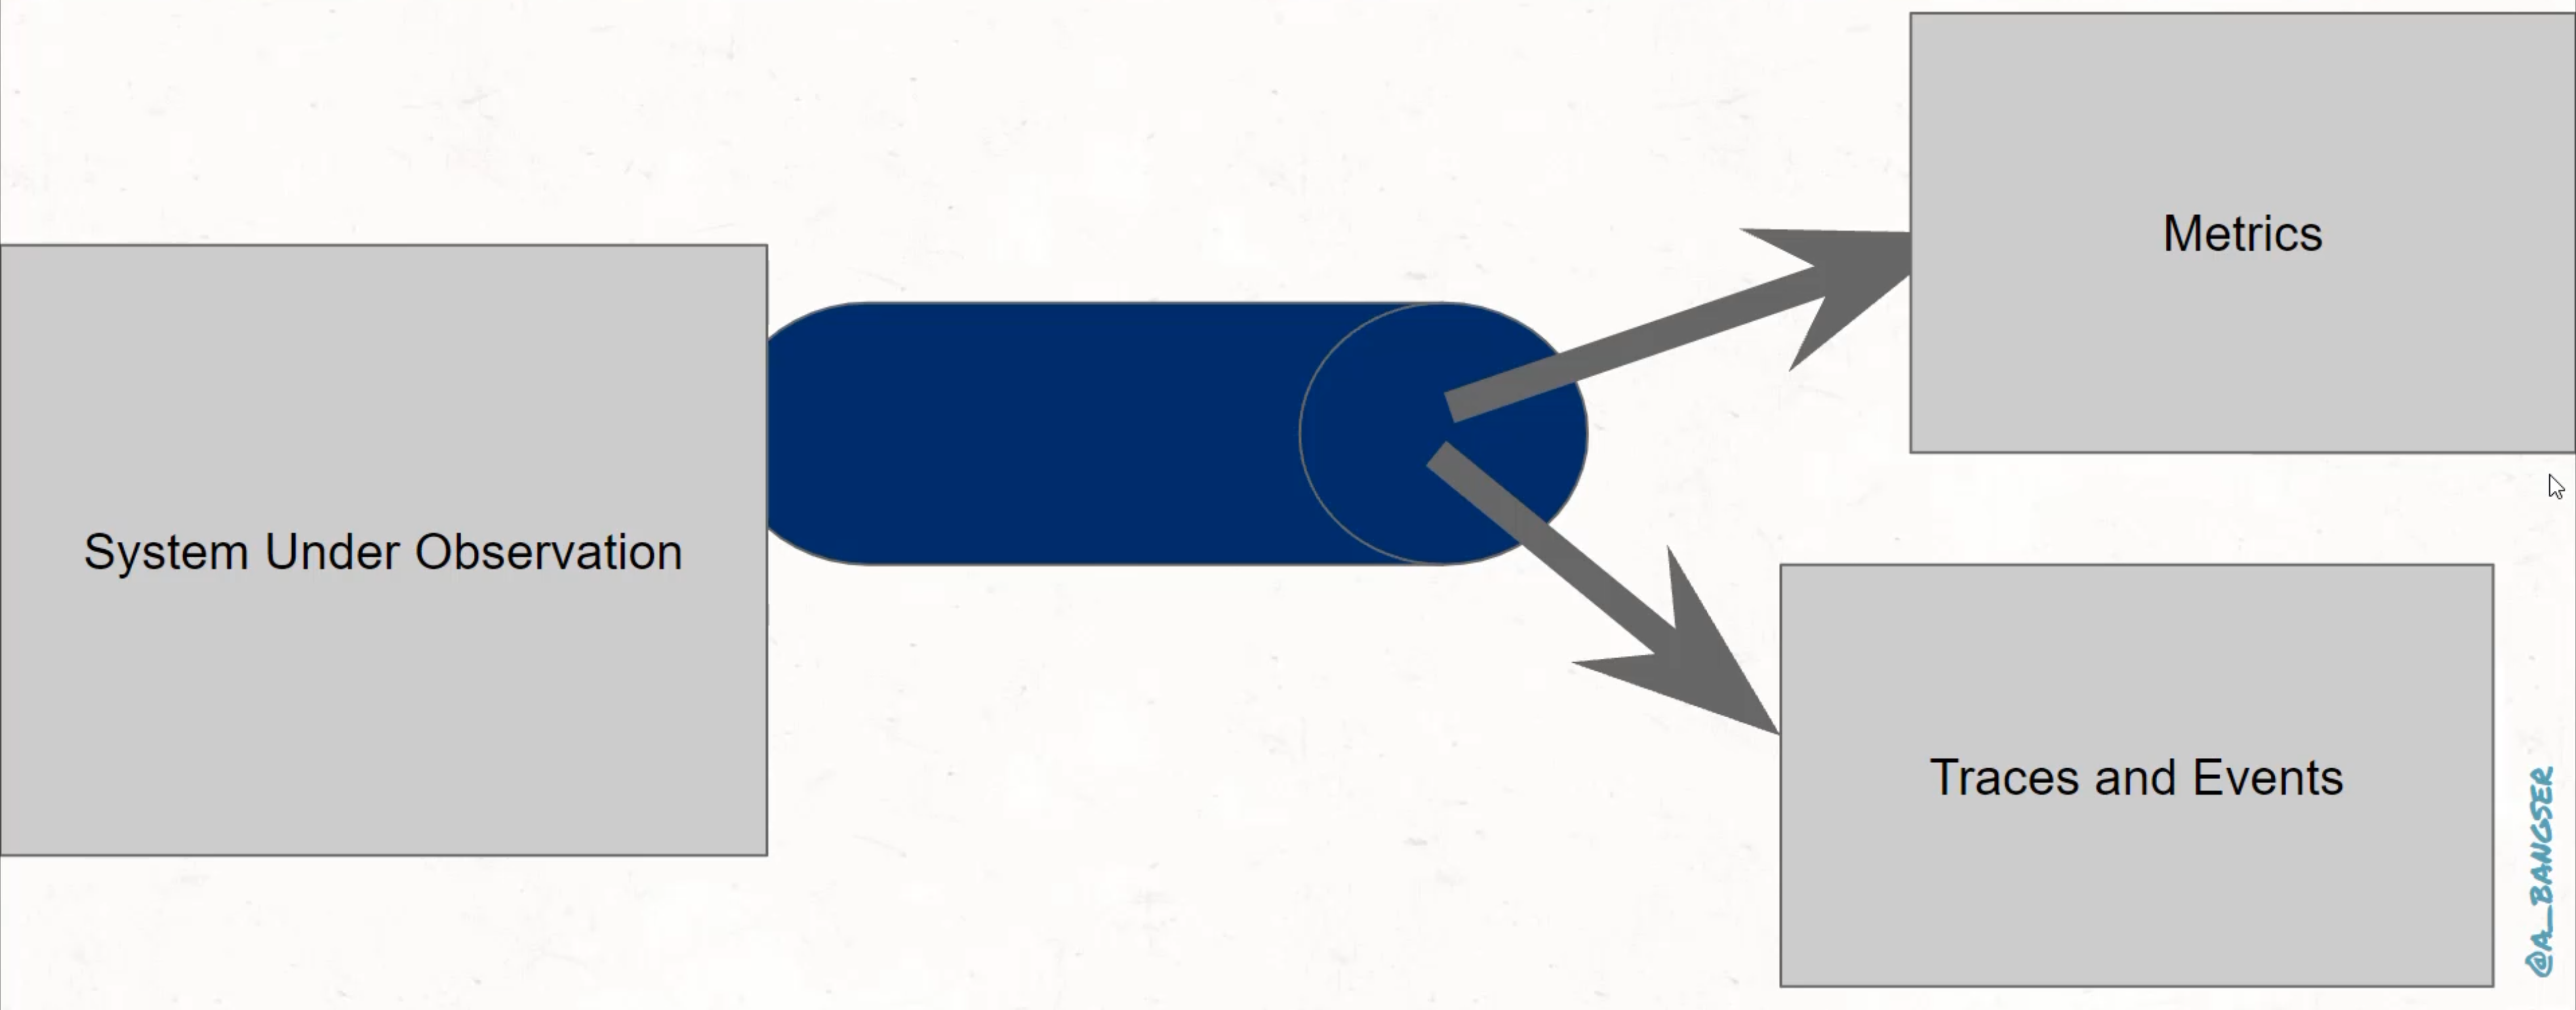
This course aims to provide you with the tools to explore a number of different types of telemetry in a fully local, fully isolated and safe way.
Specifically, we will be enhancing a Java automation test suite to run via a continuous integration pipeline and expose metrics, logs and traces and events as we go.
So how do we plan to get there?
Section 1 of this course will begin in the abstract - this will help us standardize our language and set an understanding about what telemetry is and why there are the different formats.
We will then spend a couple of chapters evolving a Maven test suite into a continuous integration job via GitHub Actions.
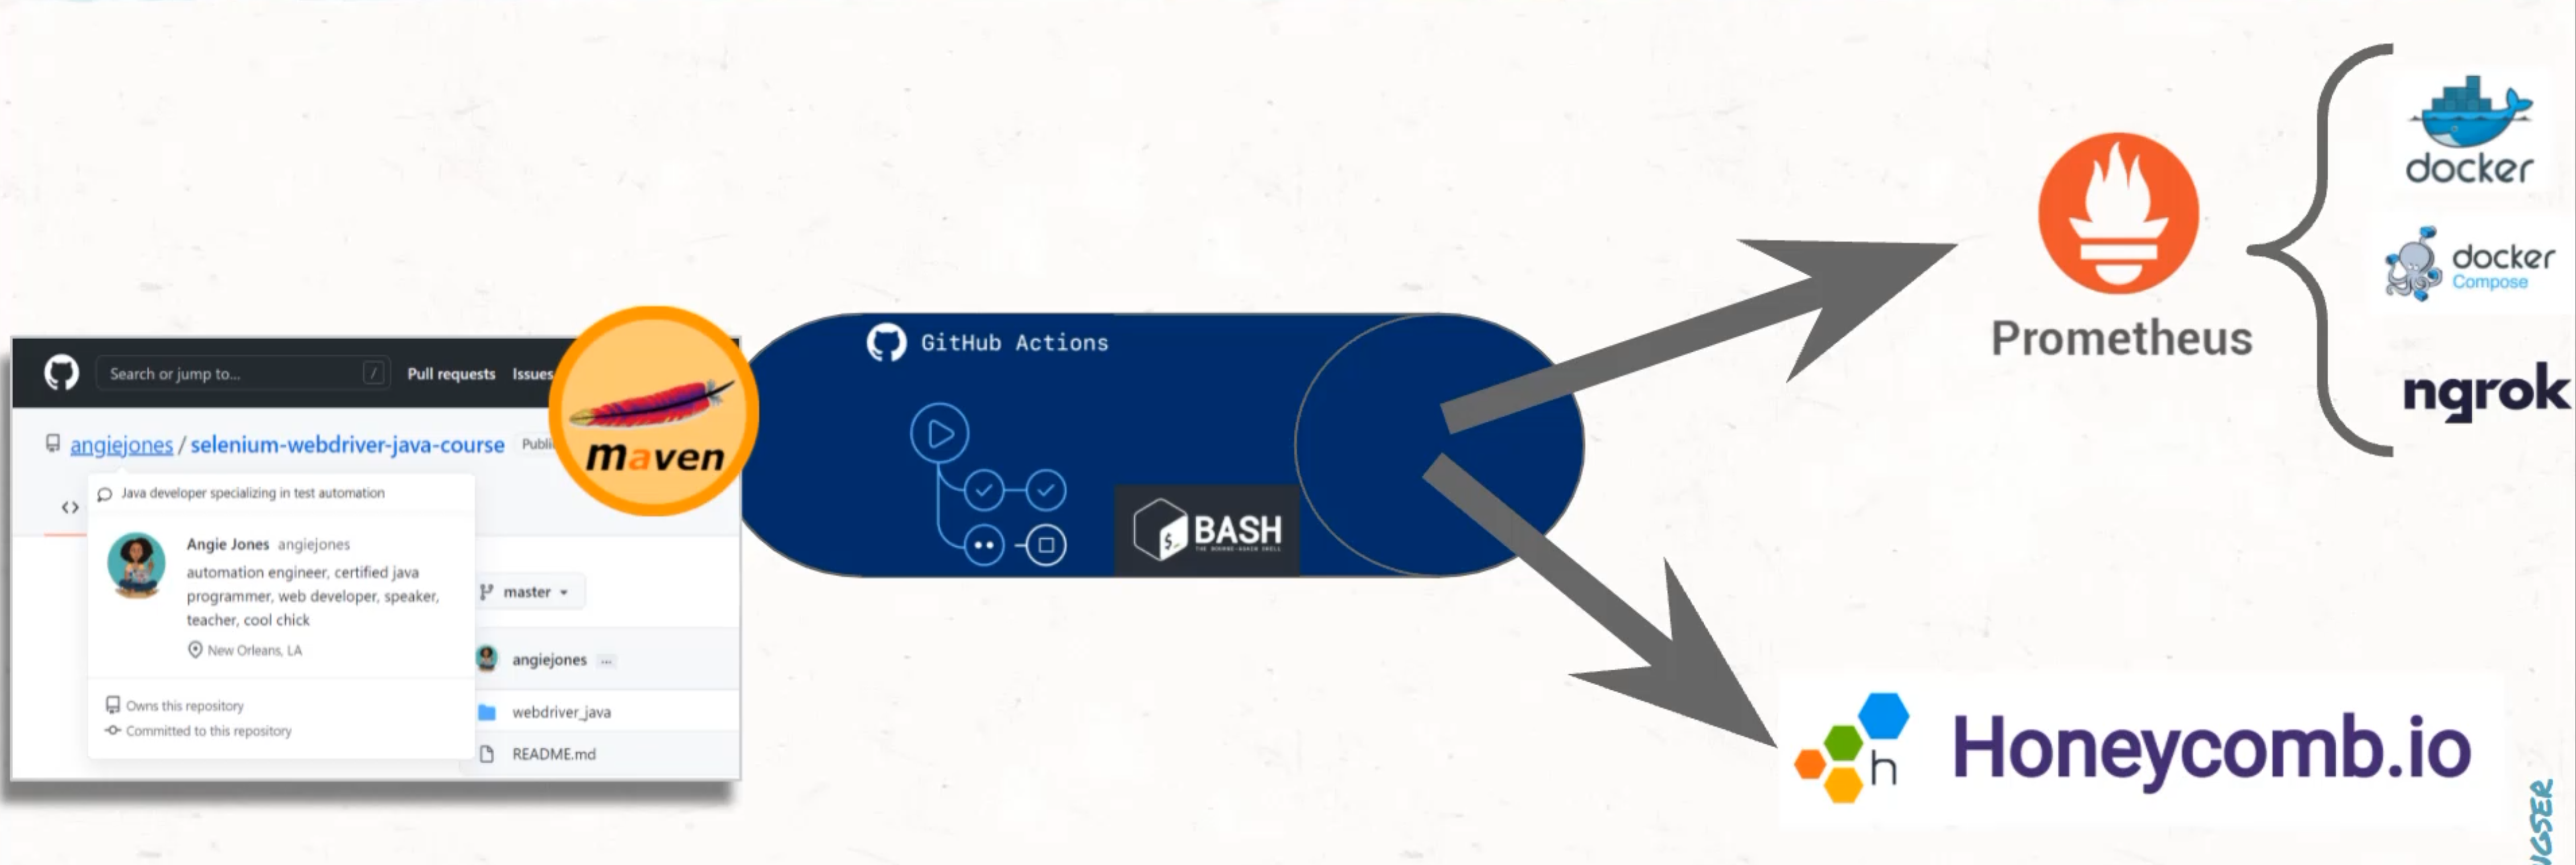
This test suite will act as our "system under test", or, "system under observation", for the rest of this course.
Section 2 focuses on exposing the metrics from the continuous integration suite.
This will introduce the free and open source tool Prometheus.
To do this, we will use tools like Docker and Docker Compose to run Prometheus services on our own computer.
We will then also use bash scripting and Ngrok to support the metrics from our GitHub Actions test suite into the local server.
This section will wrap up with an examination of what metrics provide us and where their limitations lie.
Our third and final section will be a number of chapters introducing a telemetry type called events.
We will examine what composes an event by generating some in our continuous integration pipeline.
From here, we will ship the events to Honeycomb where we can further explore the data.
So, is this course for you?
You may be asking yourself that question and I want the answer to be yes.
There is no denying that we will be covering a lot of ground, and to complete this course completely in your own code base, you will need to try a lot of new things.
I hope that excites you, but I can understand it likely worries you a bit as well.
I really hope you're up for trying, and if you do get stuck, you are welcome to reach out at any time.
Also, you can access working code from the end of any chapter to make sure you stay on track.
And finally, if you prefer, these videos do not bypass any of the steps, so you should be able to benefit from just watching and being able to follow along.
Observability through thoughtful data collection is a journey that never really ends.
This course is a taster to open your mind to what is possible and provide experience using a number of free tools you can bring to your own projects.
I can't wait to show you the possibilities, so when you're ready, I'll see you over in Chapter 1.
