

Transcripted Summary
Where we left off is that we have the ability to run Prometheus and Prometheus Pushgateway and send metrics to them.
We also have some metrics in our GitHub Actions that we want to send to this new Prometheus infrastructure that we're running.
But, now we need to look at how to actually get GitHub to connect to a service that's running on our personal laptops.
As a recap, where we are today is that we have our computers that can speak to a Prometheus server that's running in Docker, that can also speak to a Prometheus Pushgateway running in Docker, and those can speak to each other due to a config file.
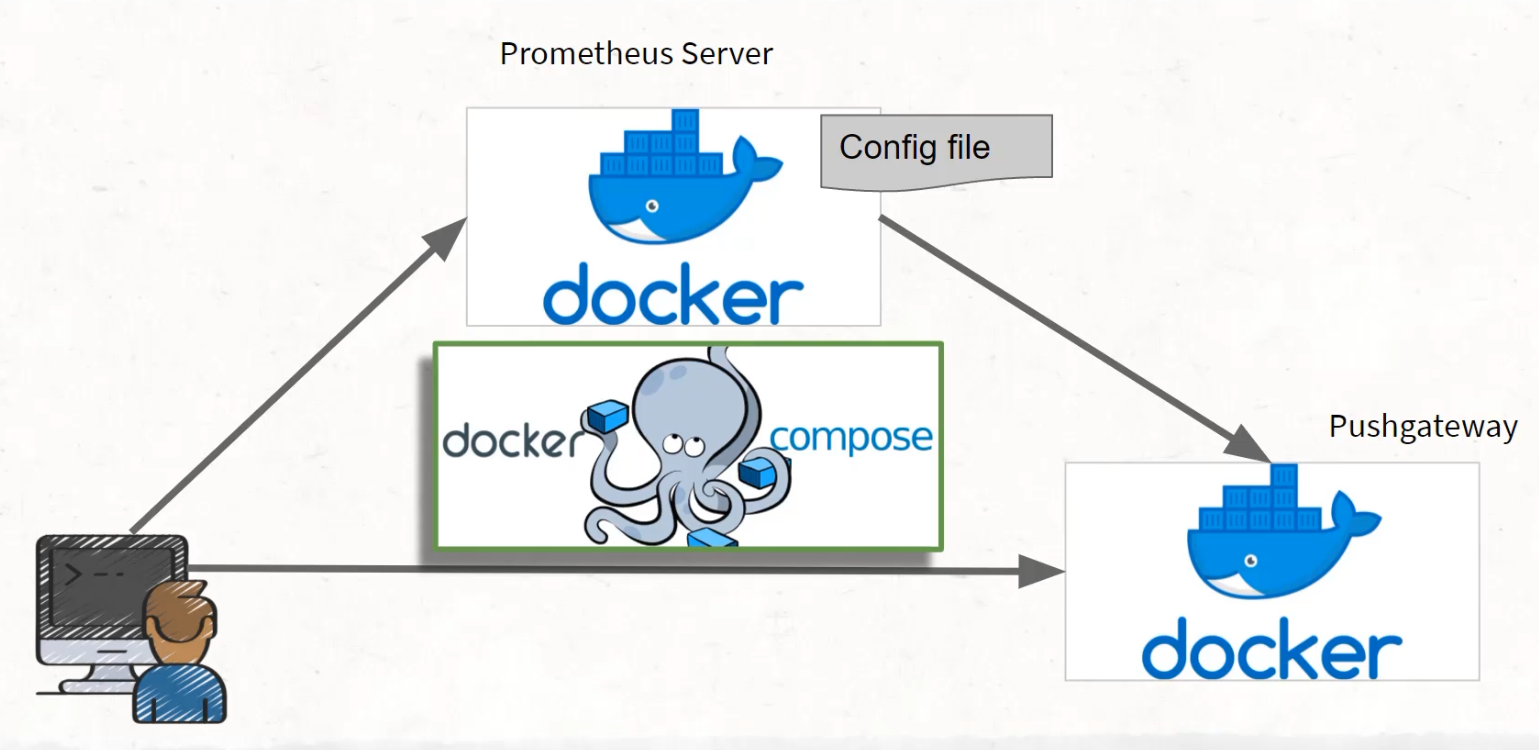
We're doing all of this using Docker Compose.
But if we put this in a bit of perspective, this is all actually happening on our laptops, and what we really need is we need GitHub, and GitHub Actions, more specifically, to be able to speak to this Pushgateway that's running on our laptops.
When we want to add in this GitHub Actions, how can we do that?
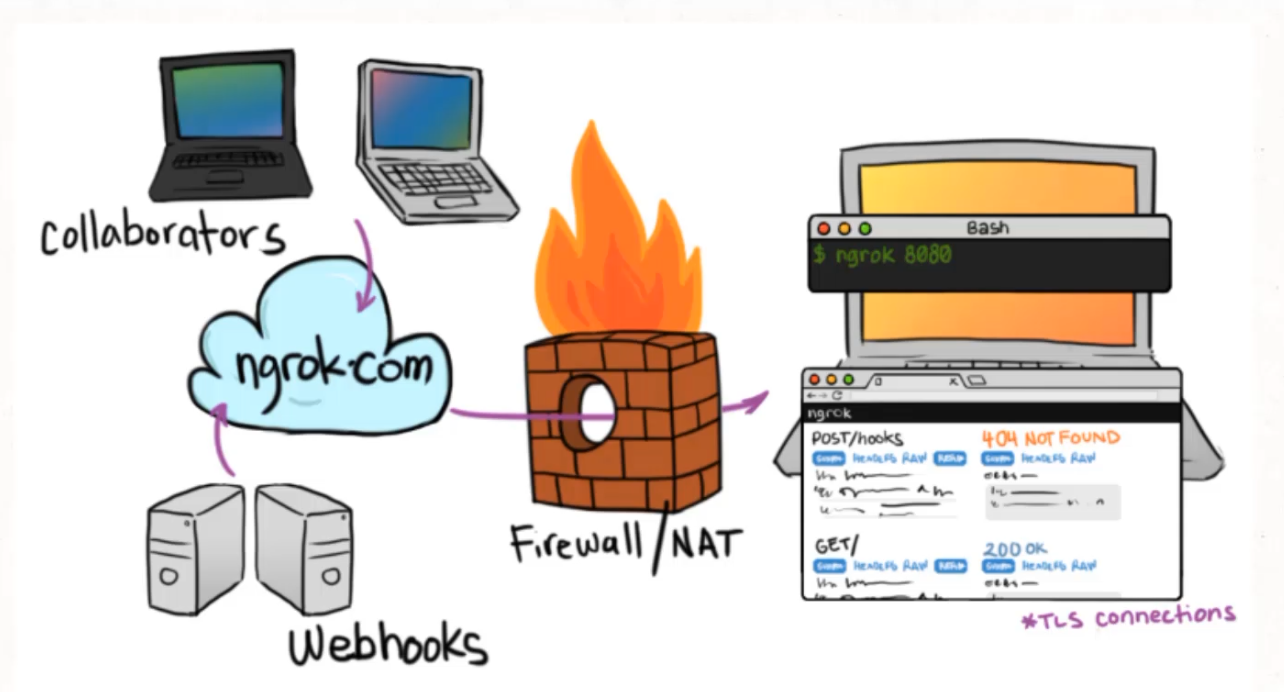
It would be insecure if anybody in the world could run a request that gets handled by our laptops.
Our laptops are not meant to be able to be serving general public web requests.
What we need to do is introduce a tunnel and that tunnel is going to be given to us by a company called ngrok.
# What does ngrok do?
ngrok provides a service which generates unique URLs that point to a locally running service.
ngrok has a whole bunch of security things built in where you're able to add authentication before going to the URLs, and you're able to make sure that this is done over TLS connections - so over HTTPS.
We're going to be running this without authentication, which means that anybody in the world could hit the Prometheus server that you're running on your computer.
The URL that ngrok gives us is very unique, and so we will have a little bit of security through what we call obfuscation, meaning that it's going to be hard to find, and it's not going to be findable through a Google search, so it's unlikely that anyone will find this service that we're running locally.
But I think it's important that you understand that at any time you're running ngrok on your computer, someone in the world could make a request to that service.
We're pretty secure in using this because this data is non-private and we're going to only be running it for short times.
But, keep an eye out to make sure you do tear down your ngrok setup when you're done with it, and that if you want to use this again for something else, that you understand the consequences before you do.
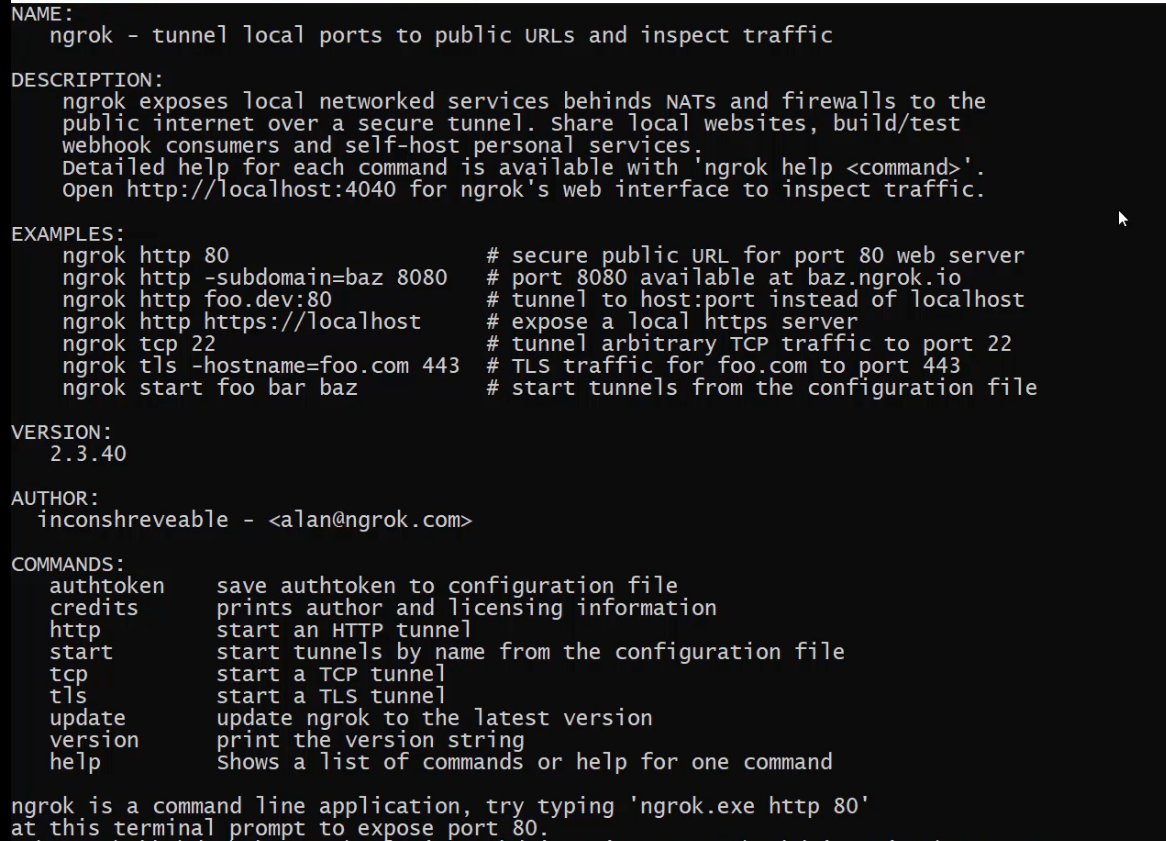
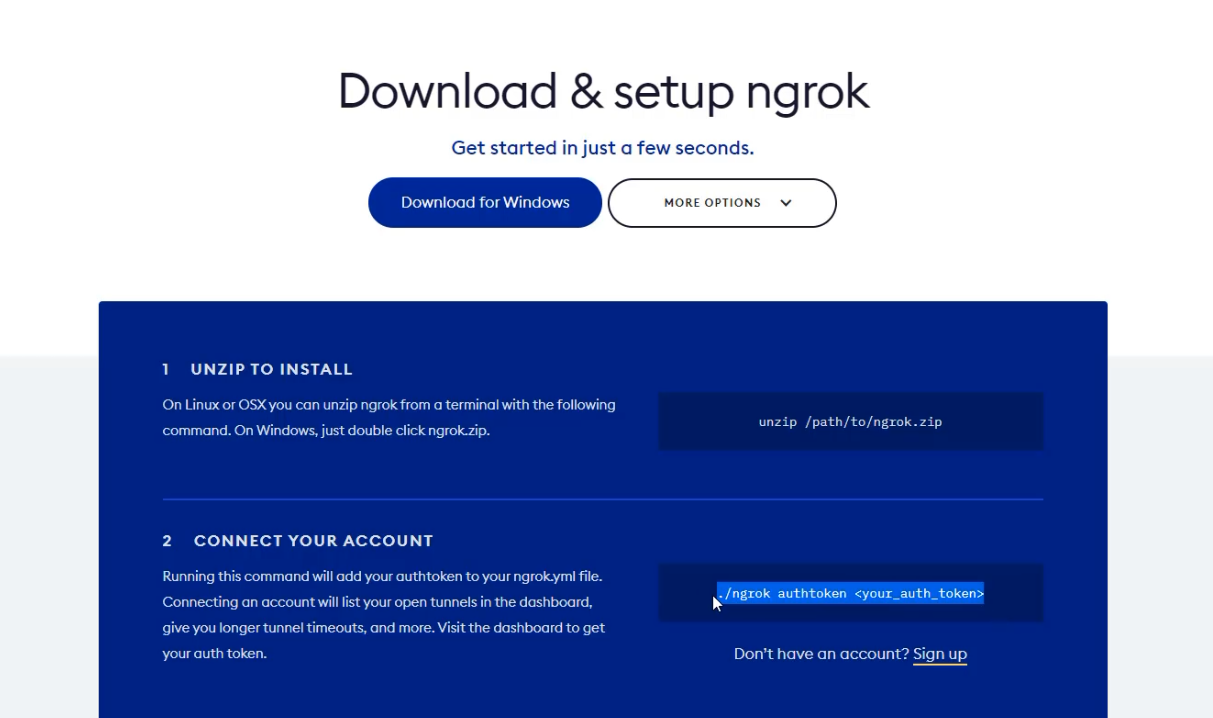
To introduce ngrok, we need to use a command line interface, or CLI tool, which we can download from the ngrok website.
On the ngrok website, we can go to "Download" and we can download for our operating system.
I'm running on Windows, so I'll be downloading the .exe.
I can download this EXE directly into my webdriver_java project into the resources folder.
With that, I can open that up in Finder, I can unzip this folder to "Extract All".
I now have the ngrok.exe inside of a new folder and drag this into the resources directory, close this down and do a bit of cleanup.
I can delete the empty folder and delete the zip file now.
Now I have a Windows friendly ngrok command line tool - I can use this by double-clicking on it.
When this opens up, it immediately gives me some instructions on how to use it, but actually, I'm going to go back to the browser, because that will give me the exact command I need to authenticate with ngrok.
With this, I need an account to connect.
If you are seeing the same message I am, where it says "your_auth_token", you'll need to either sign up or log in.
Now that I'm logged in, I can see that the command has been updated to provide me the specific auth token I need to use.
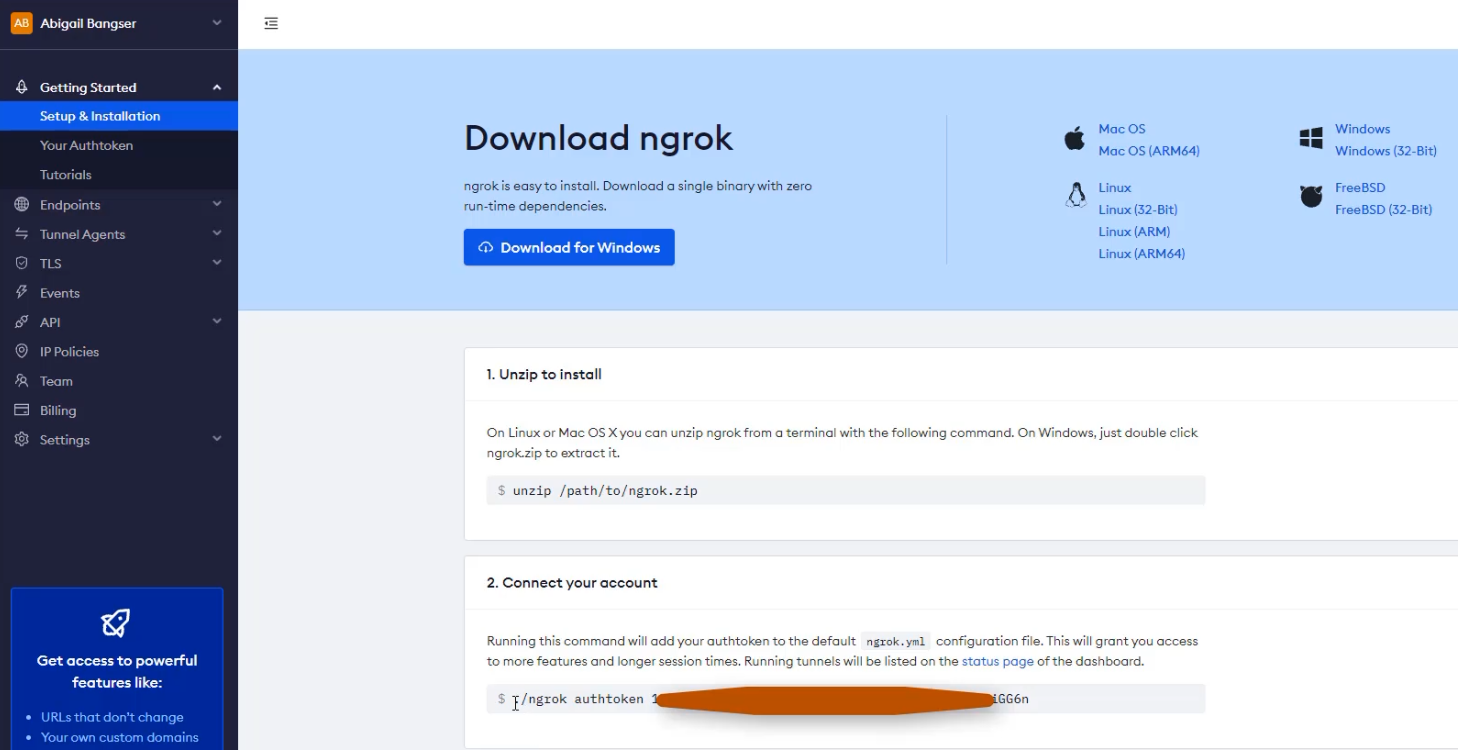
So I'm going to copy this, return back and paste it.

This didn't work because I'm using the Windows EXE version.
So, I'm going to need to get rid of that ./ ahead of it, because I need to just call the command directly.

Now, I have an auth token that is saved in a configuration file, so ngrok knows who I am when I'm exposing this port.
The next thing to do is to provide a secure public URL for a web server running on a specific port.
Before I do this, I should make sure I have my web server running, either from setting it up today or from the previous chapter.
As I can see in the Docker desktop, I don't have it running yet, so what I'll need to do is go to IntelliJ and run the docker-compose up.
Here I am in IntelliJ, in my directory, and I can open up the docker-compose file and run these services.
Once this has been successfully deployed, I know that the Prometheus Pushgateway will be exposed on port 9091.
Let's go open up the browser and see that the Pushgateway is available.
That means I can go back to ngrok and I can expose this through a secure URL from ngrok.
To do that, I need to run
ngrok http 9091
This provides a secure public URL for the web server that's running on 9091.
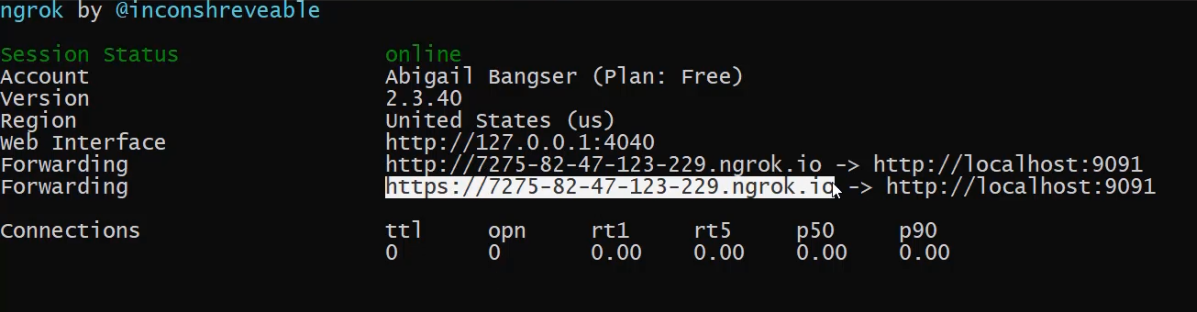
With that all complete, I can now see that I have a URL that has "localhost:9091" as the service, but is actually accessible on this custom URL from ngrok.
I'm going to copy that URL, and now I can see the Prometheus Pushgateway is available both on this ngrok URL and on this localhost URL.
Now I'll be able to use this URL to have an external service contact me on the Pushgateway running on my laptop. With this, I'm ready to have GitHub actions send a metric in.
Coming back to my codebase, I can shut down some of these windows and I can open up my GitHub Actions configuration file, which is under the .github/workflows directory.
Inside of here, I can take this TOTAL_DURATION metric and send that through.
The way I'm going to do that is I'm going to generate my metric through an echo - so echo the name of the metric - I'm going to call this github_actions_total_duration.
I'm then going to pass it the value which I already have as this expression of the current time minus the start time. \
Then, I finally need to send that through to the curl request - curl --data-binary @- and then this is going to go to the ngrok URL and I'll take that from the browser and paste it here https://7275-82-47-123-229.ngrok.io/metrics/job/.
It's specifically to the metrics endpoint and I need to name the job, and I'm going to call this one github_actions.
One thing that's interesting about this is that this URL will likely change.
As I mentioned about the security of ngrok, we don't particularly want this running all the time if it's not being used.
So, I'm going to actually extract this into an environment variable to make it a bit more obvious that it needs to be updated.
I'm even going to extract it into a variable that can be changed without changing the code.
To do that, I'm going to copy this URL, and I'm going to replace this with a specialty environment variable. This environment variable needs two curly braces {{}}, and it is called secrets and the name of the environment variable is whatever I'd like to call it - so I'm going to choose to call it PUSHGATEWAY_URL.
This secret is set actually in the GitHub UI, so I'm going to go set that now in the browser.
If I come to the browser for my codebase, I can see that there's a "Settings" tab.
Under "Settings", I can see that there's a "Secrets" option, and under "Secrets", I can add a "New Repository Secret".
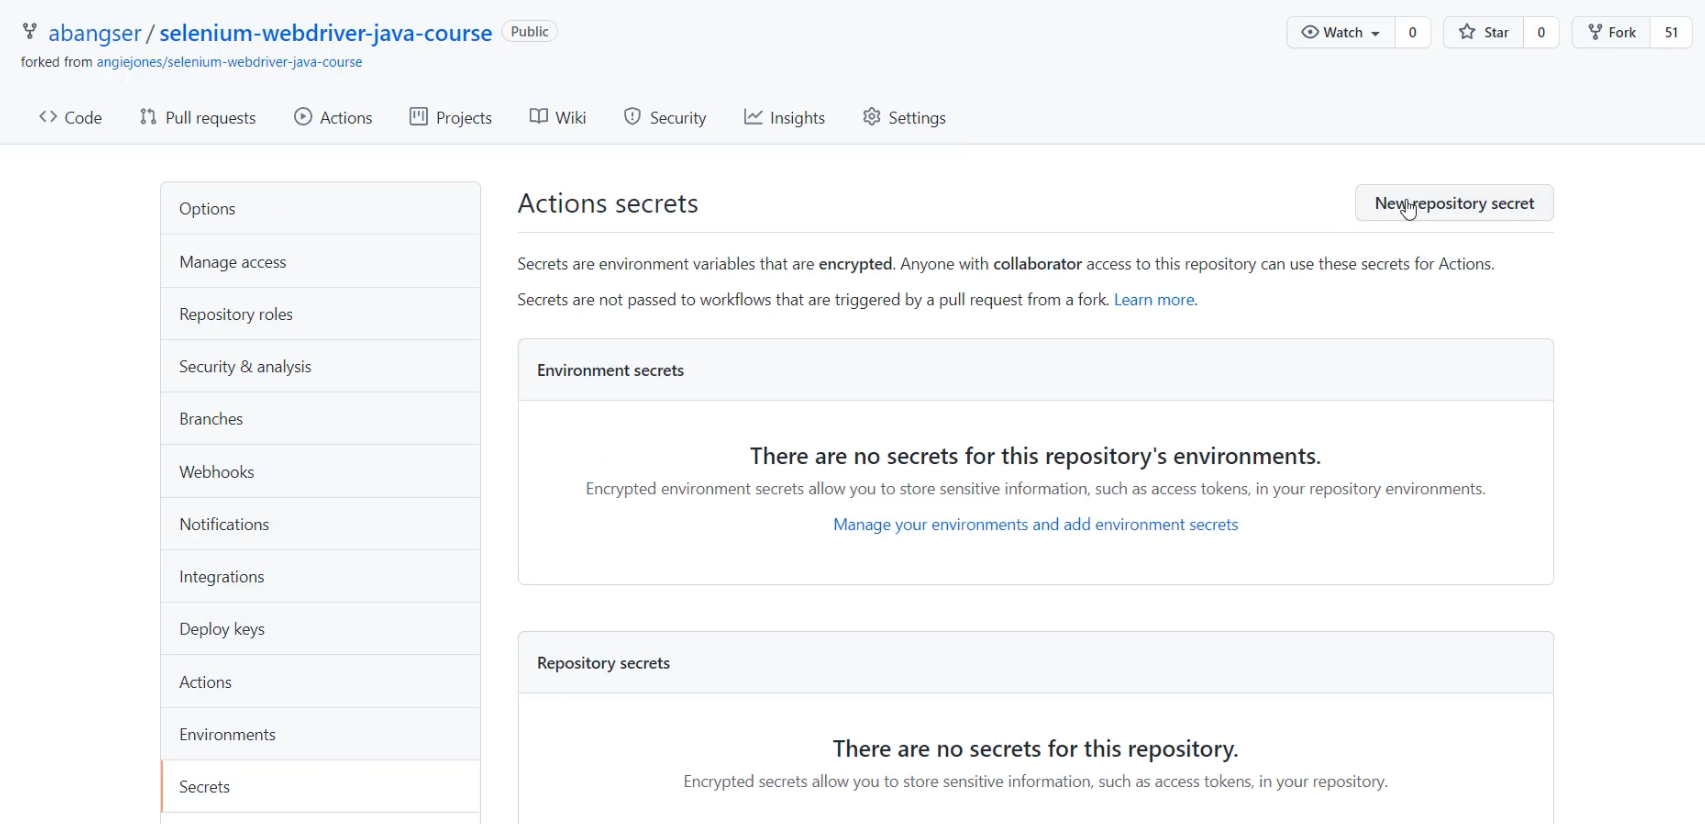
This repository secret has to have the name I just used in the code - so PUSHGATEWAY_URL, and I'm going to save that as the ngrok URL.
Now, with that secret added, I can return to my codebase and I can check that in and see it run on GitHub Actions.
I can go to Commit, I can see that I have a change to my Actions file, which I can add, and I can see that I have the EXE from ngrok, which I'm going to choose not to commit.
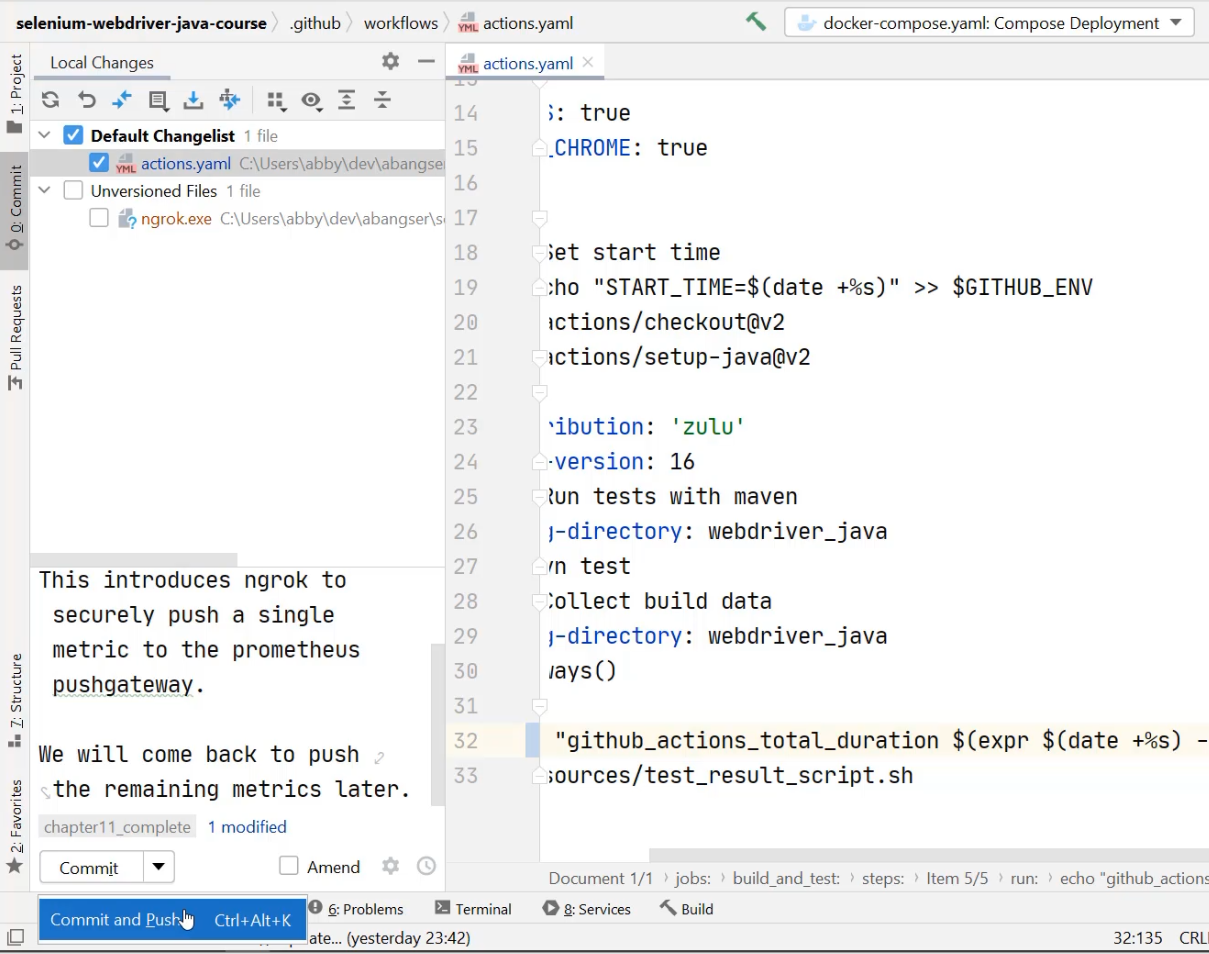
Now I'm ready to "Commit and Push".
With that successfully pushed, I can go to the browser and see the pipeline running.
I'm going to go to the Actions tab and I can see that the "Push duration metric to prometheus" has started a new workflow.
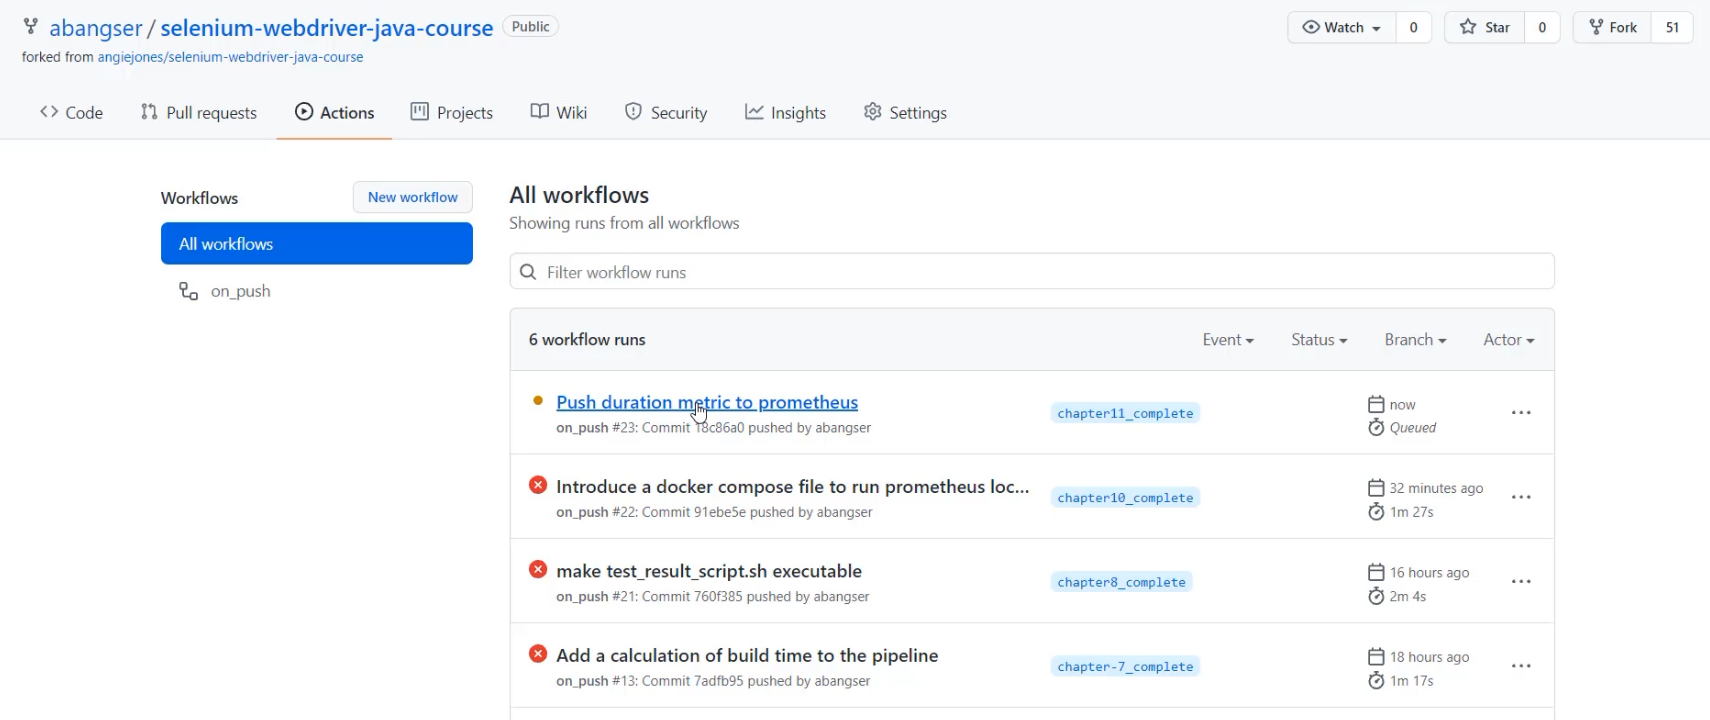
I click through to the "build_and_test" and I can see that the job has started.
I'm going to speed this up for ease of watching.
Now the pipeline is completed, and we can see that under "Collect build data", we have actually sent a curl request.
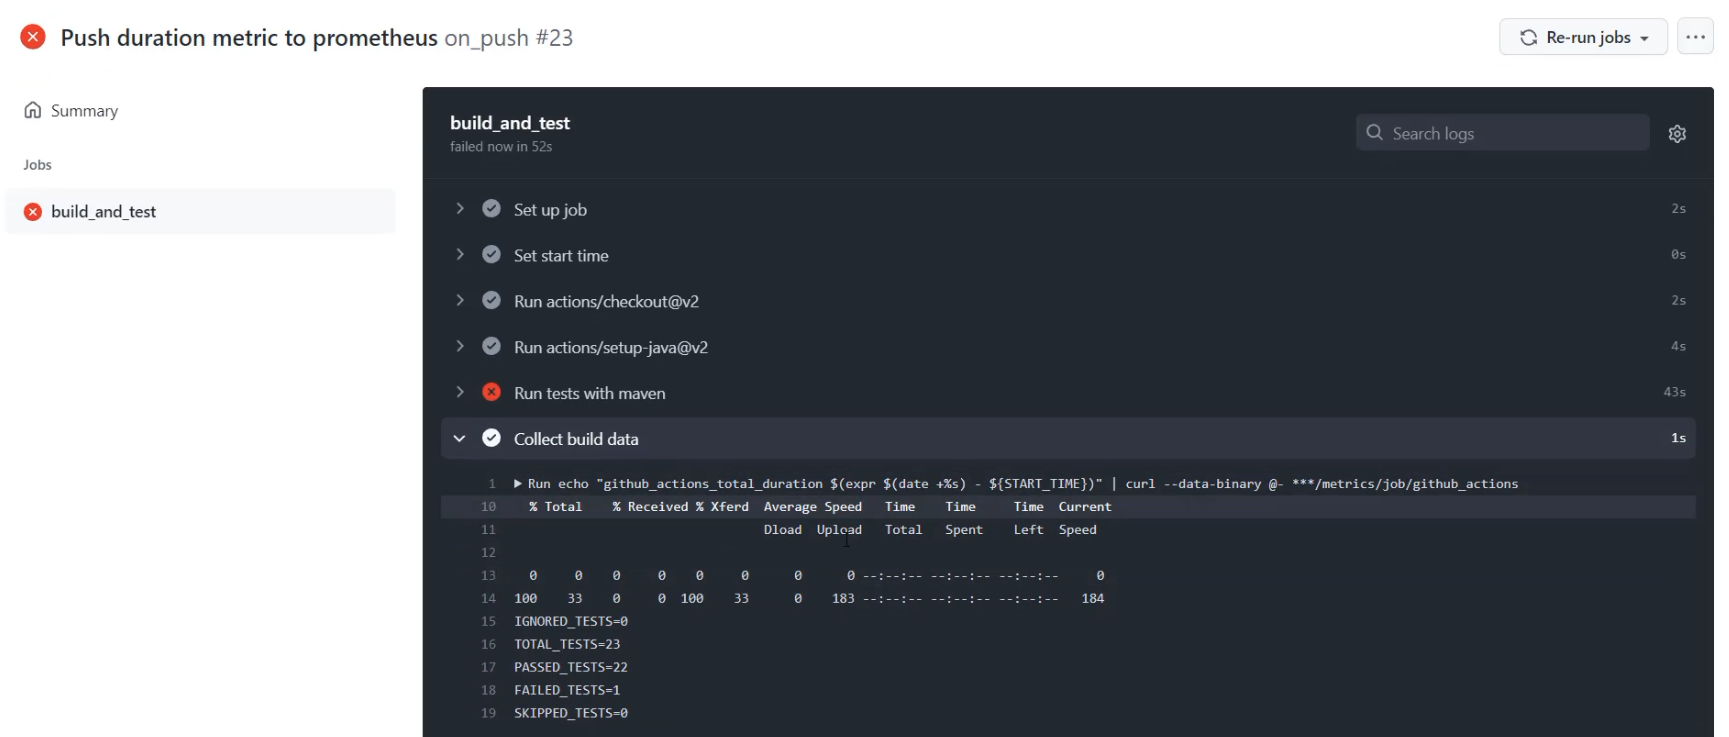
With that, I can go to the Pushgateway and I can refresh, and I will see the "github_actions" job, and specifically the total duration, which was 50 seconds.
If I return to the job that was running, I can see that the entire job took 52 seconds, and so that is our total duration.
Congratulations, you now are able to send metrics from a GitHub Action to a metric server called Prometheus, running on your local computer.
Next up, we get to look a little bit more at how to generate and scope these metrics for highest value.
But at this point you can go ahead and explore as much as you'd like. Have some fun.
