

Transcripted Summary
With the work we've done to date, we are starting to get to a point where not having an external location to store the data we're generating is becoming painful.
We have metrics to describe the duration and the results of our tests, but we still need to click into each and every GitHub Action in order to see them.
# Metrics Infrastructure
The time has come to build some infrastructure, to allow us to store these remotely.
When I talk about infrastructure, I mean, we need a way to collect, store, and query this data.
There are many tools that will allow us to do this.
# Using Prometheus
Today, we're going to be using the tool called Prometheus.
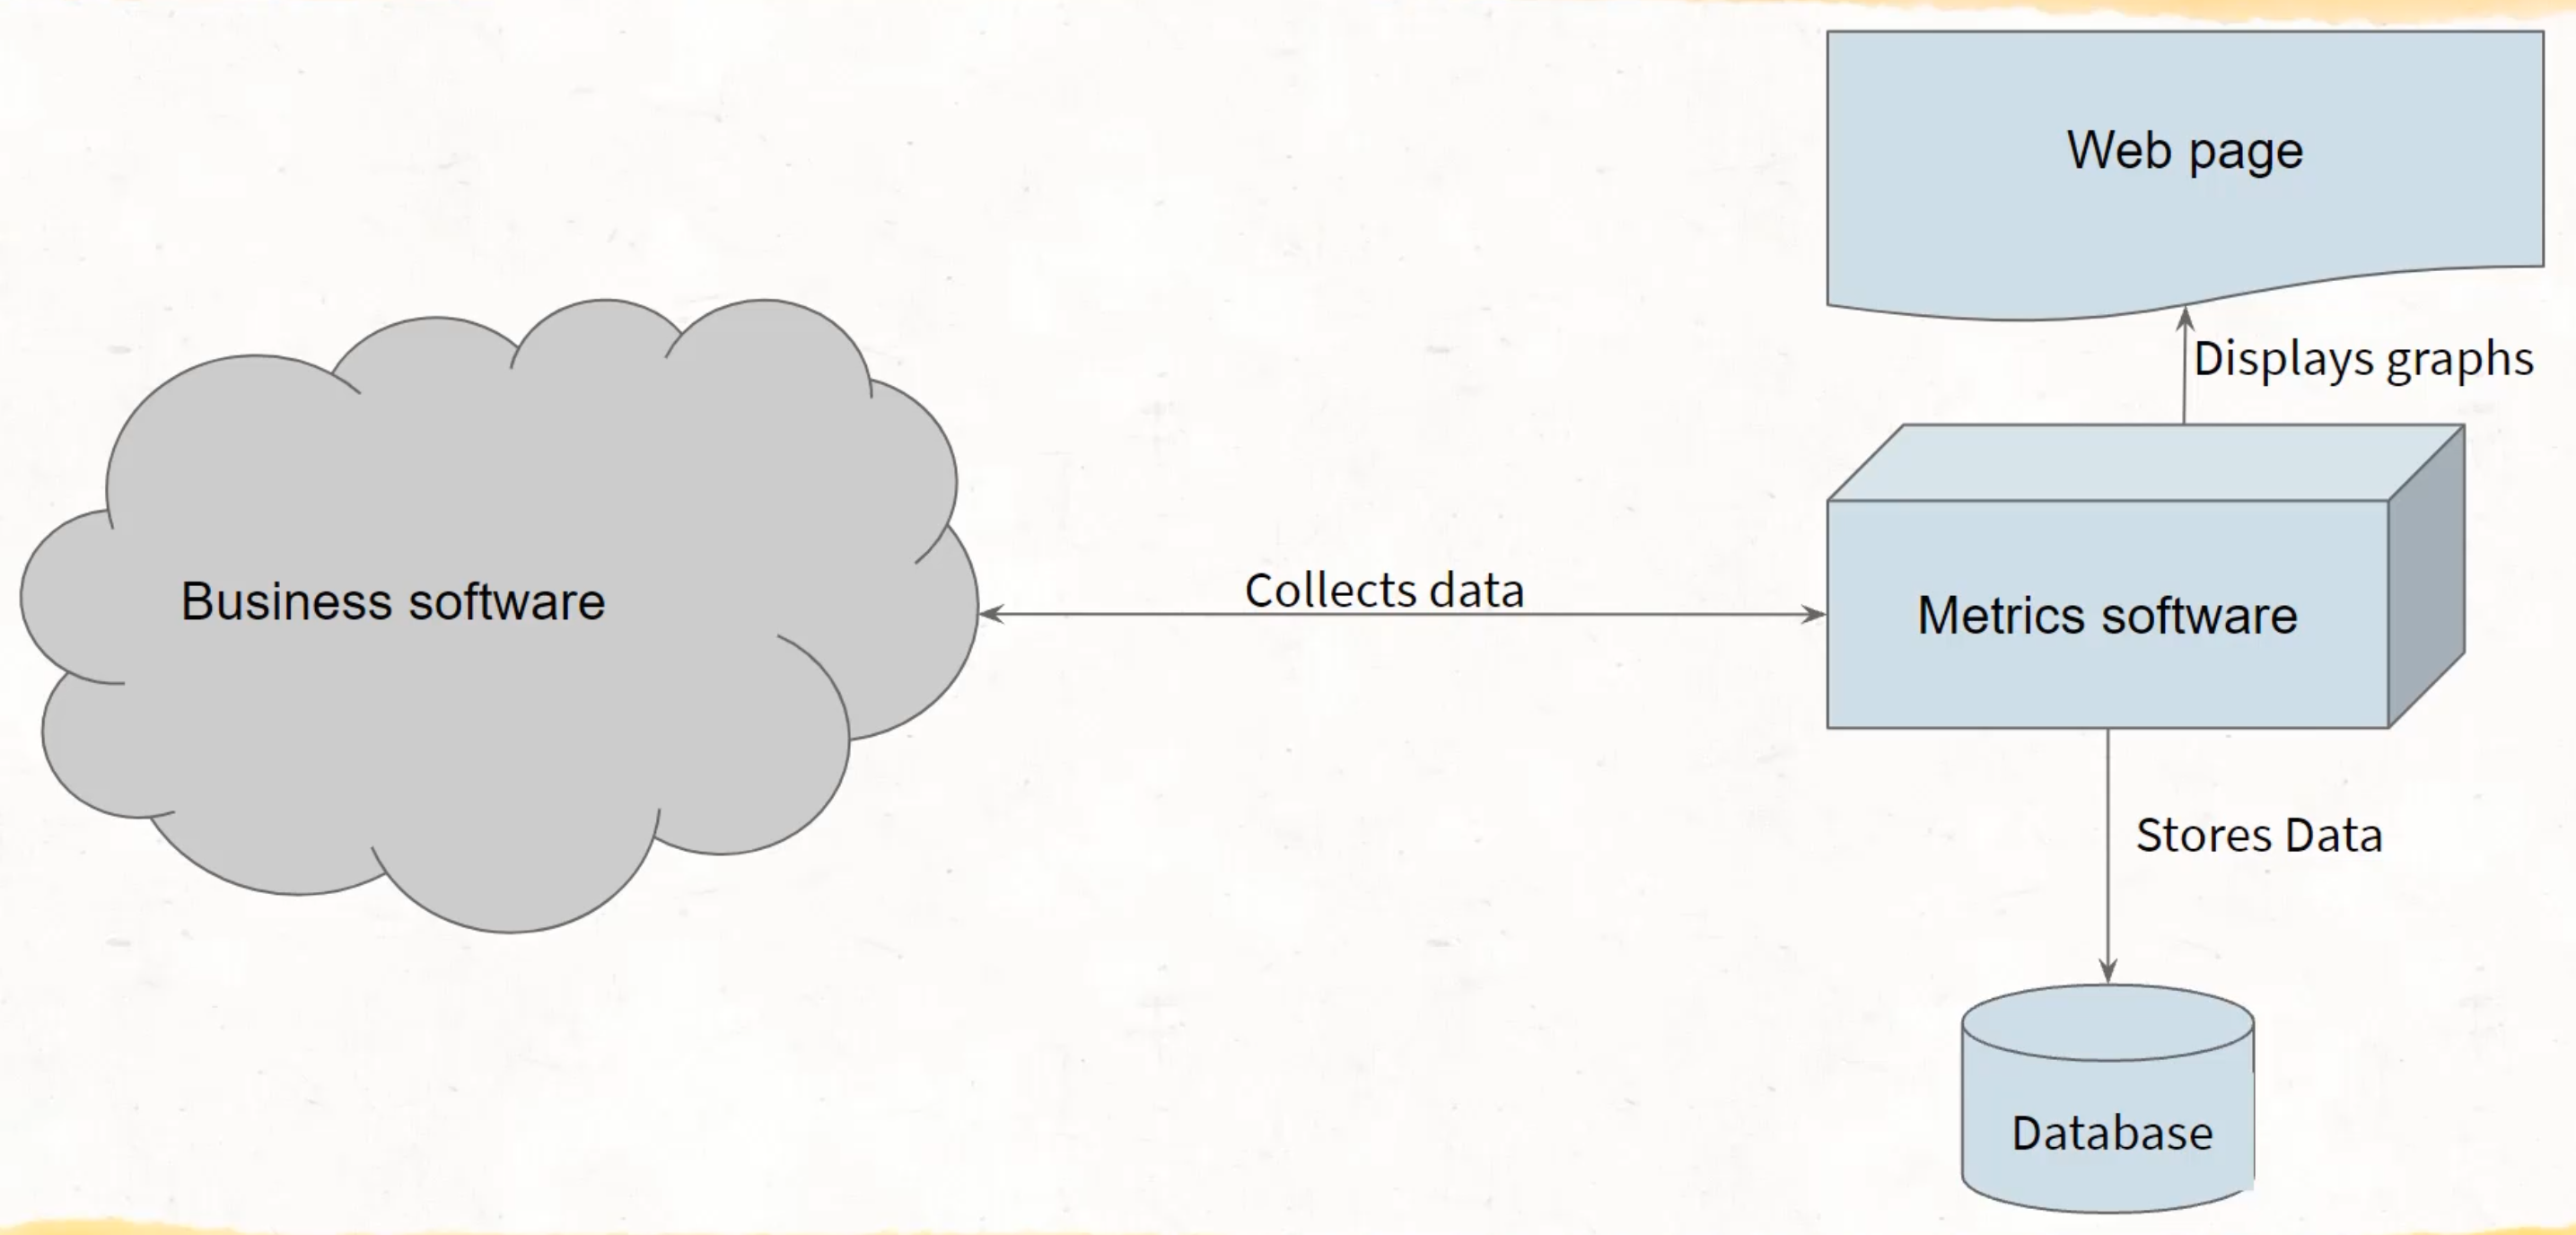
The general model for Prometheus is that we have a metric server and a location for our software.
That software then provides a URL by which the metric server can then go and pull in the data from that URL.
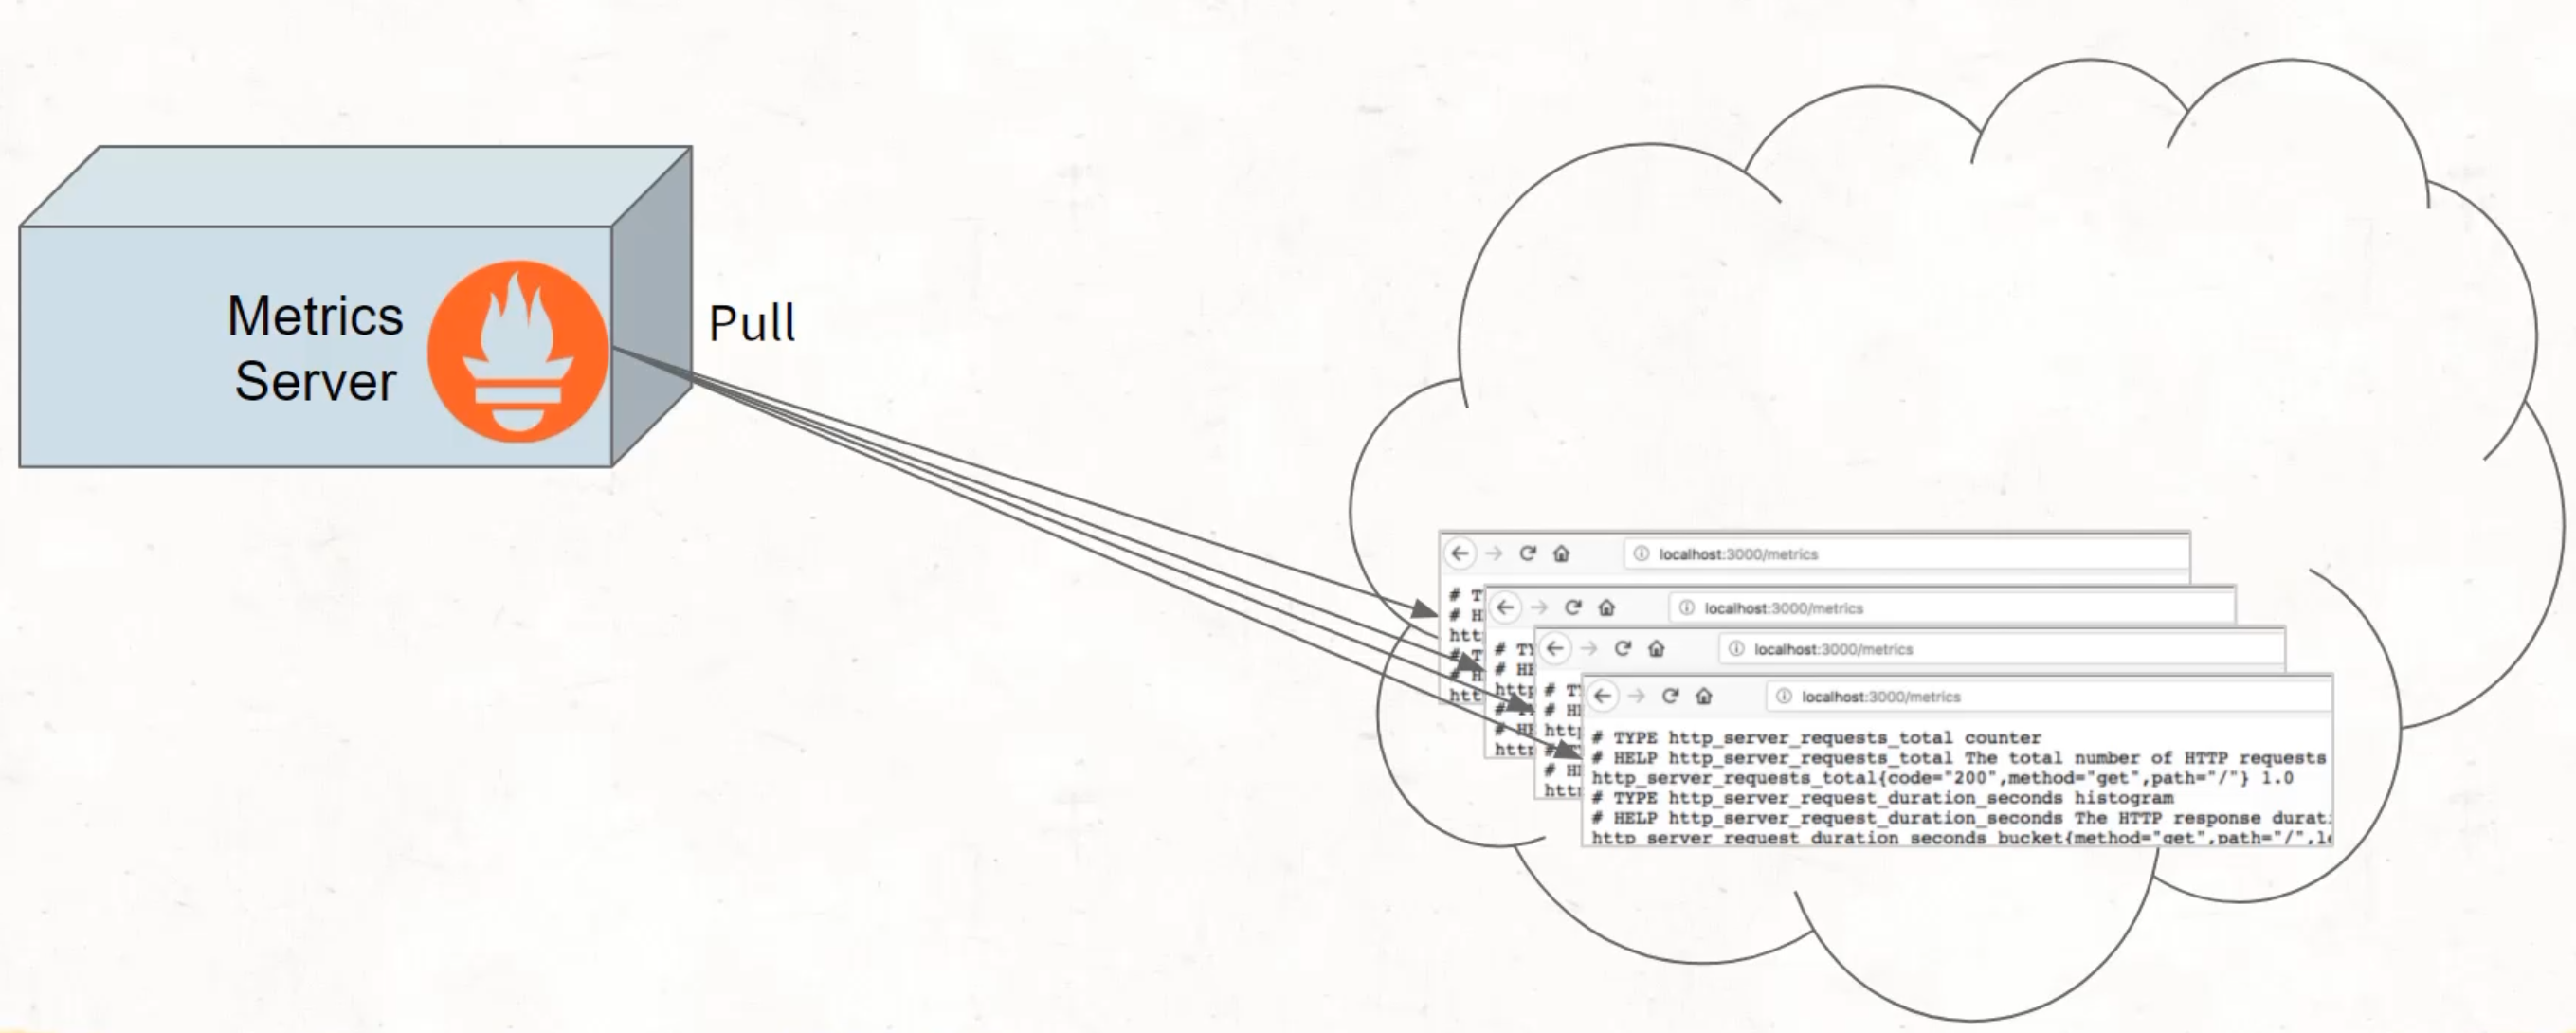
We sometimes use the word scrape here, because what's happening is that the Prometheus server is going out and taking all of the data from that URL.
So you can see here that there's text there - taking all of that text and pulling it back into the server and storing it.
That is a little bit like web scraping, where you're going and you're taking all of the data from the webpage.
But what happens when we have things that don't have stable URLs or stable servers all the time - things like Lambdas, or things like build pipelines, like GitHub Actions like we have.
How is it that then this metric server can go to a stable location to find this data?
Well, we need to put into place a stable web server that it can find, and we need to then push the data to that, so that when Prometheus goes to pull and scrape the data, it is able to find a stable location for even these short-lived jobs like Lambdas and build pipelines.
This is the general format of the infrastructure we need to build today.
More specifically, we're going to use the free and open source software called Prometheus to do it.
Let's take a quick look under the covers of what Prometheus actually looks like, because it's more like an ecosystem than a single server.
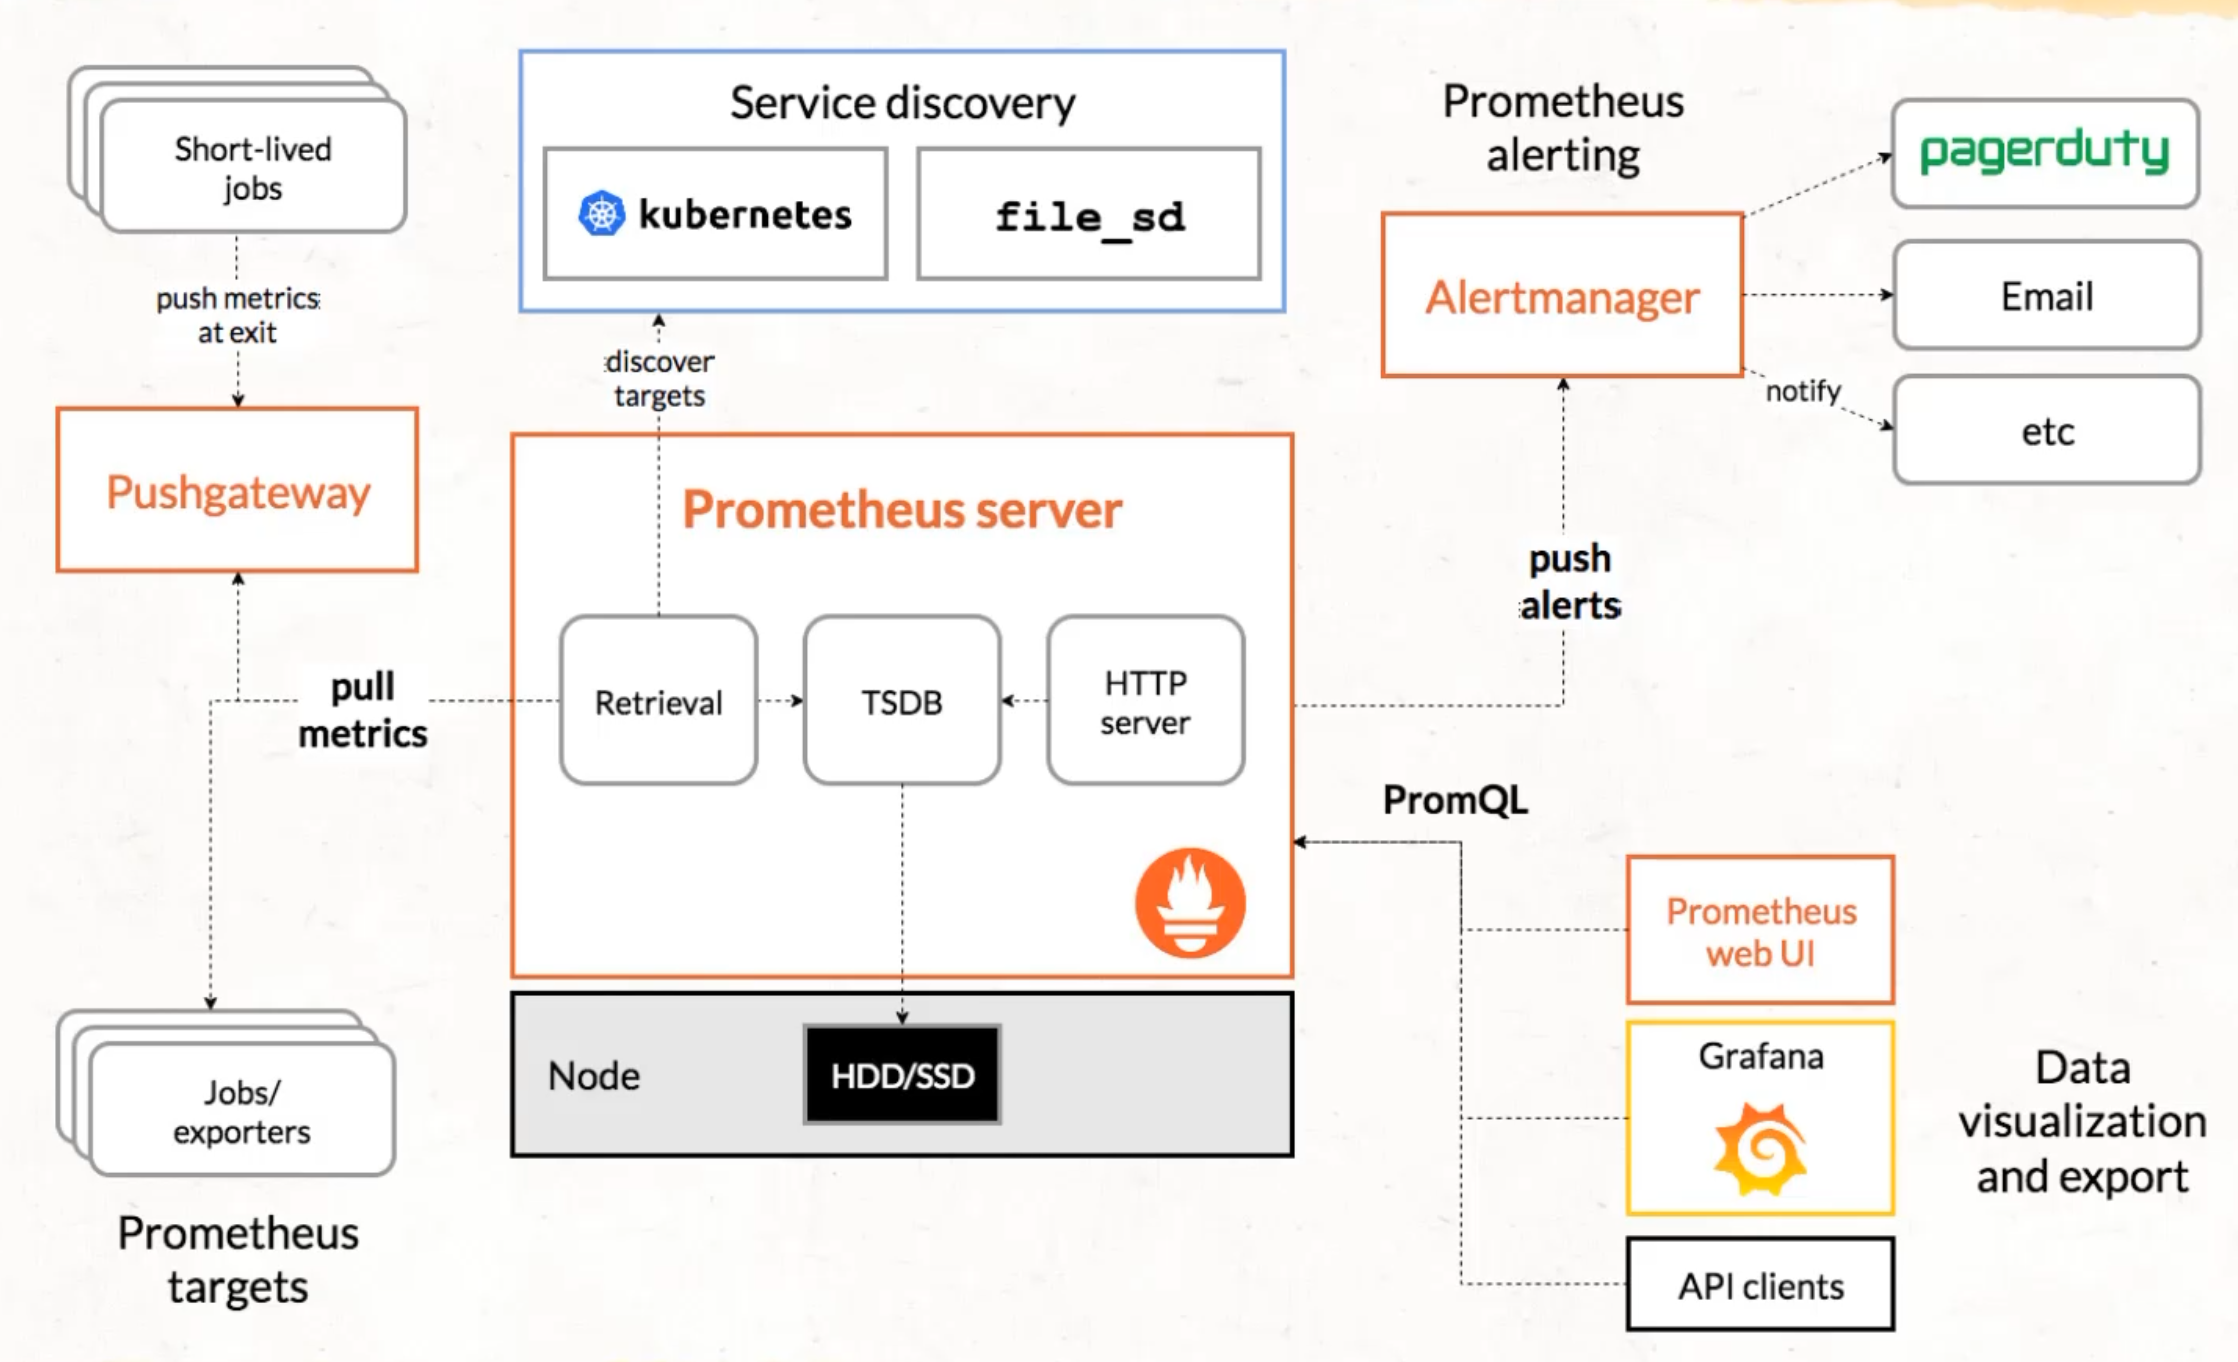
This might feel a bit intense.
There's a lot of things on this page, but that's because Prometheus actually handles a lot of complexity around this. It handles things like finding where the metrics are, collecting those metrics, storing them in a database, and presenting them to a browser.
It also even handles things like pushing alerts when those metrics don't meet our expectations.
For our purposes, we want to be able to use this as simply as possible.
So, what we're going to do is we're going to abstract away a whole bunch of this, and we're only going to focus on the bits that really matter to us.
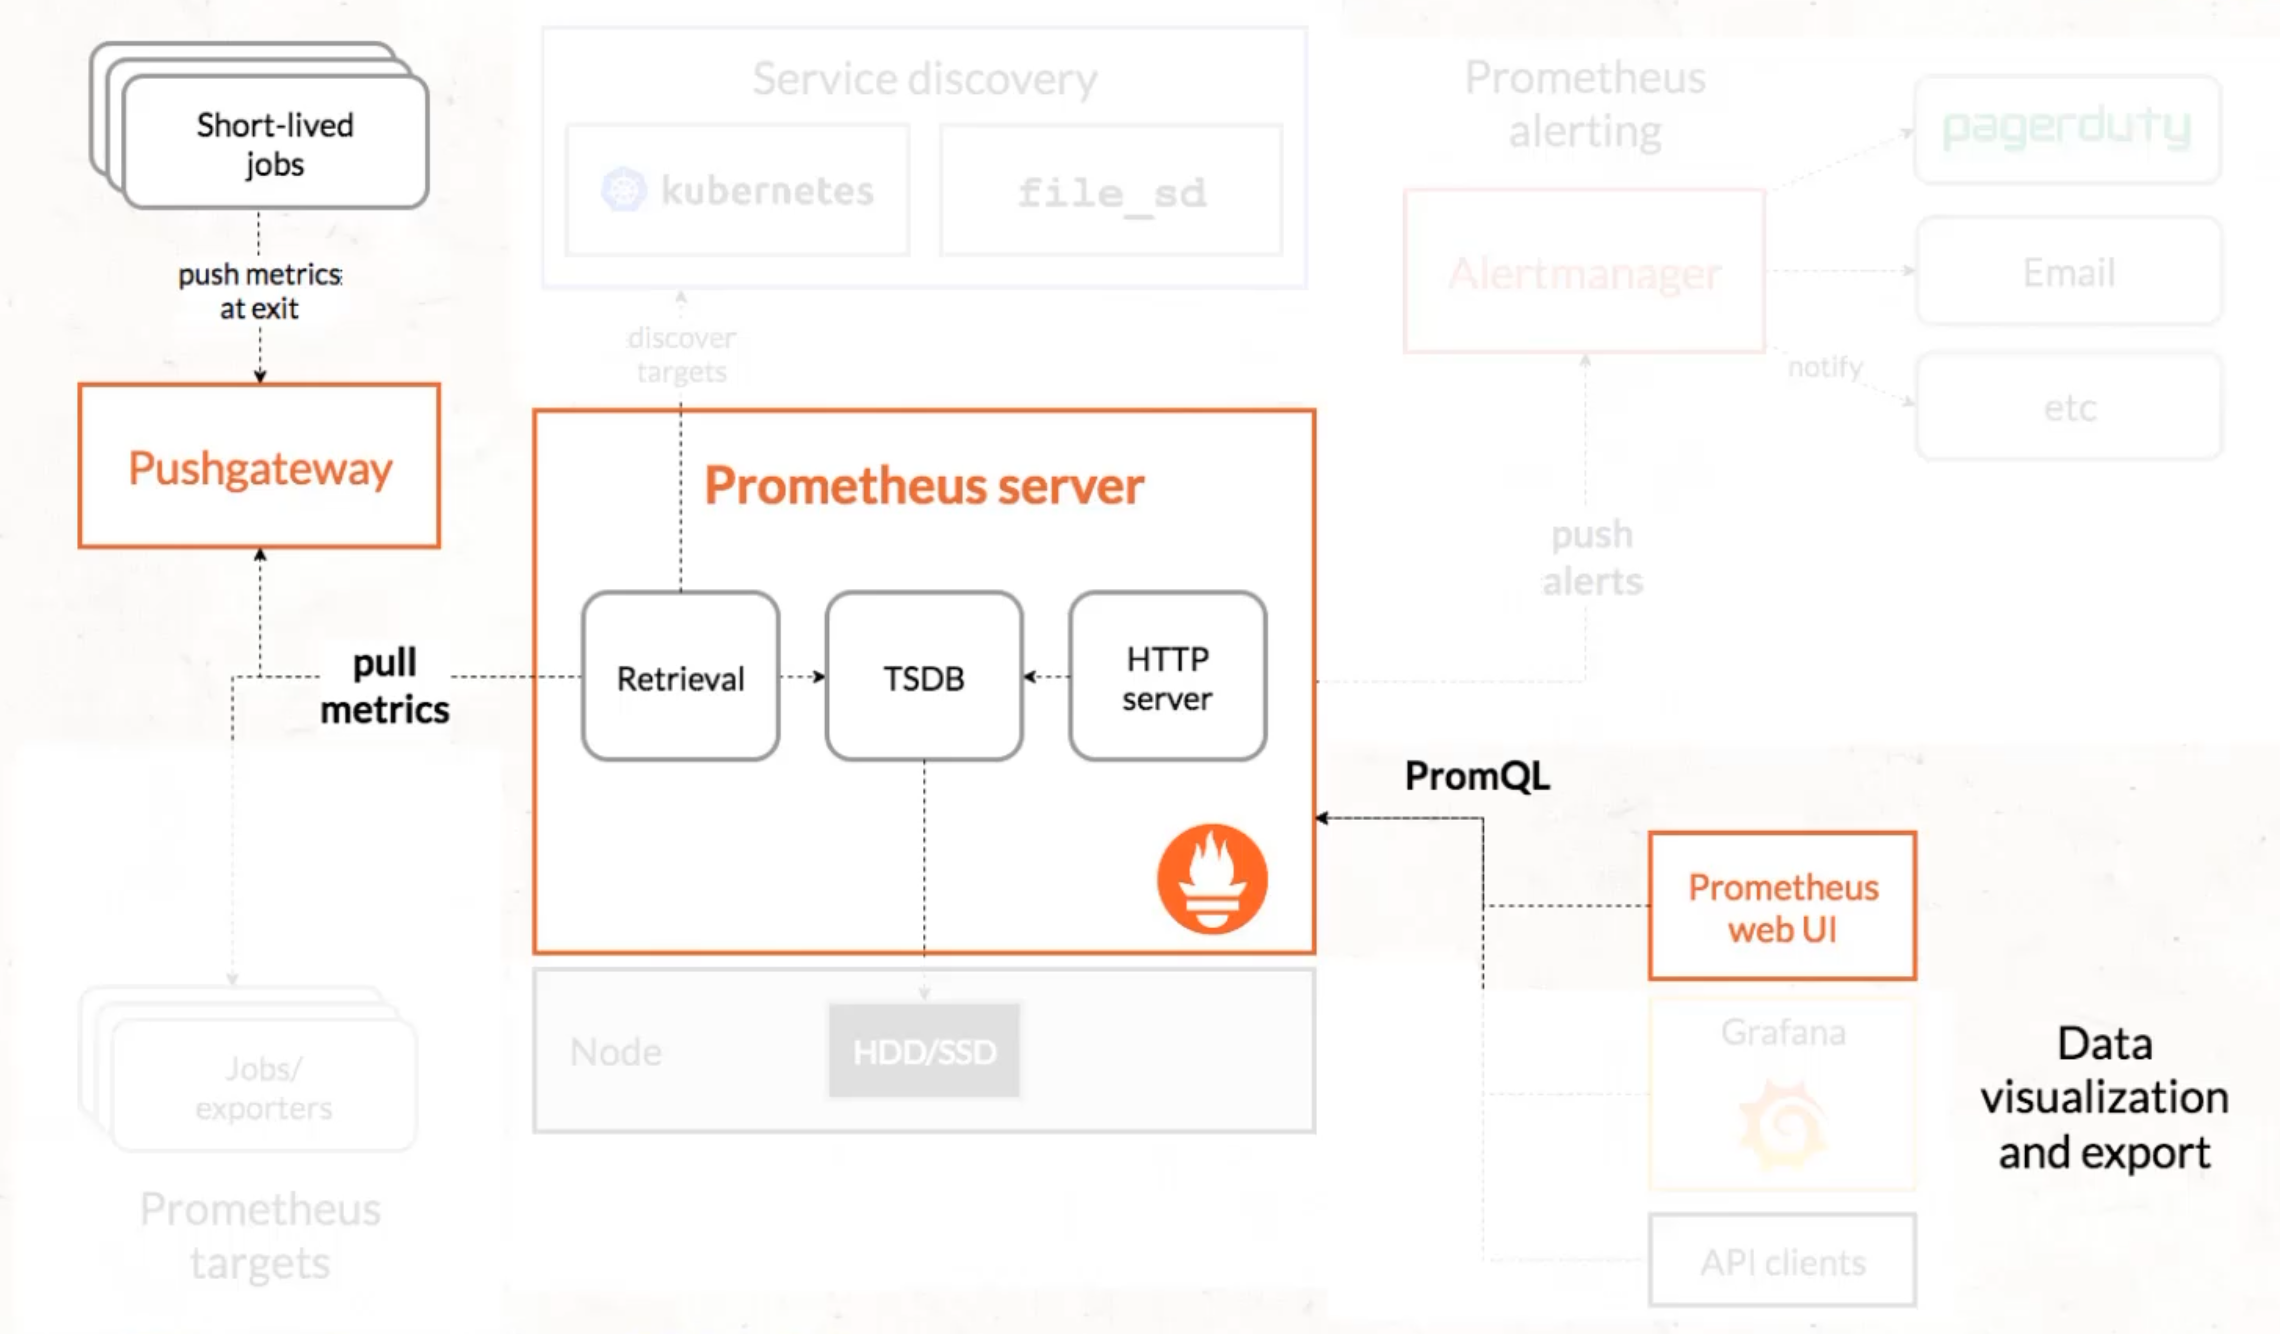
We don't really care about alerts right now, and we're not going to worry about service discovery or extra data visualization tools.
We just want the bare minimum.
And even within that bare minimum, we can abstract that away into docker containers.
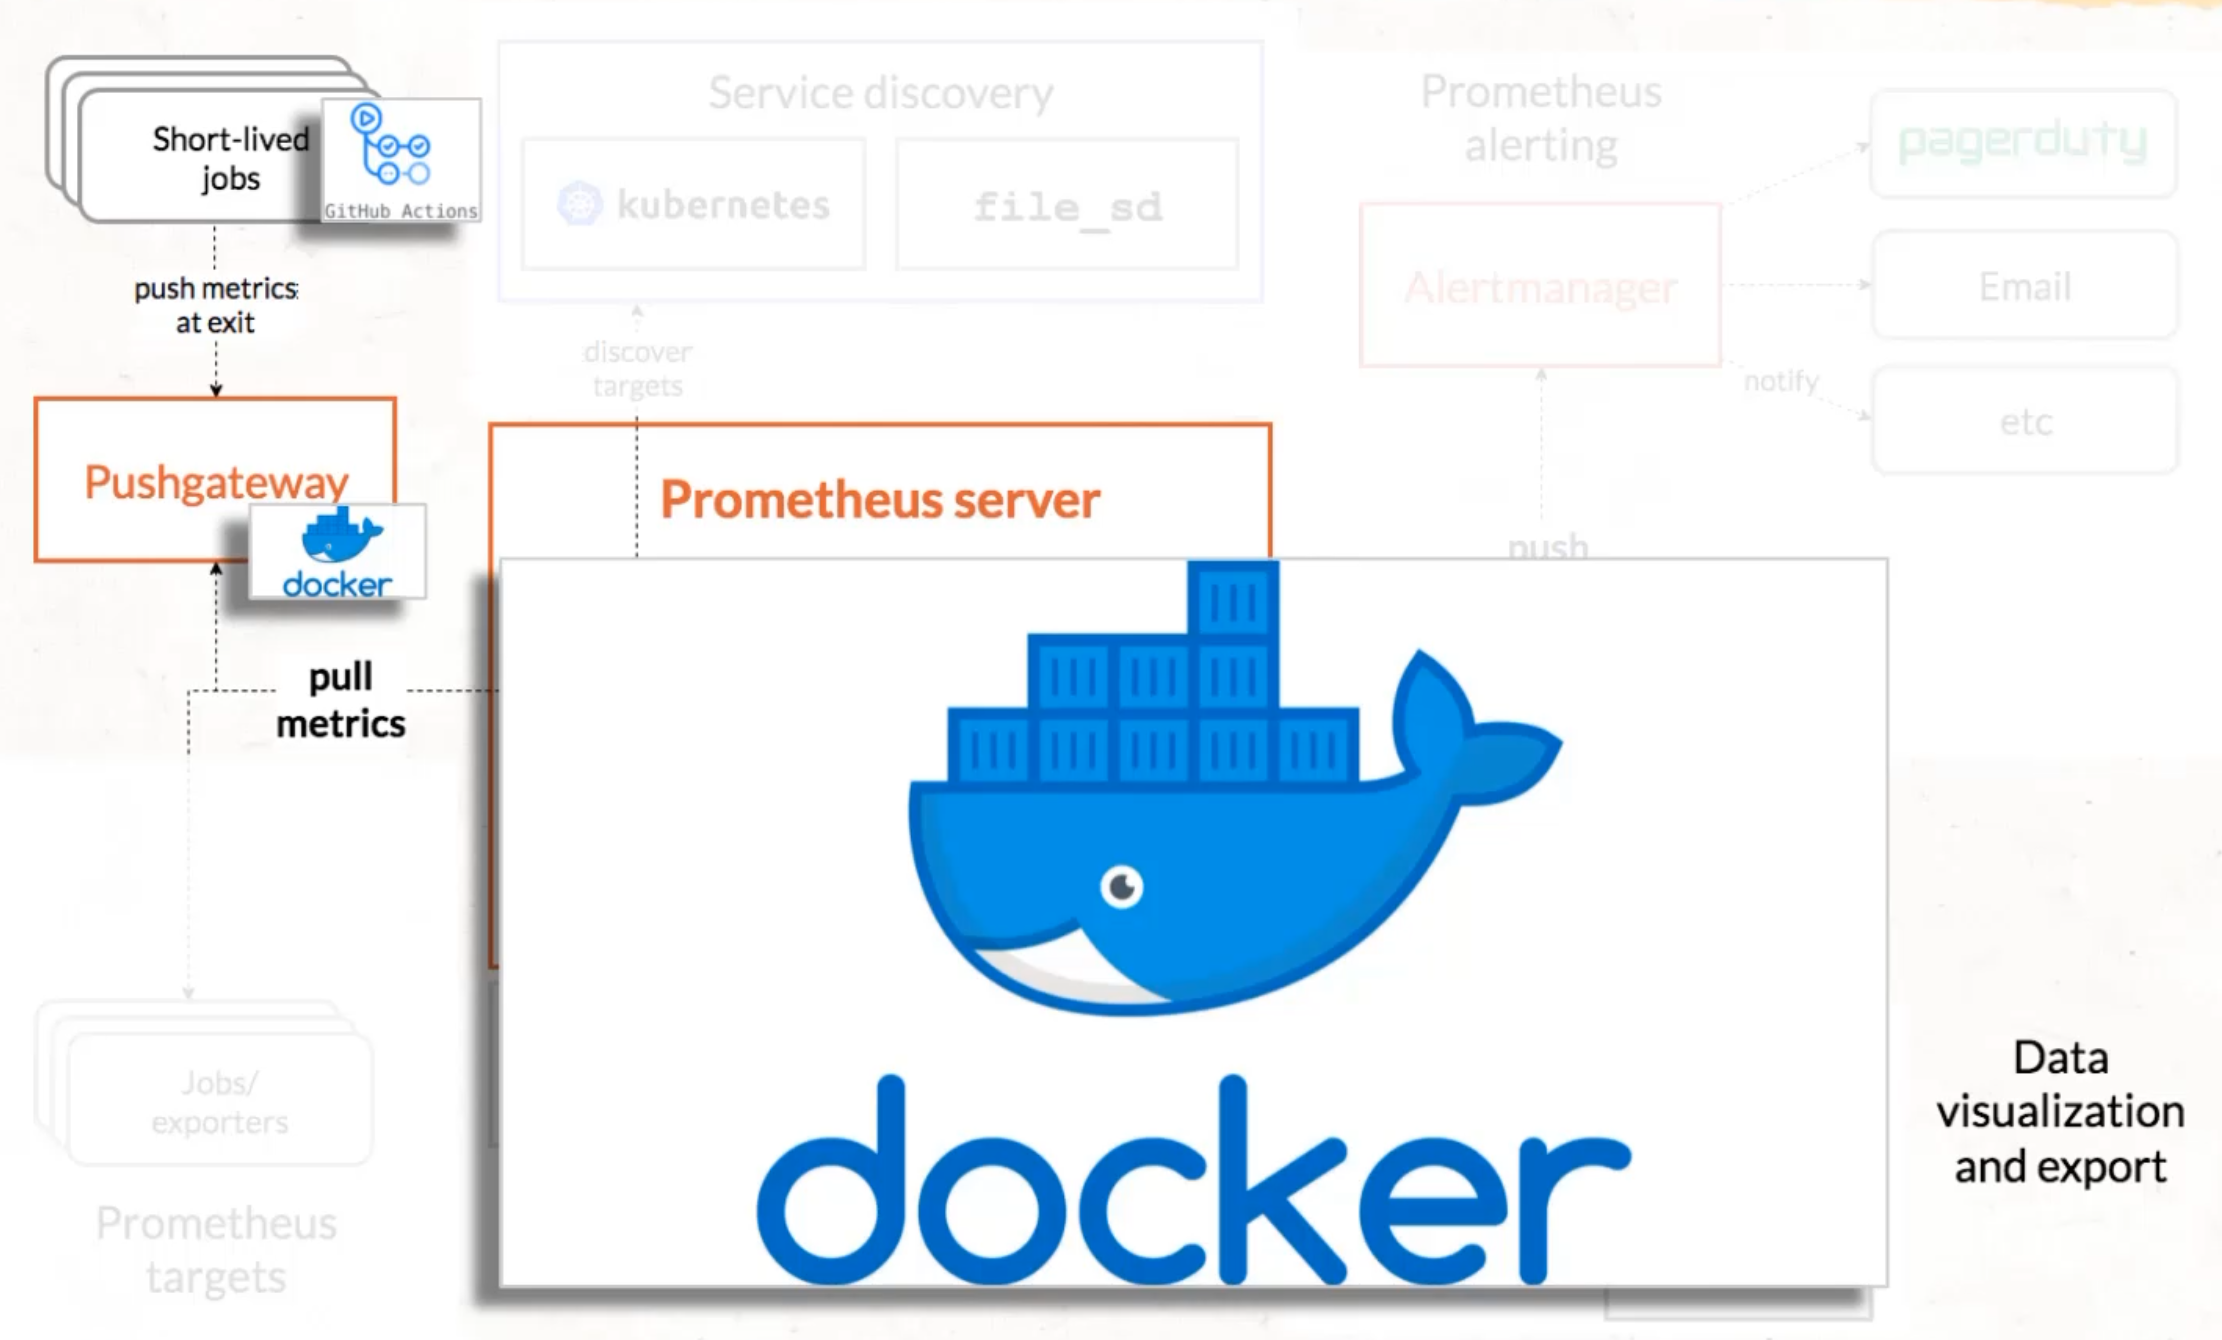
We can have a single docker container that takes care of the server, that collects and stores the data, as well as displays the data for us to query.
We then can have a second docker container, which provides the location for our short-lived jobs or GitHub Actions jobs to push the data in.
# What is Docker?
Today, we're going to be using Docker a little bit more intensely than we have previously.
Let's quickly look at what Docker does.
Docker allows us to isolate a type of web server, regardless of what operating system we are currently running, or that web server needs to run.
Right now I'm running a Windows laptop, but I want to be able to run this Prometheus server, which is actually on a Linux type operating system.
To do that, I can use Docker, which will isolate into this container all of the things necessary to run a Linux process, even though it's on my Windows machine.
This is somewhat similar to the world of virtual machines if you've used that before, though there are differences - it's a useful model to compare.
If you want to learn more about Docker, there's a fantastic course on Test Automation University about getting started with Docker, and you can check that out from Carlos Kidman.
But you don't need to be an expert in Docker to get going with our course.
We'll be following along as we go.
# Docker with Prometheus
What we're going to do next is we're going to generate a Docker container for the server and a separate Docker container for the push gateway.
In order to do this, we need to download these Docker containers, just like we did previously with the Ubuntu container.
So, I'm going to go to Docker Desktop, and I can see that I don't have any images for Prometheus just yet - I only have Ubuntu.
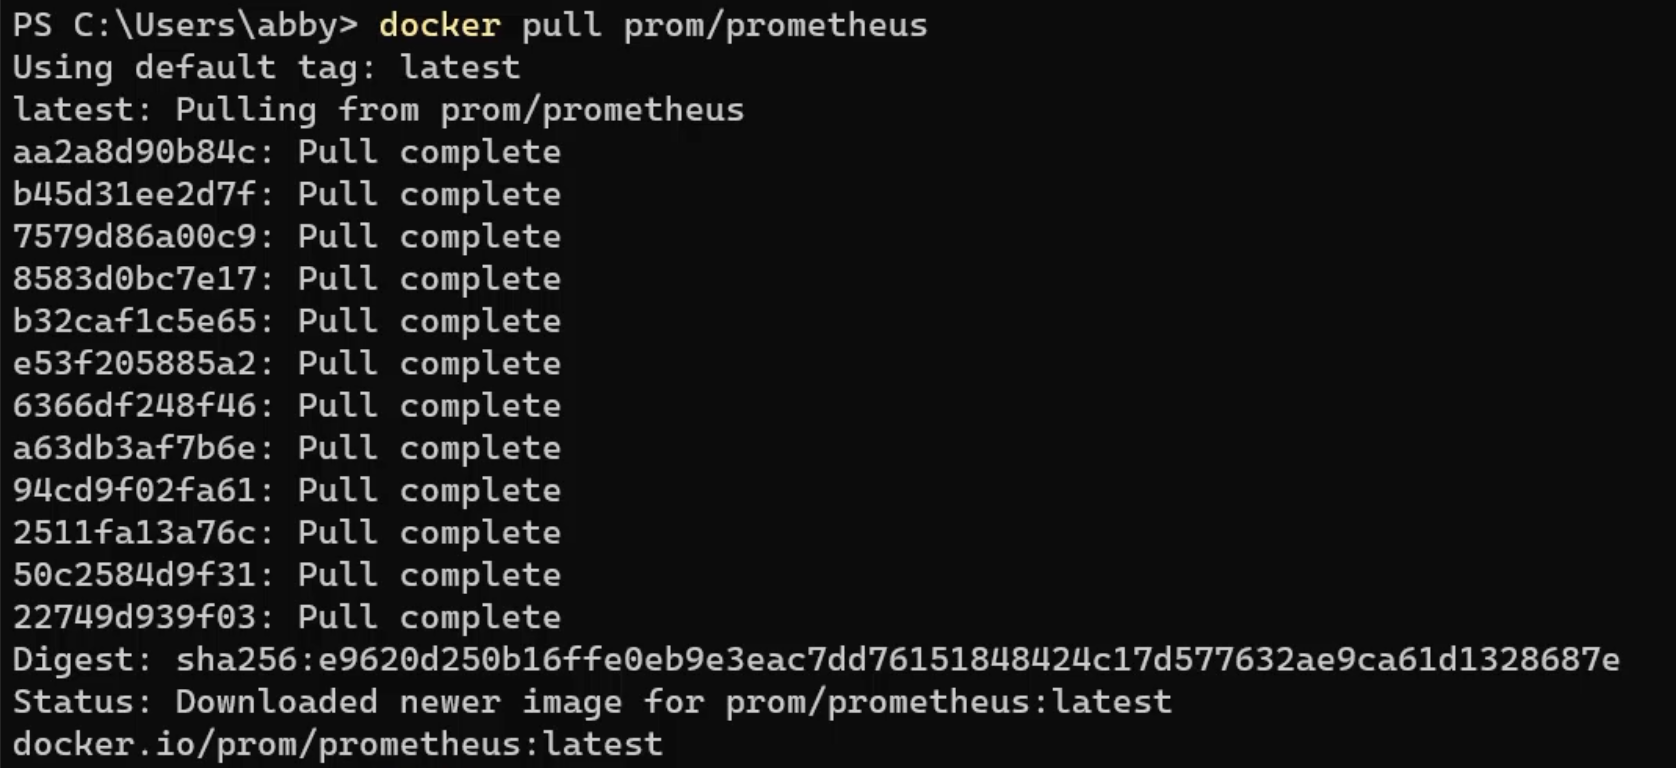
I need to now go to my command line and use the docker pull command to pull the Docker images, and the image that I want to pull down is prom/prometheus - this is the Prometheus server image.
docker pull prom/prometheus
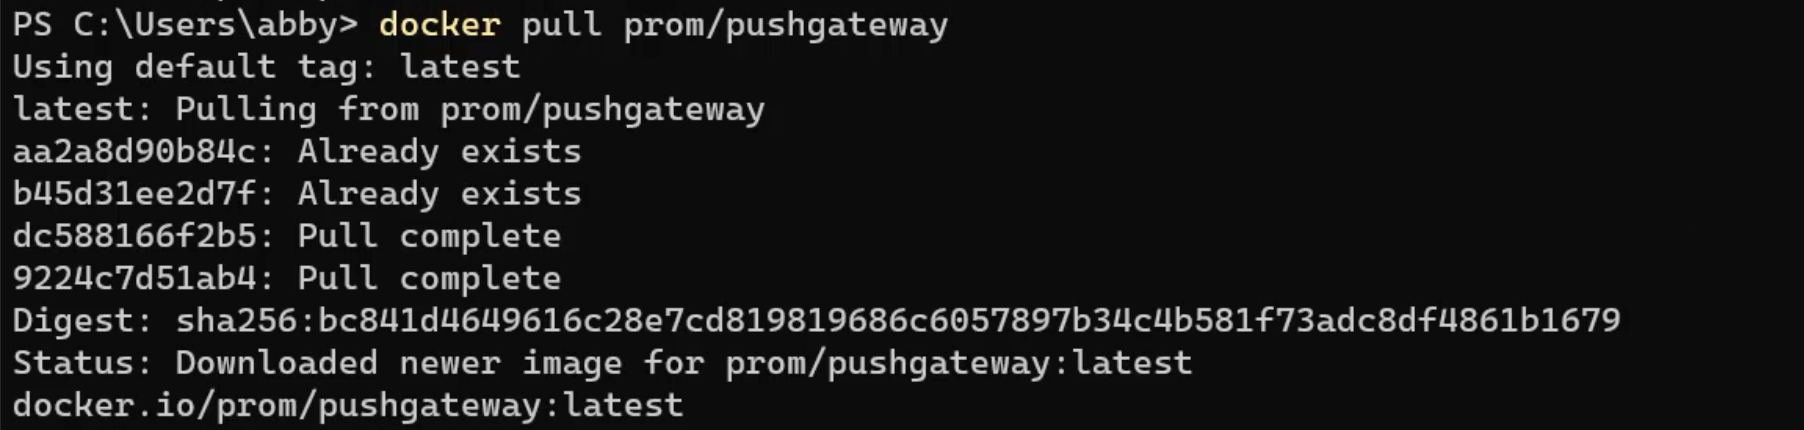
Next, I need to pull down the other Docker image, which is for the push gateway.
docker pull prom/pushgateway
Now that I have those, I can go ahead and run them via Docker Desktop.
When I'm running these, I'm going to have to run them slightly differently than I did last time.
When I come over and I click the "Run" button, I'm going to have to open these optional settings.
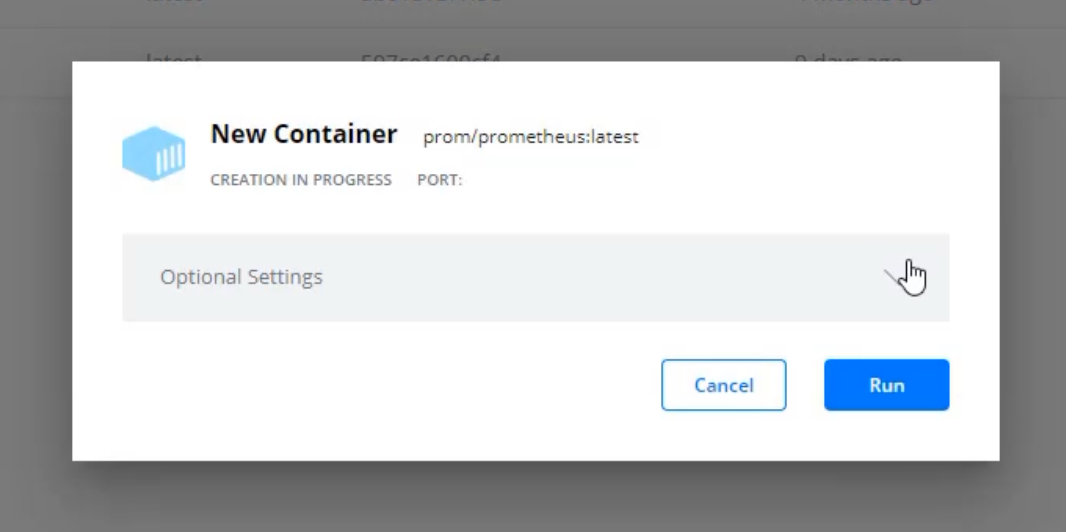
In particular, I need to introduce a Local Host port.
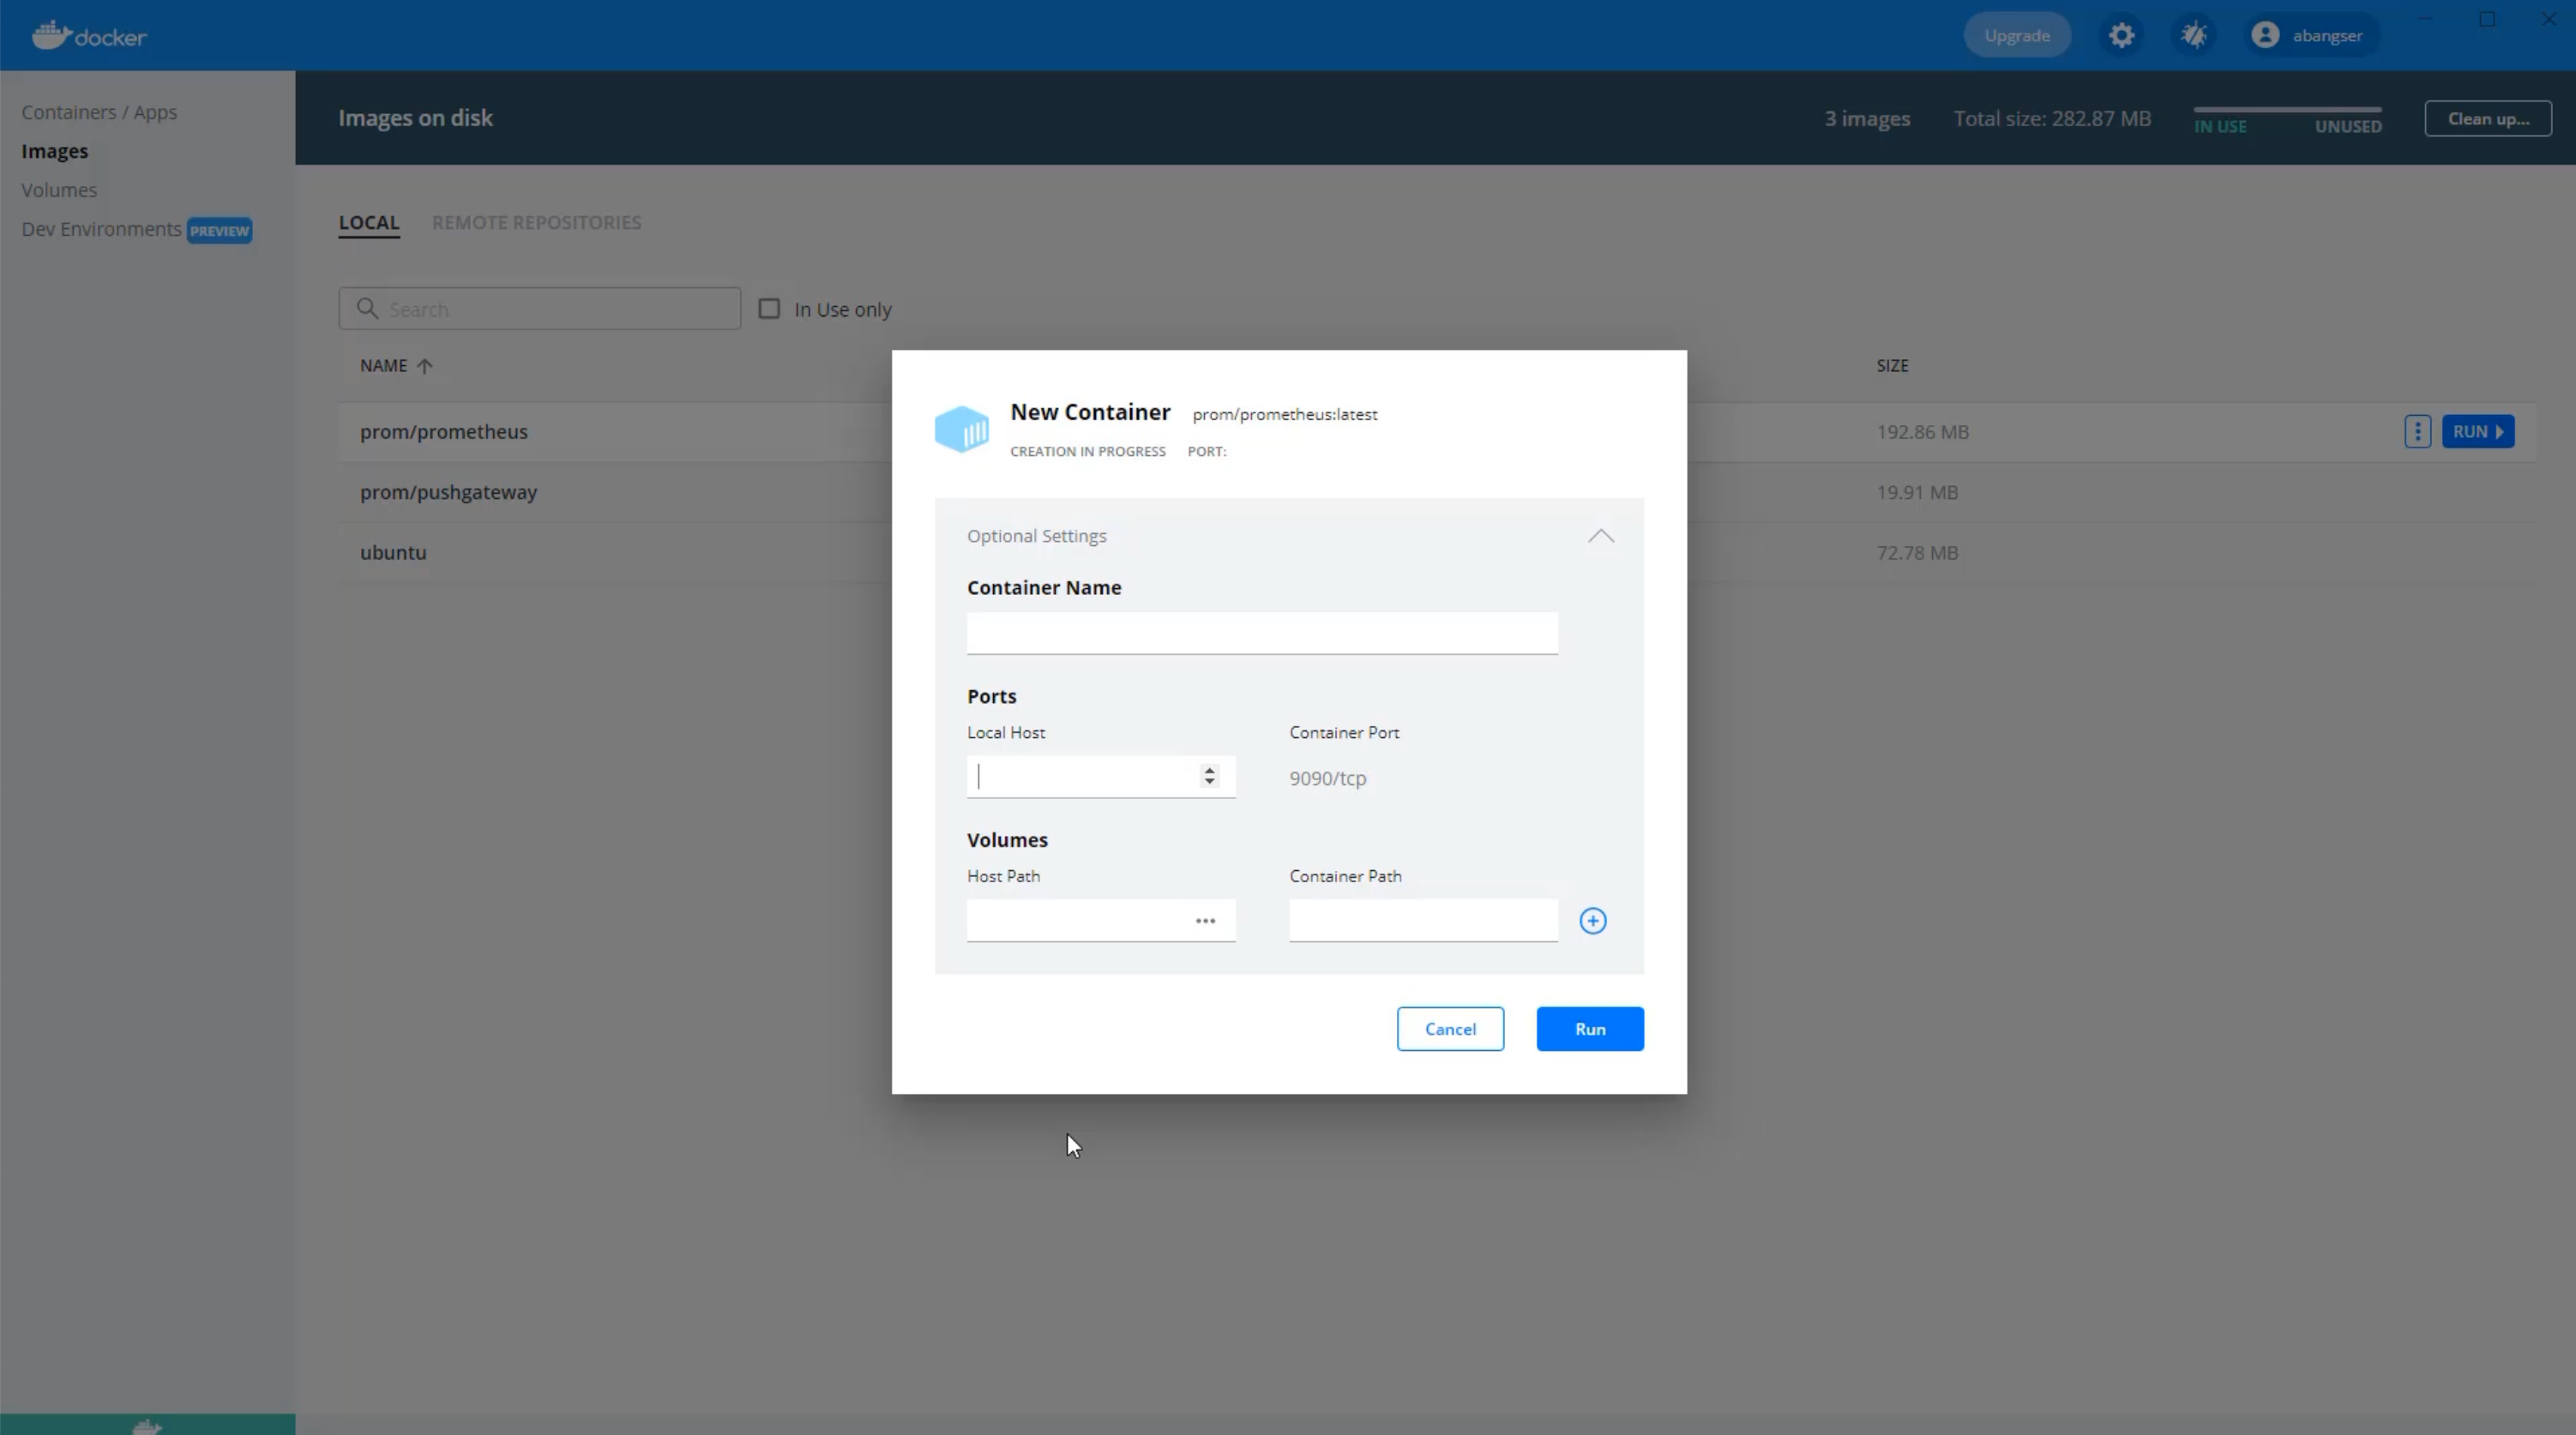
What this does is it allows for the web server that's running in the container to have access to my laptop so that I can see it.
It's a little bit like opening a window into the container.
I can pick any number here that's over about a 1000, but I tend to pick the same number that is used by default inside the container.
We can see here that the container is using 9090, so I'll use 9090 as well.
Now, when I click "Run" and see the container starting, I have a new button that wasn't available when I ran the Ubuntu.
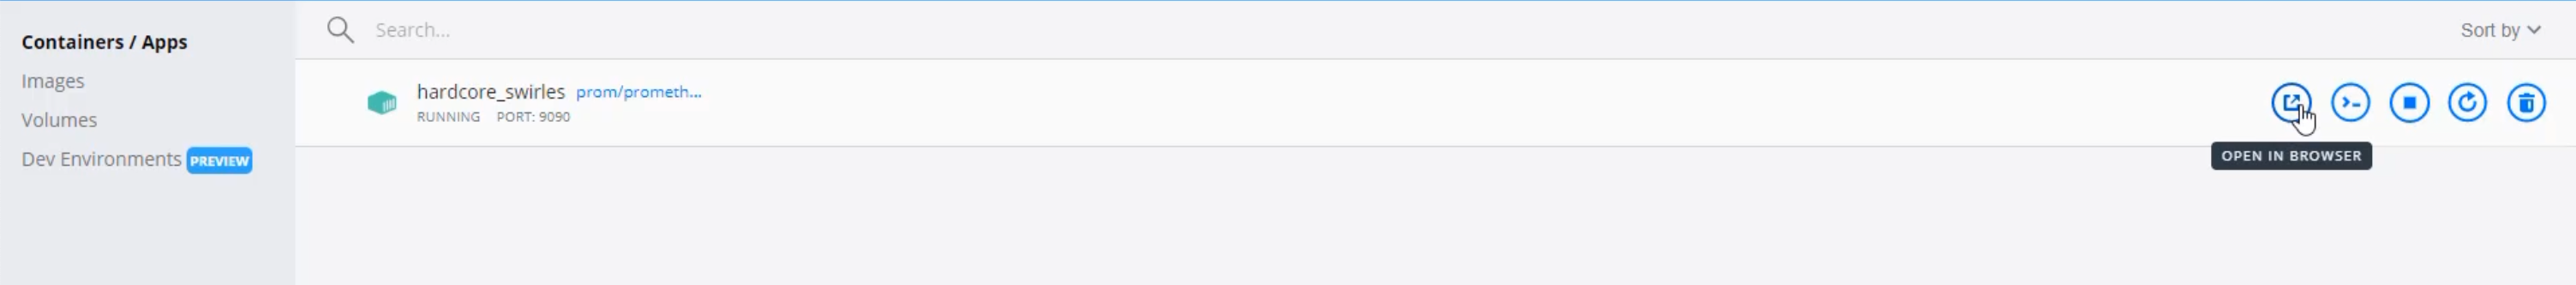
I can actually open this in the browser.
When I click that button, I get loaded up a localhost:9090 website, and here is Prometheus running in a container on my laptop.
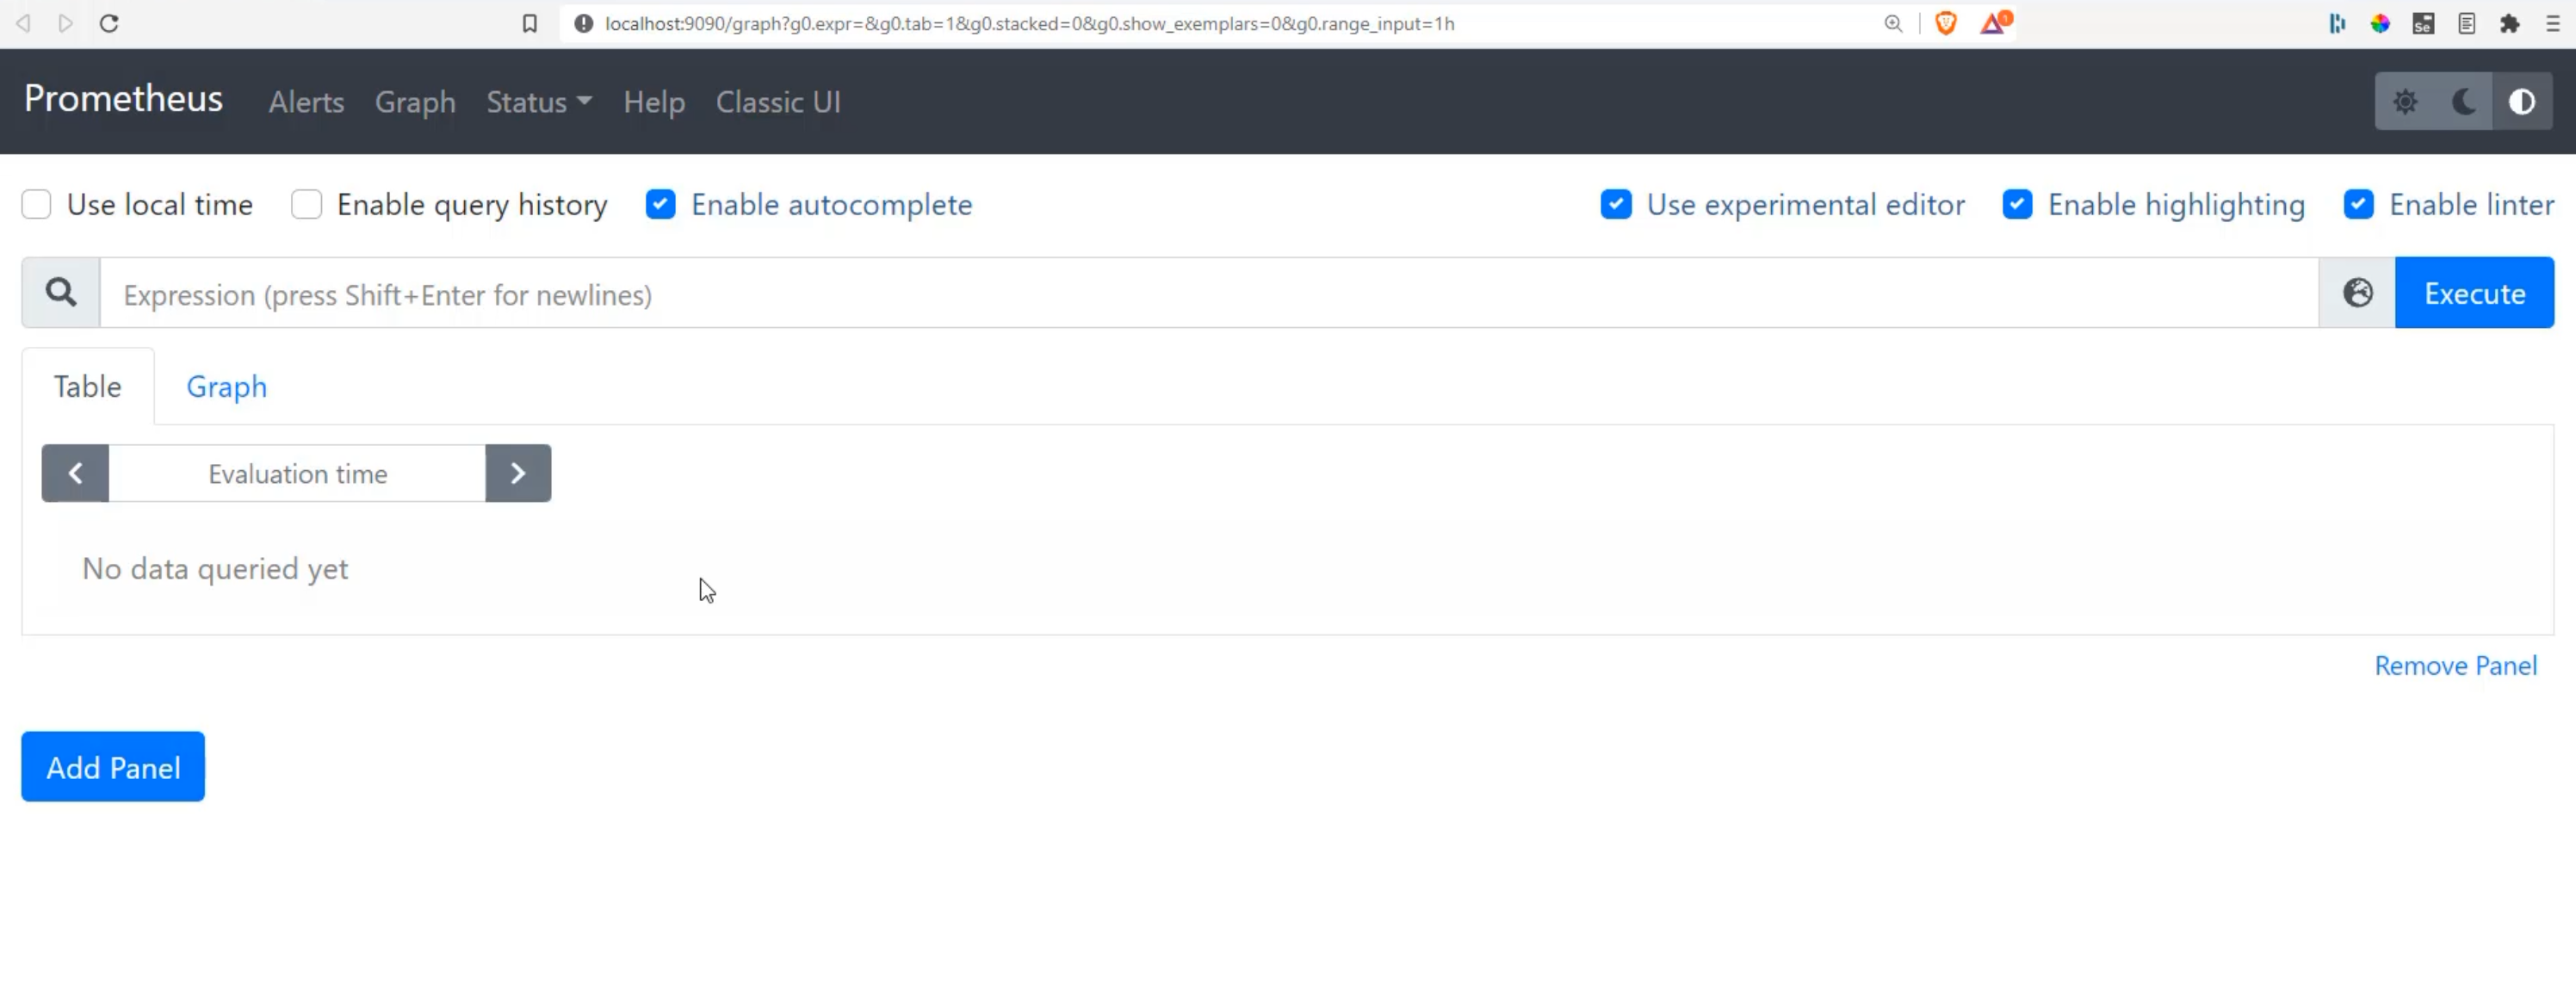
It doesn't do too much yet, but we can take a look at the configuration.
Under "Status", we can see "Configuration".
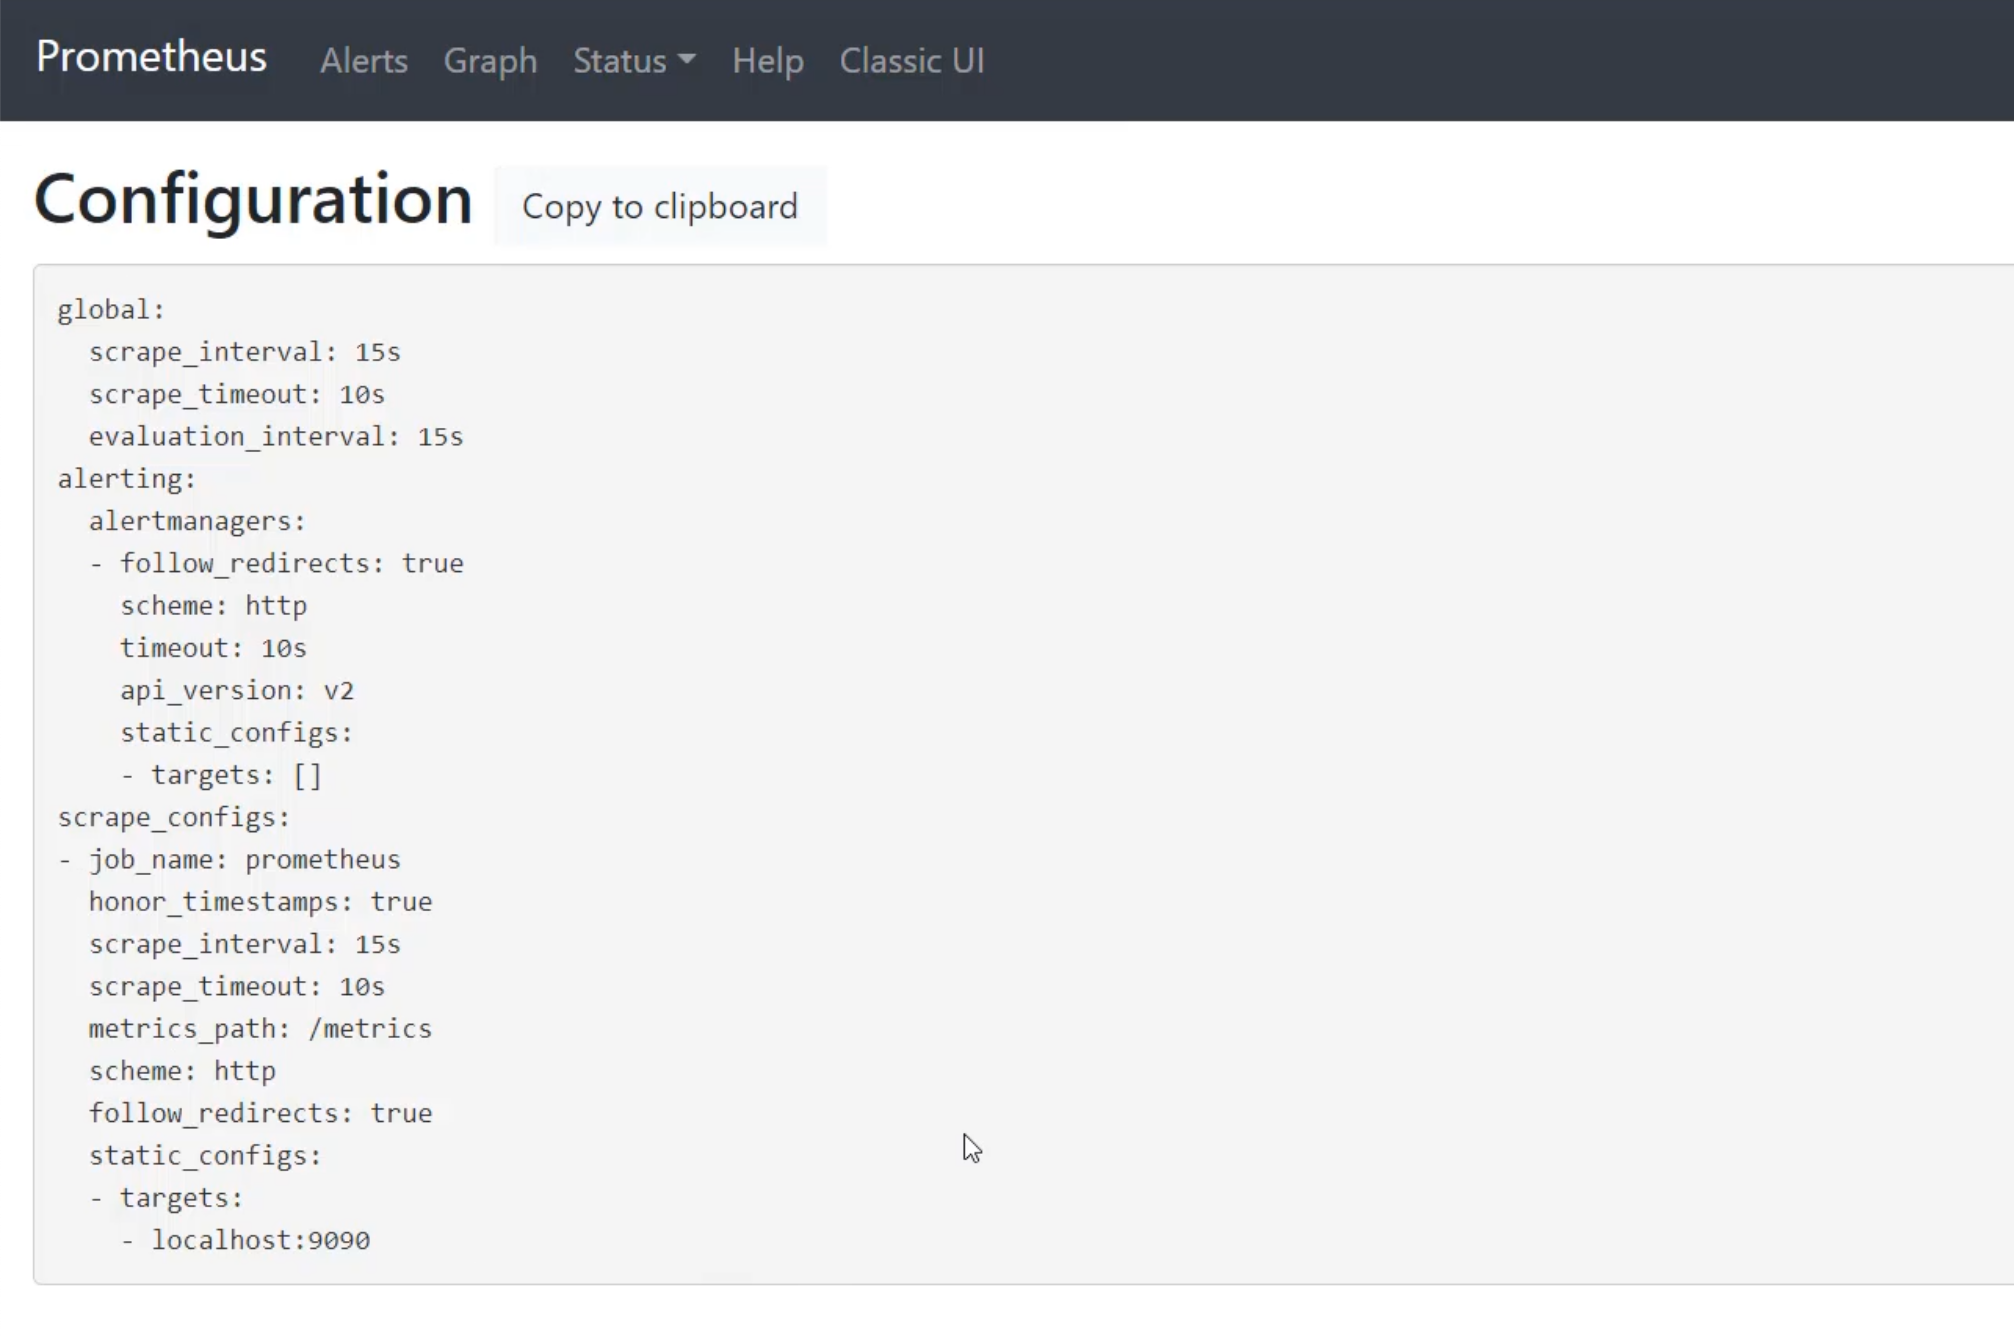
This is all of the configuration that we have in this piece of software.
I'm going to call attention to two specific bits.
The first bit scrape_interval is how frequently we do that pull or that scrape of our software.
Right now, it's configured to do that every 15 seconds.
It's quite common to leave this as is, because that is a reasonable scrape interval.
The second thing I want to look at is the scrape_configs.
This is a list in YAML of jobs, and the only job that it currently has is the prometheus job.
Prometheus is actually monitoring itself.
# Prometheus Metrics
Prometheus is going to localhost:9090, and going to the endpoint /metrics to get the metrics from itself.
We can go to localhost:9090/metrics and this is the set of metrics that we are seeing in Prometheus right now.
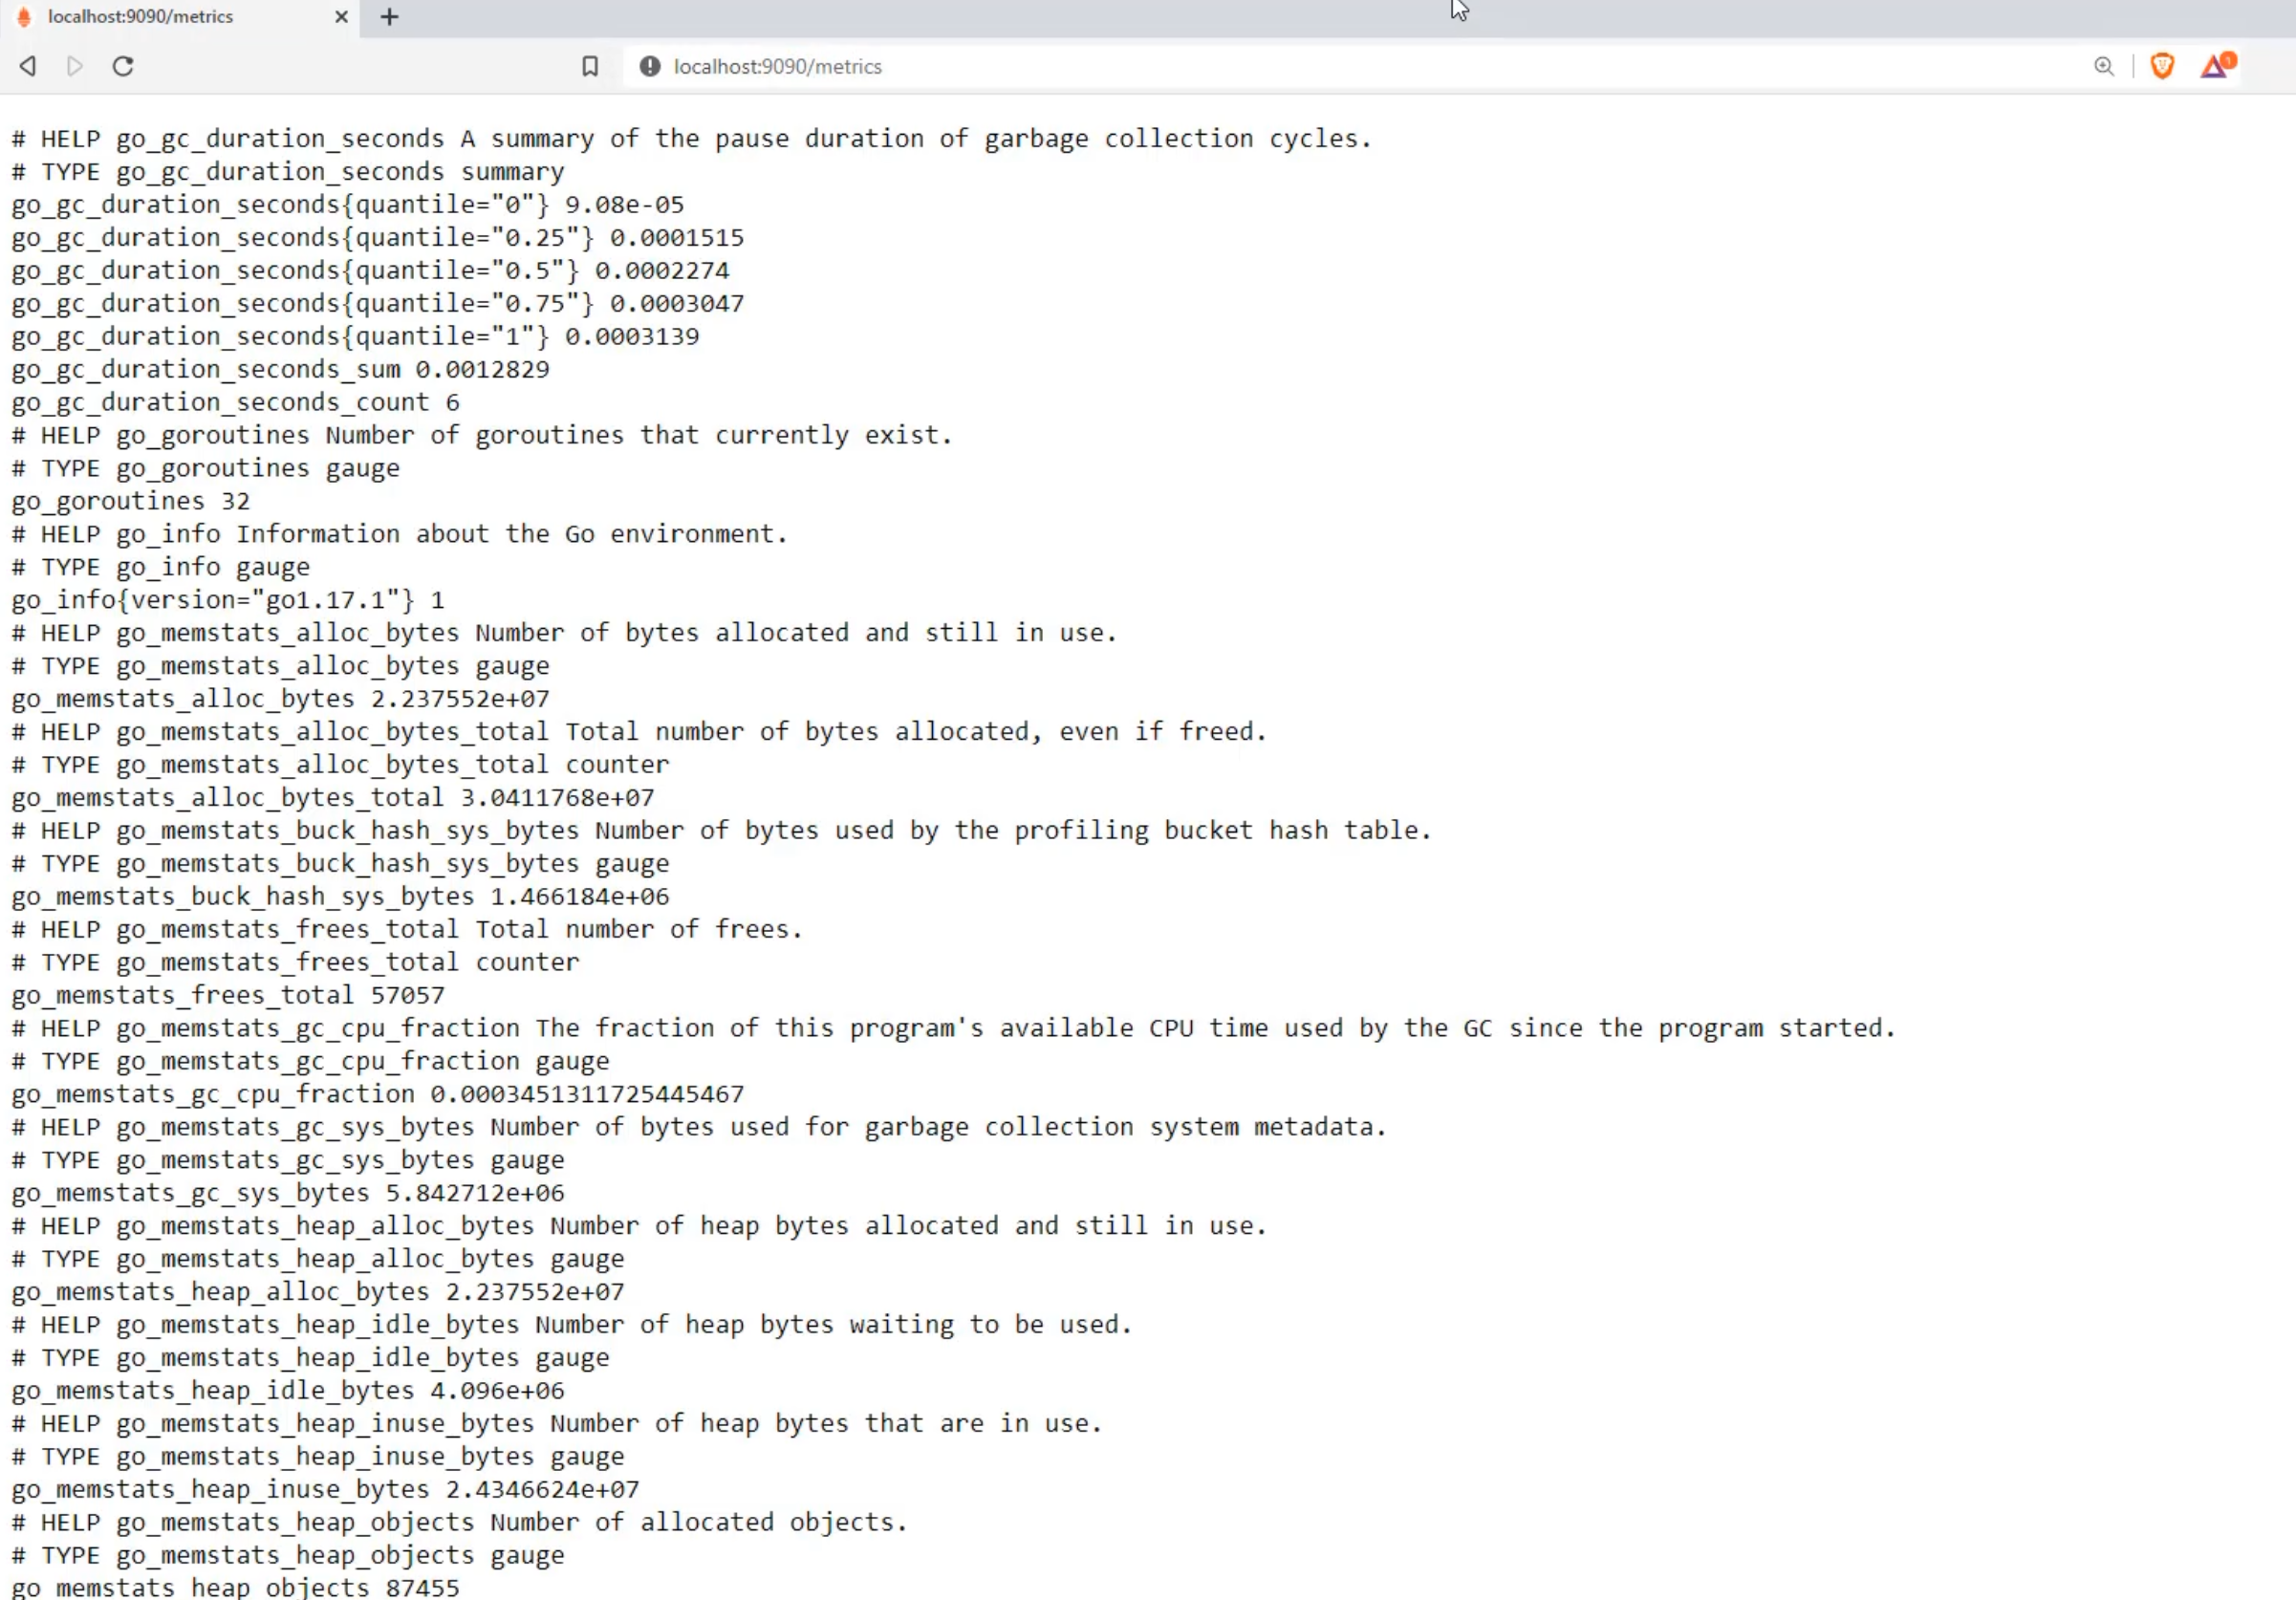
You can see that it is a text-based screen, and it has all sorts of metrics from very low level things around the language that it's using - this is go for GoLang - down to things that are more, maybe business oriented, like HTTP requests, or about its remote storage and rule evaluation.
We're going to talk a lot more about what these are, but let's get started first by just seeing any of these metrics in a graph format.
I'm just going to use the first metric here, go_gc_duration_seconds, and I'm going to return to Prometheus and go to the "Graph" view and paste that in.
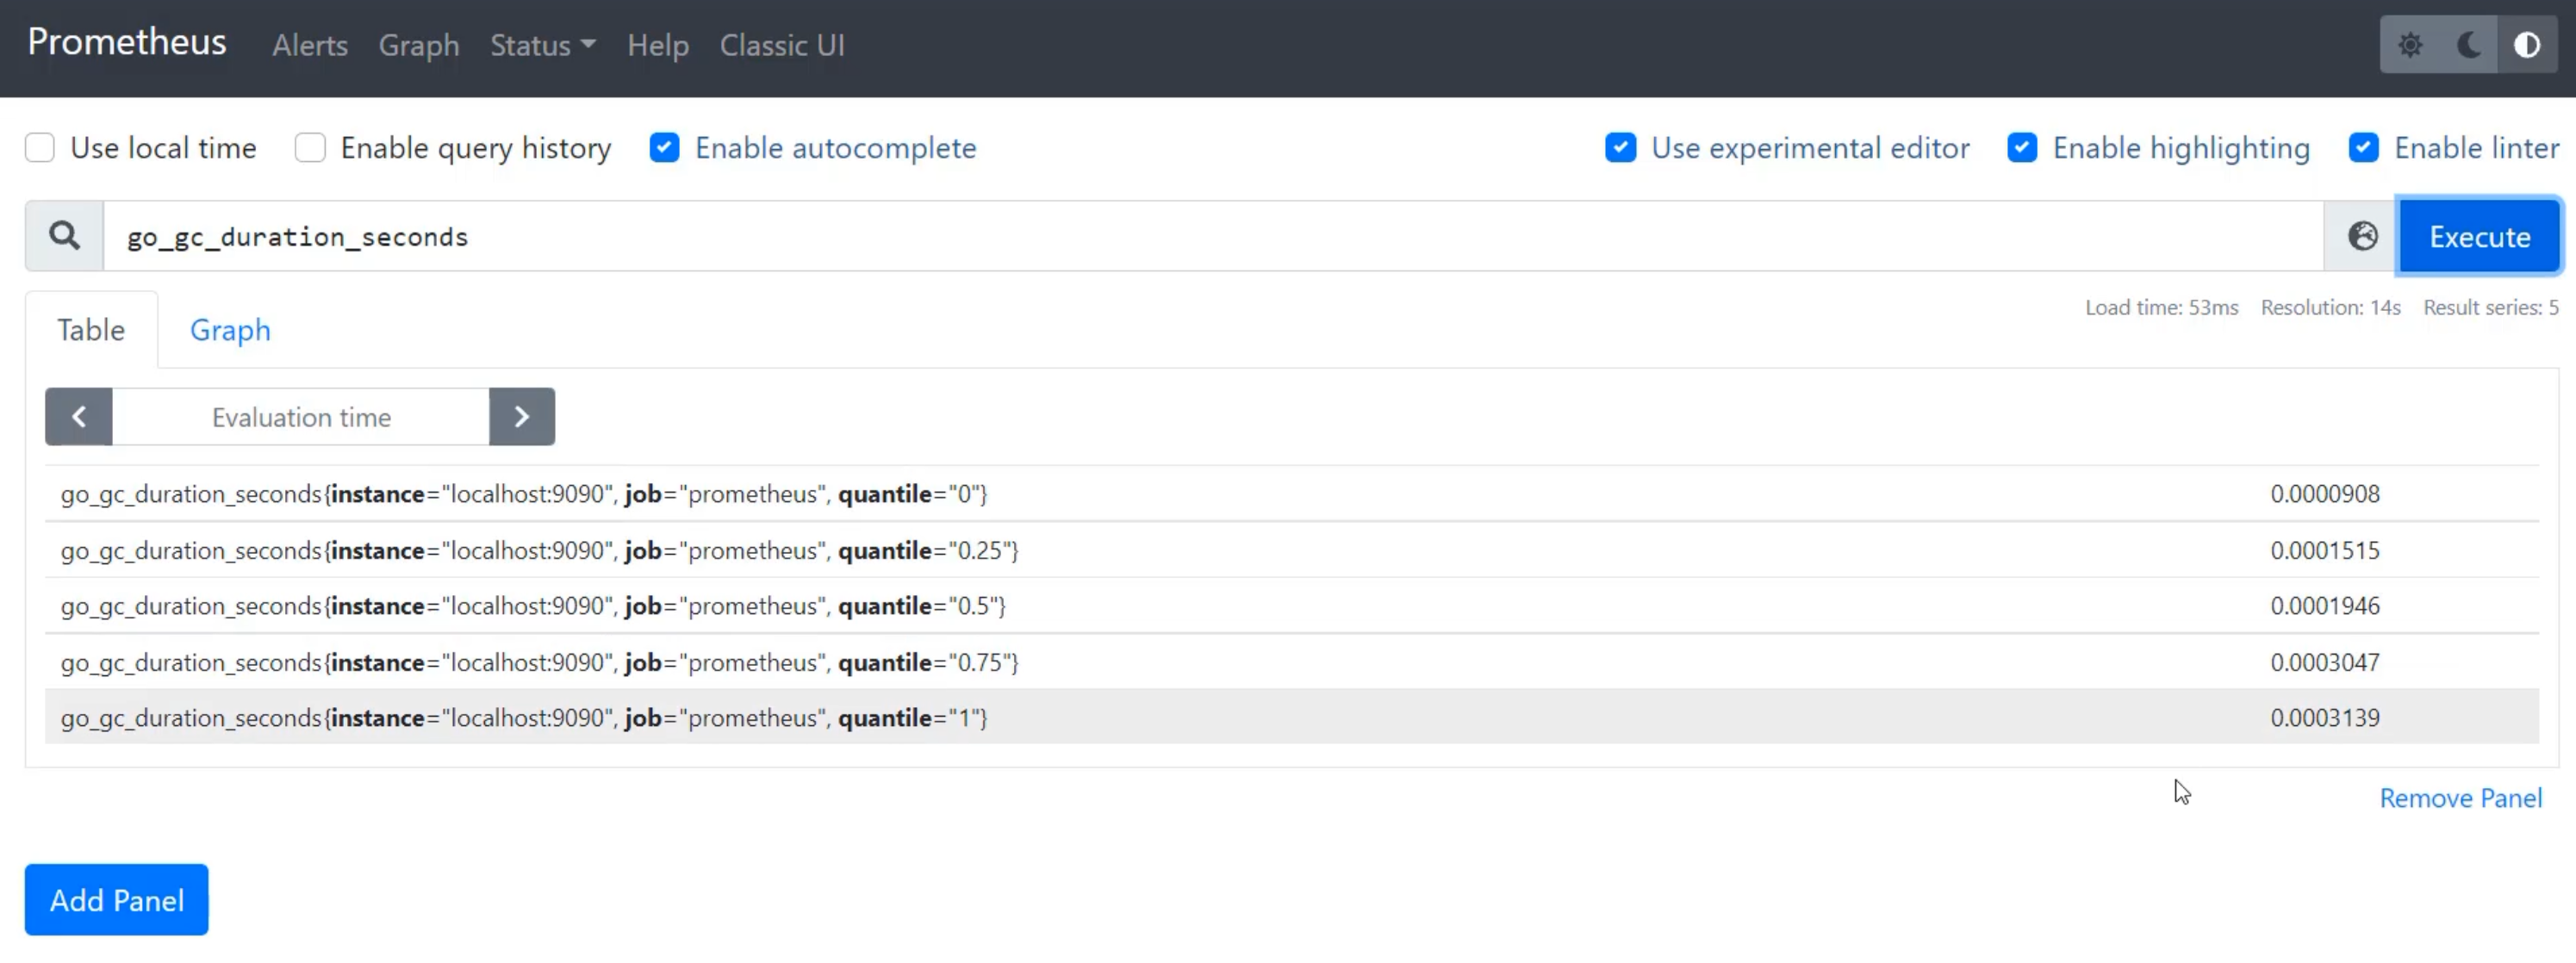
When I execute that, I can see that I get a number of different metrics.
They all are called go_gc_duration_seconds, but they have these different tags on them - instance, job and quantile.
Instance speaks to what is the Prometheus that created this scrape, so this will be the same for all metrics, because we only have one server doing metric collection.
Job is the name of the job that collected it, because we can have more than one piece of software that generates this metric.
With job, we're able to tell that the actual piece of software generating the metric is Prometheus.
Quantile is something which is specific to this metric, which tells us if this is in the bottom zero quantile, the 25th, the 50th, 75th or the top quantile.
This allows us to compare over the scale of the data.
If I graph this, I'll see the five different lines for each of the quantiles displayed over time.
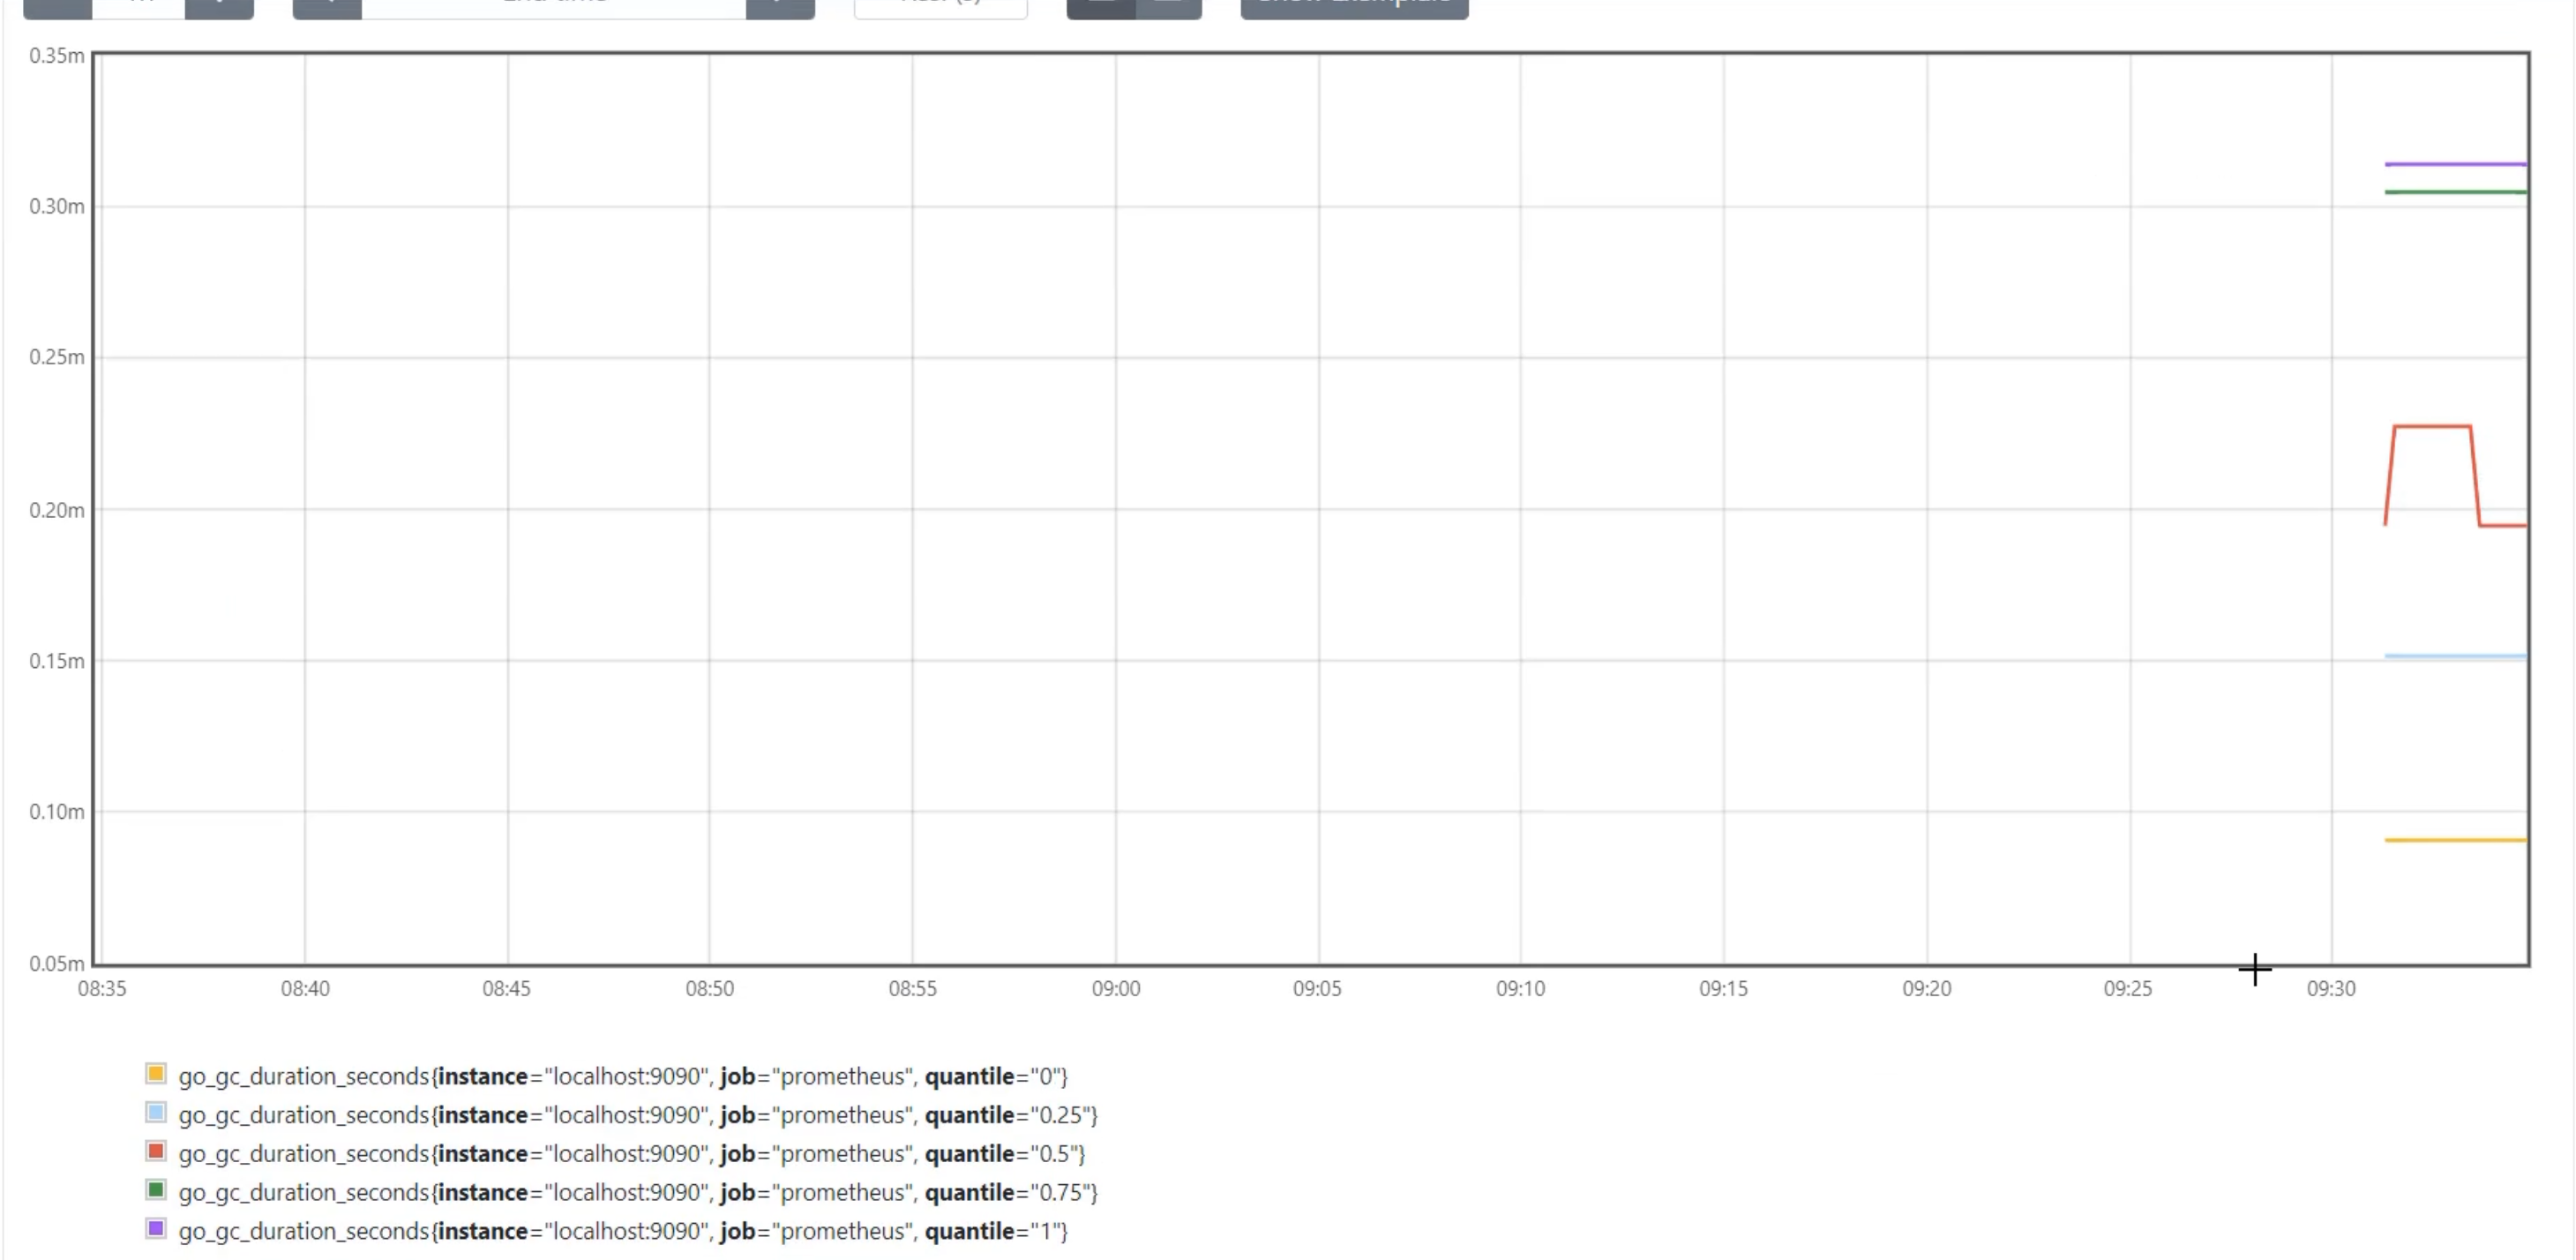
You can see that they might change over time, but that the server hasn't been running for very long, so there aren't that many interesting calculations yet.
But there's Prometheus for us.
# Prometheus Pushgateway
Let's go ahead and start up Prometheus pushgateway and see what that looks like.
Back in Docker Desktop, I can go to "Images" and I can start prom/pushgateway.
I again need to expose that website, so I'm going to go to optional settings and add a localhost.
I'm going to choose 9091, because I want to match the container port, though that's not required so you can play with that localhost port.
Then I'm going to hit "Run", and I'm going to allow that to get started.
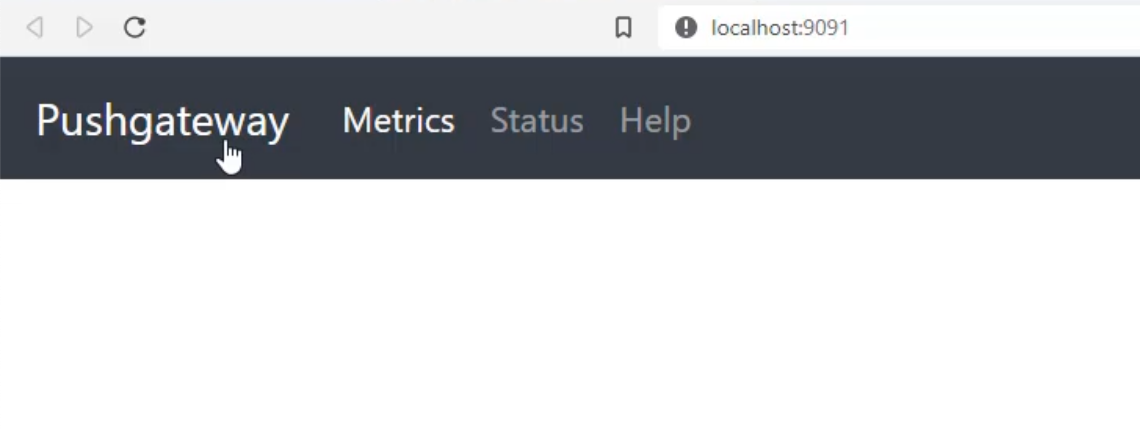
Once I click "Open in browser", it will open up the localhost:9091, and we will see "Pushgateway".
I can even see metrics for Pushgateway by going to the /metrics page and seeing that it has, for example, the same GoLang metrics, because they're both written in the same language.
But we can see down as we go further that we have specialty metrics that are pushgateway related.
So, pushgateway_http_requests_total instead of prometheus_http_requests_total.
When we return to the user interface, we can see it's quite blank.
What this does is it's actually just a bucket for us to push metrics to.
At this stage, we haven't actually pushed in any metrics yet.
# Sending metrics
In order to get a sense of what this looks like, I'm going to quickly send a test metric, but we're going to get into this a lot more in future chapters, so don't worry about copying along if you're getting stuck.
Here I am in a terminal that can make a curl request.
With this curl request, I'm going to ask it to send some data to Pushgateway.
The data I want to send, I'm going to put into a string here, and an echo.
echo "chapter-9-metric $(date +%s)"
I'm going to send chapter-9-metric as the metric, and I'm going to send in the current timestamp in the way we did previously - creating that numeric representation - so that will be with $(date +%s).
This will be the metric that I'm going to store, and we can basically see that changing over time, because time will continue to tick on.
Then I'm going to take that string and I'm going to send it into a curl request, and I'm going to take that data and I'm going to store it here for the post request, using the @- symbol.
I'm going to send that to http://localhost:9091 and I'm going to send that directly to the metrics endpoint, and I'm going to pass in the job name here in the URL - so the job I'm going to be calling it is going to be chapter 9.
When I press "Enter", I will see that I had an issue with the name of the metric.
I'm going to redo that, but I'm going to remove the dashes from my metrics, so it's going to be underscores instead.
echo "chapter_9_metric $(date +%s)" | curl --data-binary @- http://localhost:9091/metrics/job/chapter9
That successfully sent.
Now, when I return to the browser and I refresh the Pushgateway page, I can see that I have a job called "chapter9".
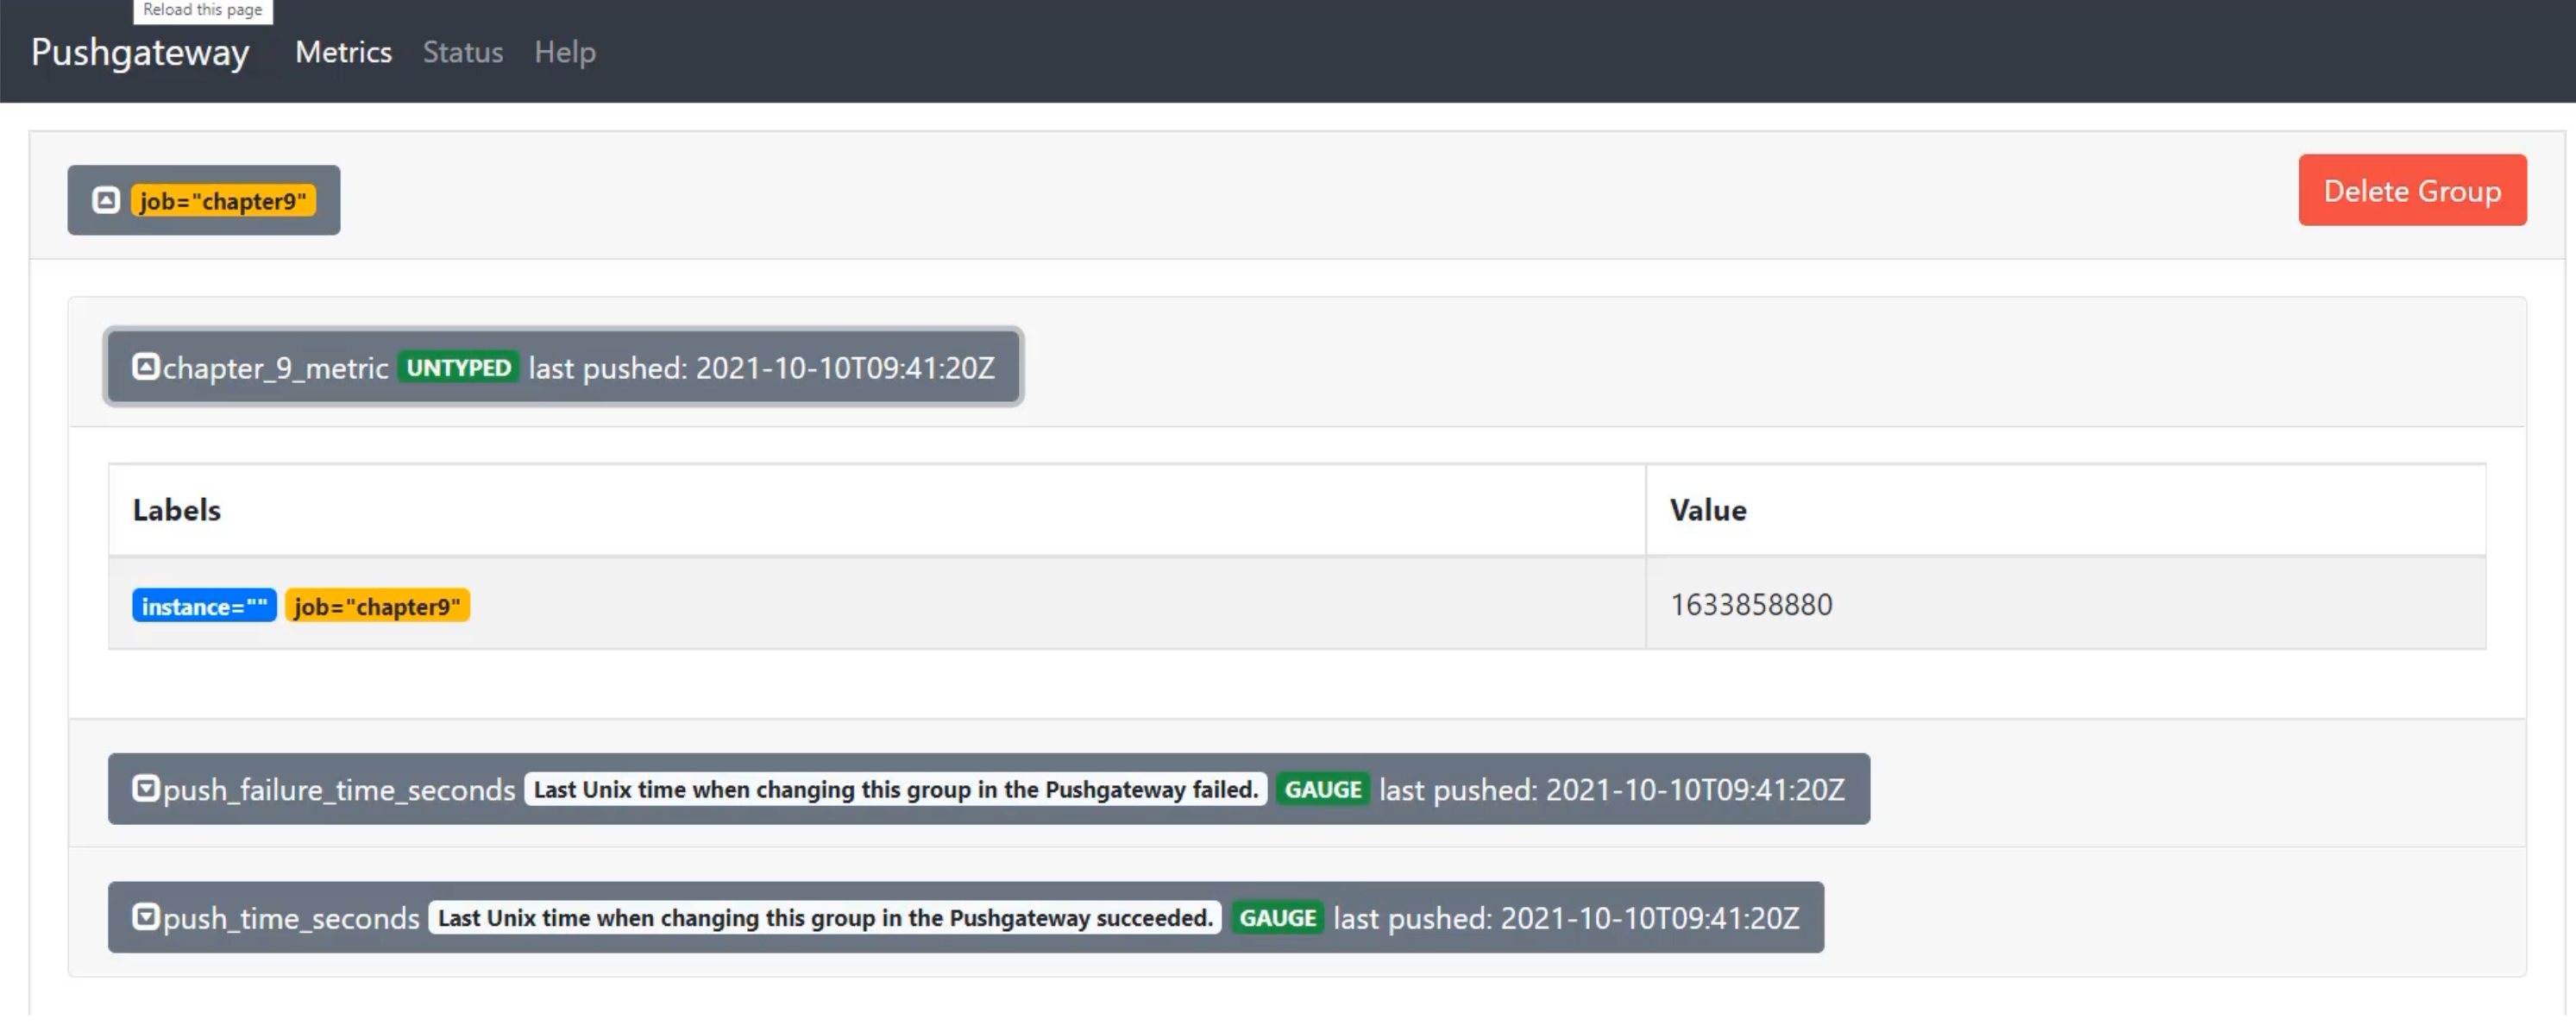
When I open that up, I can see that I have a new metric called "chapter_9_metric", and I can see that the value is "1633858880".
If I want to see that value change, I can do that by sending another metric in.
So I'm back in my terminal and I can do this again and the date will tick on when I press send.
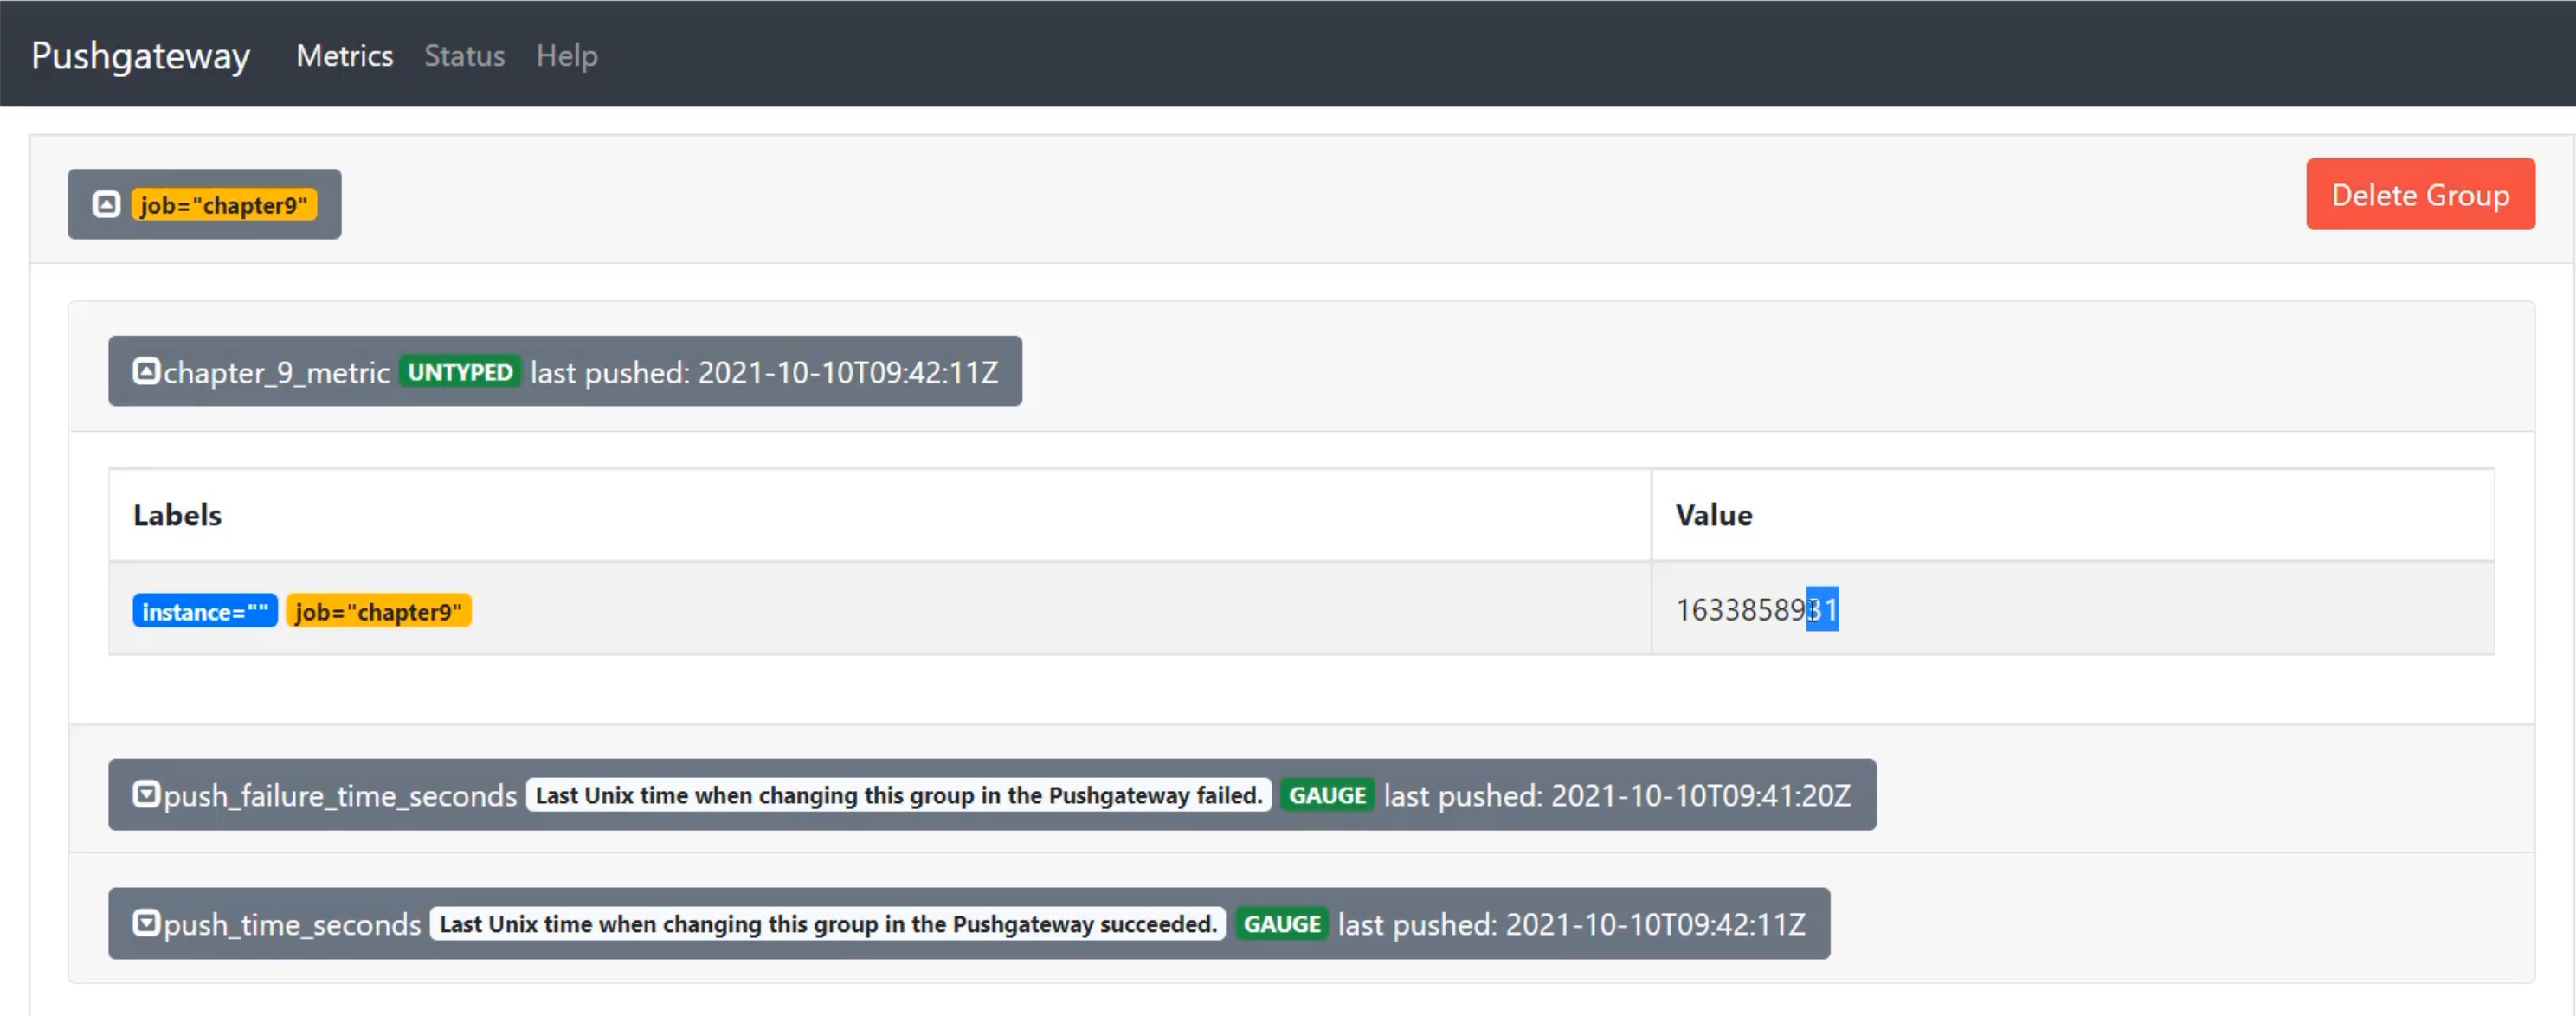
I've now sent that new metric and back in the browser, when I refresh, I'll see that the last push updates as well as this value.
So "last pushed" is now a few minutes later, and when I opened this up, the value now ends in 31, when it used to end in 80.
Next, we're going to need to get this through Prometheus, but we're going to take care of that in a future chapter, because we're going to have to change the configuration of Prometheus to be able to see Prometheus pushgateway.
Come join us in the next chapter to connect these two services together and get these metrics flowing through.
Resources
- Prometheus
- Prometheus docker container
- Pushgateway docker container
- Scaling tests with Docker course by Carlos Kidman
