

Transcripted Summary
In the last video, we introduced our first trace but it is a very long duration on that route trace.
That duration of the entire build is over a minute long, and we don't know everything that's going on on the inside.
So the next way we're going to improve this trace data is to build in some details underneath that.
We're going to introduce subspans.
The other thing that we're going to do during this chapter is add a bit more context.
What this means is we're going to add the details from inside the step to the data that goes to Honeycomb, just like we did with Prometheus.
So just like we calculated the ignored and the passed and the failed tests and we sent that as part of the metrics, we want to send that same data in as a part of the trace.
To do that, we're going to use a mechanism called the BUILDEVENT_FILE.
This is a file that is accessible due to the third-party GitHub Action that we're going to be using.
The way that it works is you can append as much data as you want to it in key-value pairs as a text file.
The key-value pairs are in the format key=value, and they get separated by spaces.
Let's get going with adding this to our codebase now.
In order to add these subspans, we need to tell the pipeline where to add them.
Going into the actions.yaml file again, I'm going to scroll down and find what is the most important job to me, which is the "Run tests with maven" job.
This is the one that's going to give us all of our details and what I want to do, if I were to write pseudocode, is "Introduce start of span", and I want to "Finalize span".
We've already sort of done this before, because we've done this whole setting a start time up at the beginning and then sending metrics at the end.
But let's make this a little bit more about these tests with Maven, and let's build it into the BUILDEVENTS structure.
By introducing BUILDEVENTS via this library, we now have access to the executable.
So, we can introduce a new step here - this step we want to name after what it's doing.
So we'll say "Telemetry start - Maven tests" and just like all other telemetry jobs we want to make sure this always runs, so we'll use the if: always() command.
Then, what we need to do is set the start for this telemetry.
So just like we did for the Prometheus metrics, we need a way to tell it what time this started.
I will do an echo into the environment variables STEP_START, I'm going to use that date command that we've learned - so this is to be able to get the date in number format - and I'm going to be passing that into the GitHub env, so I can get access to it after the step.
The other thing I need here is I need a name for this step because BUILDEVENTS can have many different steps.
I'm going to call this a STEP_ID and here, I can kind of call it anything I want, but I'm going to use run-maven-tests to be a bit specific.
From there, I can also put that into my environment variables.
    steps:
      - name: Set start time
        run: echo "START_TIME=$(date +%s)" >> $GITHUB_ENV
      - uses: kvrhdn/gha-buildevents@v1
        with:
          apikey: ${{ secrets.BUILDEVENTS_APIKEY }}
          dataset: tau-build-pipeline
          job-status: ${{ job.status }}
      - uses: actions/checkout@v2
      - uses: actions/setup-java@v2
        with:
          distribution: 'zulu'
          java-version: 16

	# Introduce start of span
      - name: Telemetry start - Maven tests
        if: always()
        run: |
          echo "STEP_START=$(date +%s)" >> $GITHUB_ENV
          echo "STEP_ID=run-maven-tests" >> $GITHUB_ENV
      - name: Run tests with maven
        working-directory: webdriver_java
        run: mvn test
	# Finalise span
Now my job runs like normal, and I want to finalize this data.
I can actually build this finalization into my final step I already have, where I do the "Collect build data".
For consistency, I want to add telemetry into the name here, so that it's clear what this is doing.
Then what I need to do is tell this job that the step has been completed.
To do that, I'm going to call the buildevents library, and I'm going to specifically call the step part of that library.
I'm going to feed it some of the data that it needs.
The first parameter is $TRACE_ID - this is provided by the library we're using, but we need to feed it to the buildevents step.
Then we need to tell it what step we're closing out, and so this is where we're going to use our $STEP_ID.
Then I need to tell it when that step started, which we have saved as $STEP_START.
Finally, I need to give it a name, which I chose to use $STEP_ID as a friendly name, so I'm just going to pass in $STEP_ID again - that will close out our build event.
    steps:
      - name: Set start time
        run: echo "START_TIME=$(date +%s)" >> $GITHUB_ENV
      - uses: kvrhdn/gha-buildevents@v1
        with:
          apikey: ${{ secrets.BUILDEVENTS_APIKEY }}
          dataset: tau-build-pipeline
          job-status: ${{ job.status }}
      - uses: actions/checkout@v2
      - uses: actions/setup-java@v2
        with:
          distribution: 'zulu'
          java-version: 16

      - name: Telemetry start - Maven tests
        if: always()
        run: |
          echo "STEP_START=$(date +%s)" >> $GITHUB_ENV
          echo "STEP_ID=run-maven-tests" >> $GITHUB_ENV
      - name: Run tests with maven
        working-directory: webdriver_java
        run: mvn test
      - name: Telemetry - Collect build data
        working-directory: webdriver_java
        env:
          PUSHGATEWAY_URL: ${{ secrets.PUSHGATEWAY_URL }}
        if: always()
        run: |
          echo "github_actions_total_duration $(expr $(date +%s) - ${START_TIME})" | curl --data-binary @- ${PUSHGATEWAY_URL}/metrics/job/github_actions
          ./resources/test_result_script.sh
          buildevents step $TRACE_ID $STEP_ID $STEP_START $STEP_ID
We've now introduced the span before the Maven test run, and we've told it when it finishes - we finalized it.
The next thing that we want to do is we want to add some more details into the data that we get in Honeycomb.
As we spoke about at the very beginning of this chapter, in order to add this data in, we need it to be sent in in a key-value format.
In Honeycomb, it's common to make your keys have periods to indicate the difference between the context and the name, so I'm going to make my key gha.maventest.ignored, as an example.
That then is going to need to be equal to the same thing that we've calculated for the Prometheus metric, so I'm going to go steal that calculation and put that here.
That entire line is now going to need to be saved into the BUILDEVENT_FILE, and to do that, I'm going to use the echo command, and I'm going to use the double chevron >>, which is a redirect of that text into a file.
That file I'm going to have stored in an environment variable called $BUILDEVENT_FILE.
echo "gha.maventest.ignored=$(echo ${TEST_RESULTS_STRING} | awk -F'"' '{ print $2 }')" >> $BUILDEVENT_FILE
We spoke about these needing to be spaced delimited, so a quick trick is to add a space to the beginning of the quote so that you know that there's space between your variables and you know they'll be treated individually.
From here, I can replicate this for each of the other pieces of data
In order for this to work, the last piece I need to do is I need to make sure that this file knows where the build event file is.
I'm going to need to do a few things to make that work.
The first thing I need to do is I need to set the original build file location.
The way I can do that is by introducing a new environment variable at the top of actions.yaml.
This is an option given to us by the buildevents library that we're using from our third party.
To do this, I set the environment variable BUILDEVENT_FILE, and I set it to a location based on the root of our directory.
So, I'm just going to put it right there in the root and call it './buildevents.txt.
Just to make sure that I remember where this is, I'm going to comment "# This is root of our repository".
    env:
      RUNNER_OS: true
      HEADLESS_CHROME: true
      BUILDEVENT_FILE: './buildevents.txt' # This is root of our repository
From there, I now need to send this BUILDEVENT_FILE into the context of that script.
Way back down at the bottom, I can see here that I'm working in the webdriver_java location.
If I go look at my repository setup, I can see that the selenium-webdriver-java-course is the root of my repository, and webdriver_java is actually one level below.
So, for me to be able to write to this file, I need to know that it's located one level above where I am.
I'm going to now reset this BUILDEVENT_FILE variable for the context of this job, by using the ${{ env.BUILDEVENT_FILE }} variable that I've set up above.
But, I don't want to just reassign it, I need to also tell it about that different directory location.
So to do that, I need to put a ../ ahead of it, which tells me to go up one directory and then to the name of that file.
      - name: Telemetry - Collect build data
        working-directory: webdriver_java
        env:
          PUSHGATEWAY_URL: ${{ secrets.PUSHGATEWAY_URL }}
          BUILDEVENT_FILE: ../${{ env.BUILDEVENT_FILE }}
        if: always()
        run: |
          echo "github_actions_total_duration $(expr $(date +%s) - ${START_TIME})" | curl --data-binary @- ${PUSHGATEWAY_URL}/metrics/job/github_actions
          ./resources/test_result_script.sh
          buildevents step $TRACE_ID $STEP_ID $STEP_START $STEP_ID
With that, the script will be able to find where to write to, and we'll be able to get this added context.
It's time to make my commit and go back and check GitHub.
I'm back in GitHub, and I see that my most recent commit has completed running.
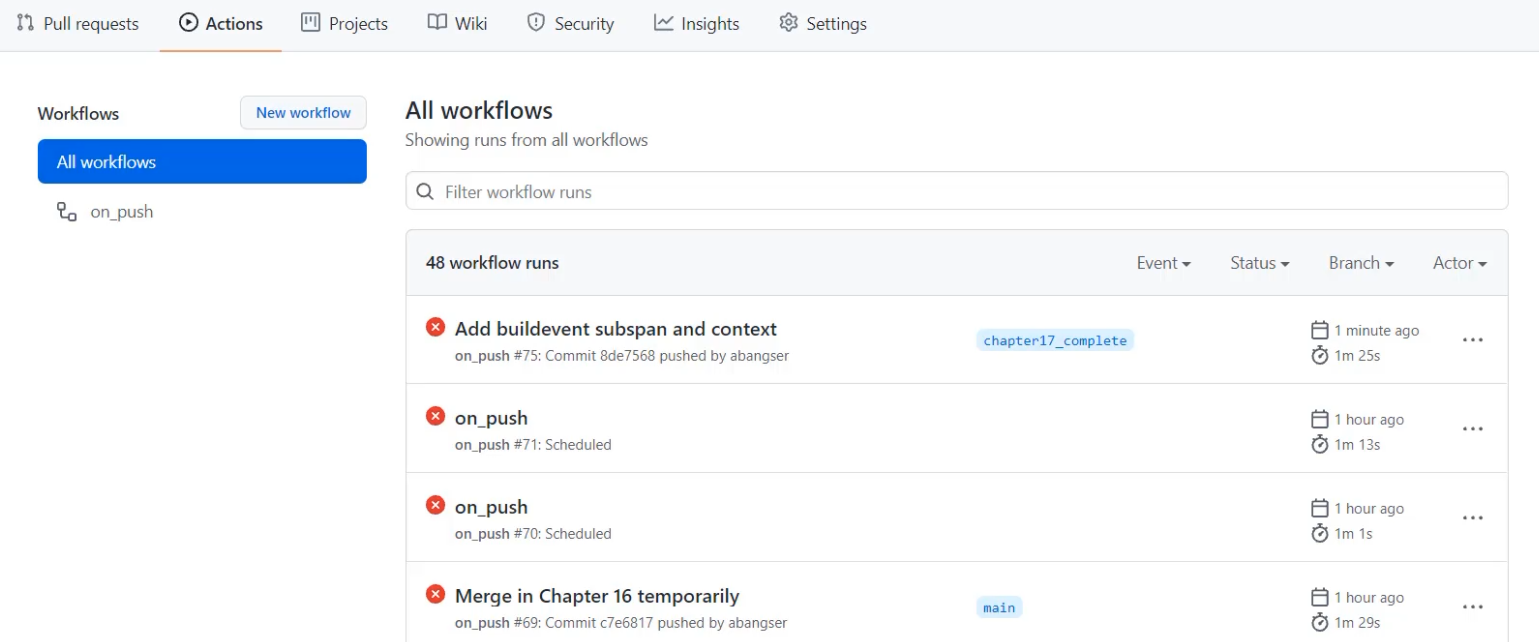
I can go check for that in Honeycomb to see the added span and added context.
What I'm going to do here is run a query, and I can see that I've just recently sent in a new trace from "chapter17_complete".
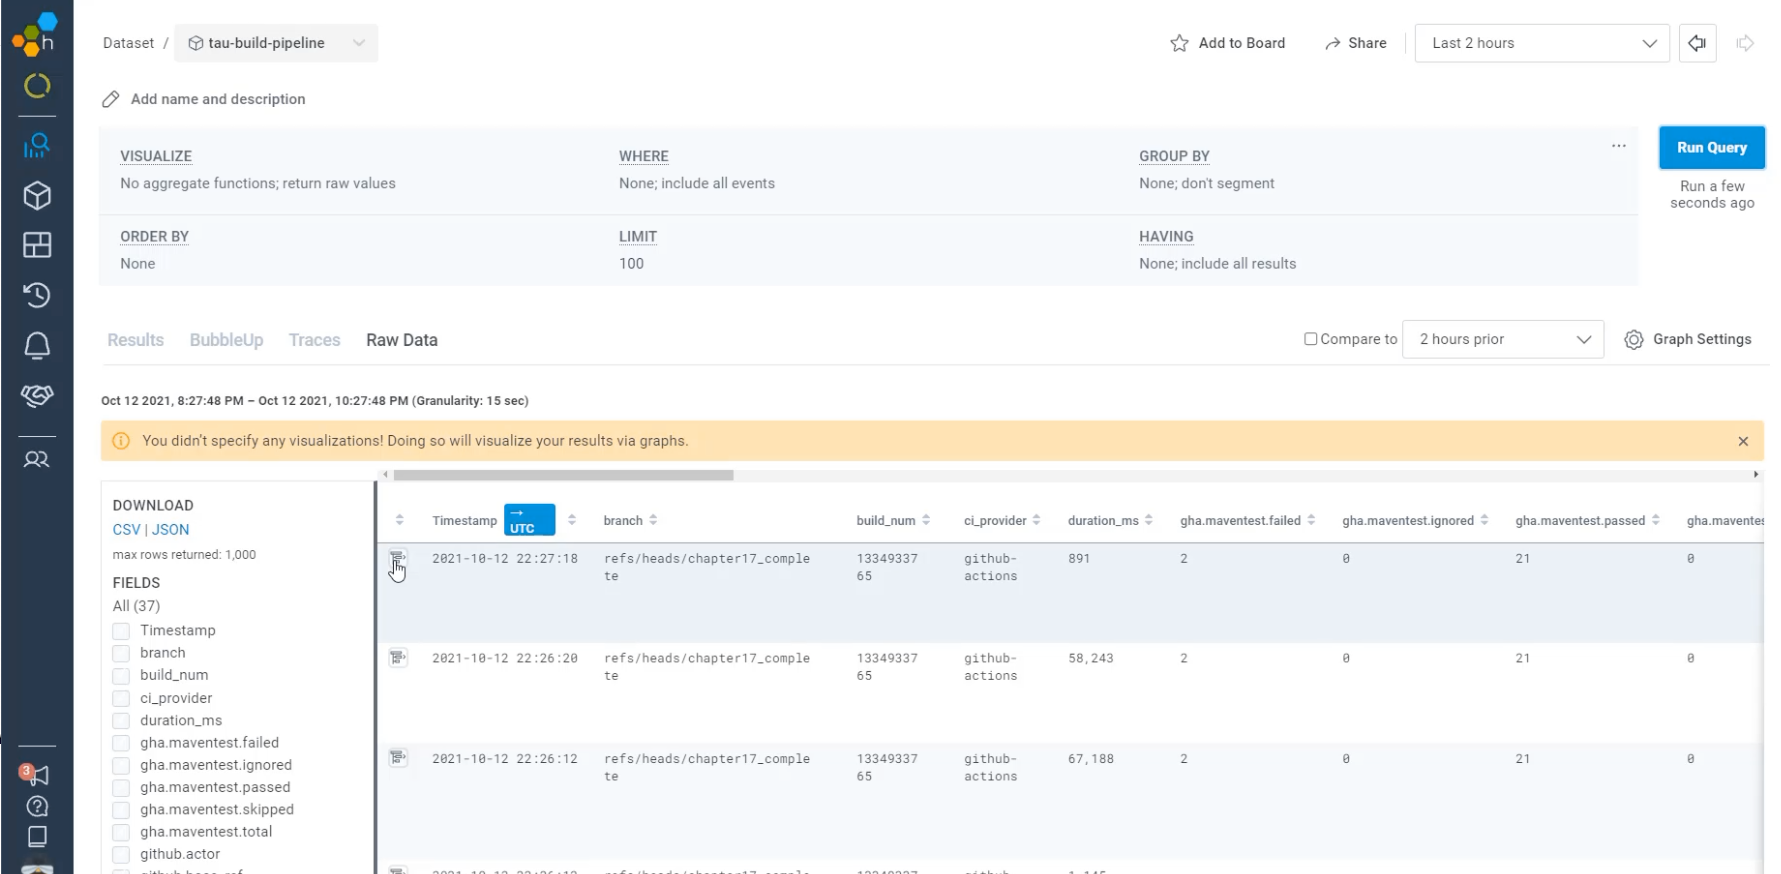
I'm going to open up that trace and I can see that I have an extra row here.
This row here is called "run-maven-tests", and it tells me that those tests took 58 of the 67 seconds.
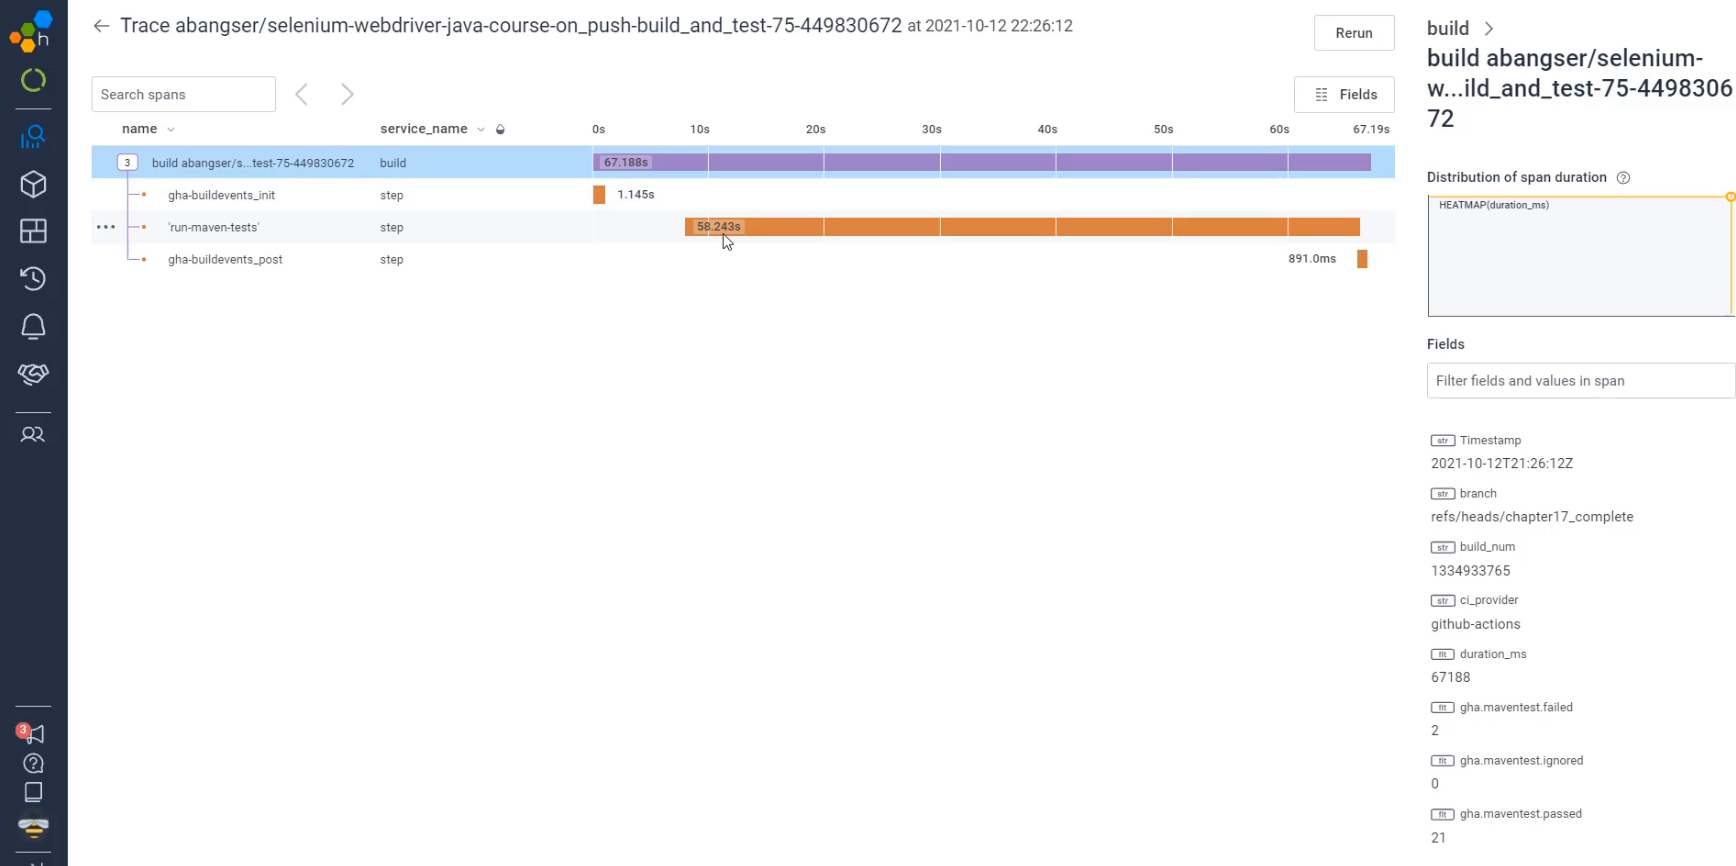
When I go look at that test, I can also see that I have additional fields here, just like the ones I've sent in - so gha.maventest.failed - 2 and gha.maventest.ignored - 0 and so on.
Now I have all of the context from my metrics here in this trace.
I also have this view, and a few more interesting things I can do with it.
Come back for our last chapter next to have a look at how we're going to explore this data and be able to create visualizations like we did with Prometheus, but also digging in and being able to triage the data with it.
