

Transcripted Summary
Previously, we've seen what the running version of Prometheus Software looks like, but it was a bit finicky to get set up, and it wasn't fully configured yet.
This chapter is going to be about making this easier to use, and getting it fully configured.
So, what do we need?
We, as our computer users, need to be able to access the Prometheus Server, and we're going to do that by running a Docker container, which we've already done successfully.
We also need to be able to access the Pushgateway, which is also going to be in a Docker container and has been proven to work.
What we need to add is the ability for the Prometheus Server to have a configuration file that allows it to speak to the Pushgateway.
In order to have all of these things working, in the easiest way possible, we're going to introduce Docker Compose.
Docker Compose allows us to move away from the Docker Desktop UI, where we need to configure things one by one, and allow us to instead have a single configuration file to hold all of the necessary bits.
Let's get started with a Docker Compose file by going to our codebase.
Here I am in my codebase, and what we're going to do is actually introduce a brand new file.
For that file, I'm going to add it just at the root of the directory - so under selenium-webdriver-java-course, I'm going to right-click and select "New" > "File", and this needs to be named docker-compose.yaml.
With this new file, we can close that tab and we can get started by pseudo-coding the things that we need to introduce.
For example, I know that I need to have a "prometheus server".
I also know that I need to be able to "access that on port 9090", and finally, I need it to have a "configuration file to scrape Prometheus Pushgateway".
In addition to the Prometheus server, I need that "Pushgateway server" as well, and I need to be able to "access that on port 9091".
# prometheus server
# access port 9090
# configuration file to scrape prometheus pushgateway

# pushgateway server
# access port 9091
I can now start to actually write the docker-compose file for this.
This is going to be in the YAML format, just like our GitHub Actions.
We're going to see some similarities, but this is configuring a different piece of software, so you'll also see a lot of differences.
To start with, with docker-compose, we need to tell it what version we're using, so I'm going to use version 3.
This is the most up to date version at the time of this video.
From here, I need to start this list of servers I want.
To do that, I say services, and underneath, I now am indented by two spaces and I can make my list of services.
The first service I want to create is the prometheus service.
Now, I re-indent to be able to configure underneath the Prometheus service.
Within here, I need to tell it what Docker image it's going to be using for running Prometheus.
That is just like we downloaded the prom/prometheus image.
I also need to be able to access this on port 9090.
To do that I need to expose the port 9090 - this is what's going to tell the container that 9090 should be accessible from outside of the container.
Then, I need to map these ports from inside the container at 9090 to outside the container at 9090.
This is what's going to allow my computer to speak to the container on port 9090, and allow me to view the website.
I'm going to remove these two comments, as we've completed those two tasks, but I'm going to leave the configuration file for a moment later, after we've completed adding the Pushgateway service.
version: '3'

services:
  prometheus:
    image: prom/prometheus
    expose:
      - 9090
    ports:
      - 9090:9090
# configuration file to scrape prometheus pushgateway

# pushgateway server
# access port 9091
Under here, I'm going to indent by two spaces and create a pushgateway service.
I'm going to follow the same pattern as above, so I need to tell it what image to use, and this time it's going to be prom/pushgateway, just like we downloaded previously.
I'm also going to need to expose this port, but we know that the Pushgateway is on 9091, and once again, I need to be able to reach this from my computer so I need to map these ports - so 9091:9091.
I can remove these comments as I've completed that task now.
version: '3'

services:
  prometheus:
    image: prom/prometheus
    expose:
      - 9090
    ports:
      - 9090:9090
# configuration file to scrape prometheus pushgateway

  pushgateway:
    image: prom/pushgateway
    expose:
      - 9091
    ports:
- 9091:9091 \
At this point, I should be able to run this file and end up in the same position I was in previously.
The one thing we need to make sure is that we've cleaned up after ourselves from previously running the Prometheus Docker images, because ports have to be unique.
If we were running this elsewhere, we wouldn't be able to start running it on 9090, 9091.
So, I'm going to go back to Docker Desktop and check if I've cleaned up after myself, and I haven't.
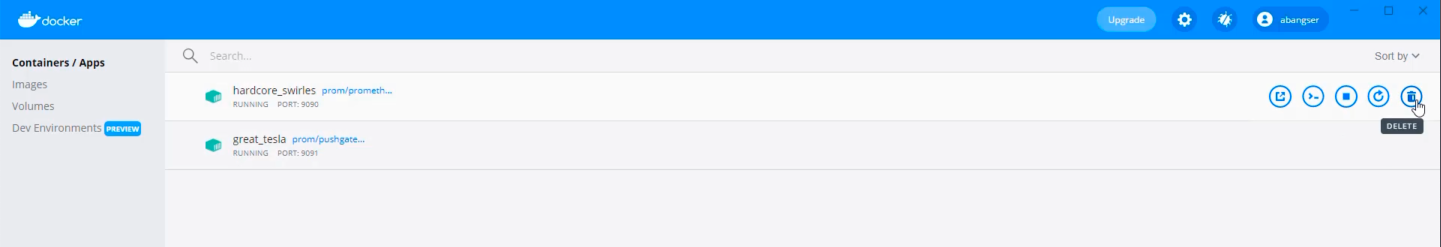
That's fine, all I need to do is click "Delete", and delete the other one.
It's good practice to clean this up, if you can, as you go, because these are like running mini computers on your computer and they can take energy from the laptop.
Returning back to my codebase in IntelliJ, I actually get given the opportunity to run this directly from IntelliJ.
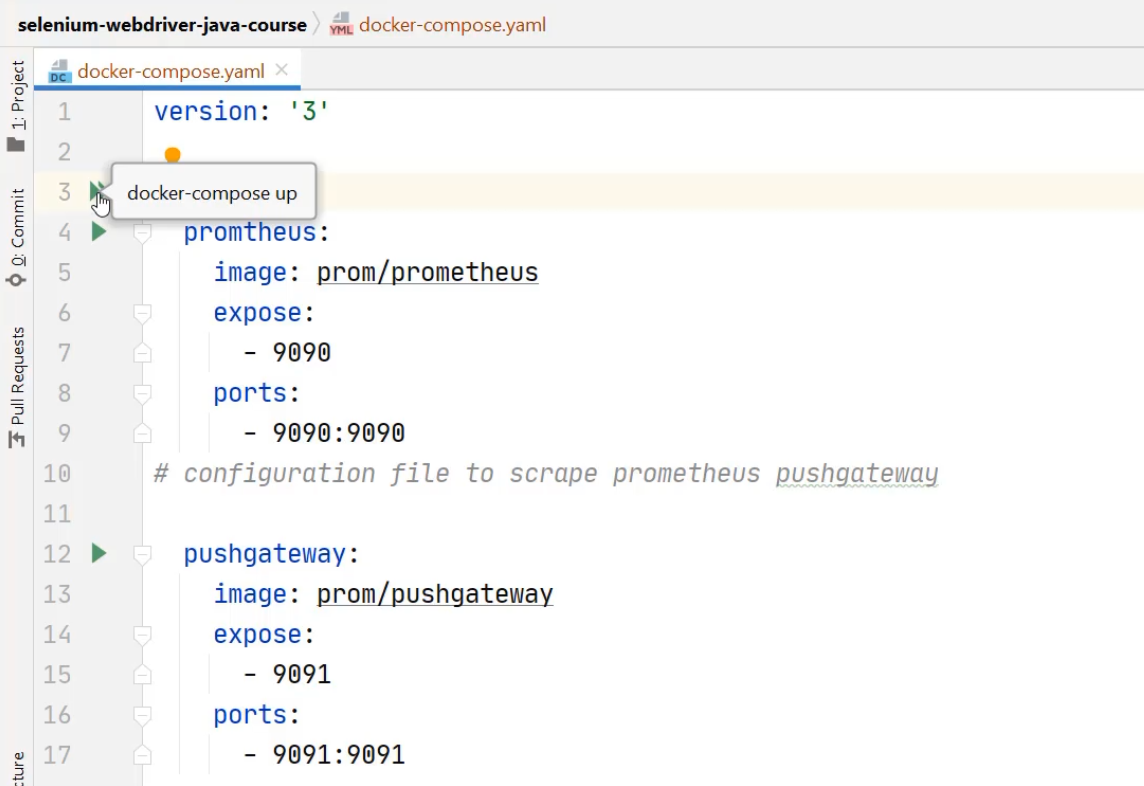
I can run a single container using these single green play buttons, or I can run all the services together using the command docker-compose up, but letting IntelliJ run it.
So I'm going to click "Play".
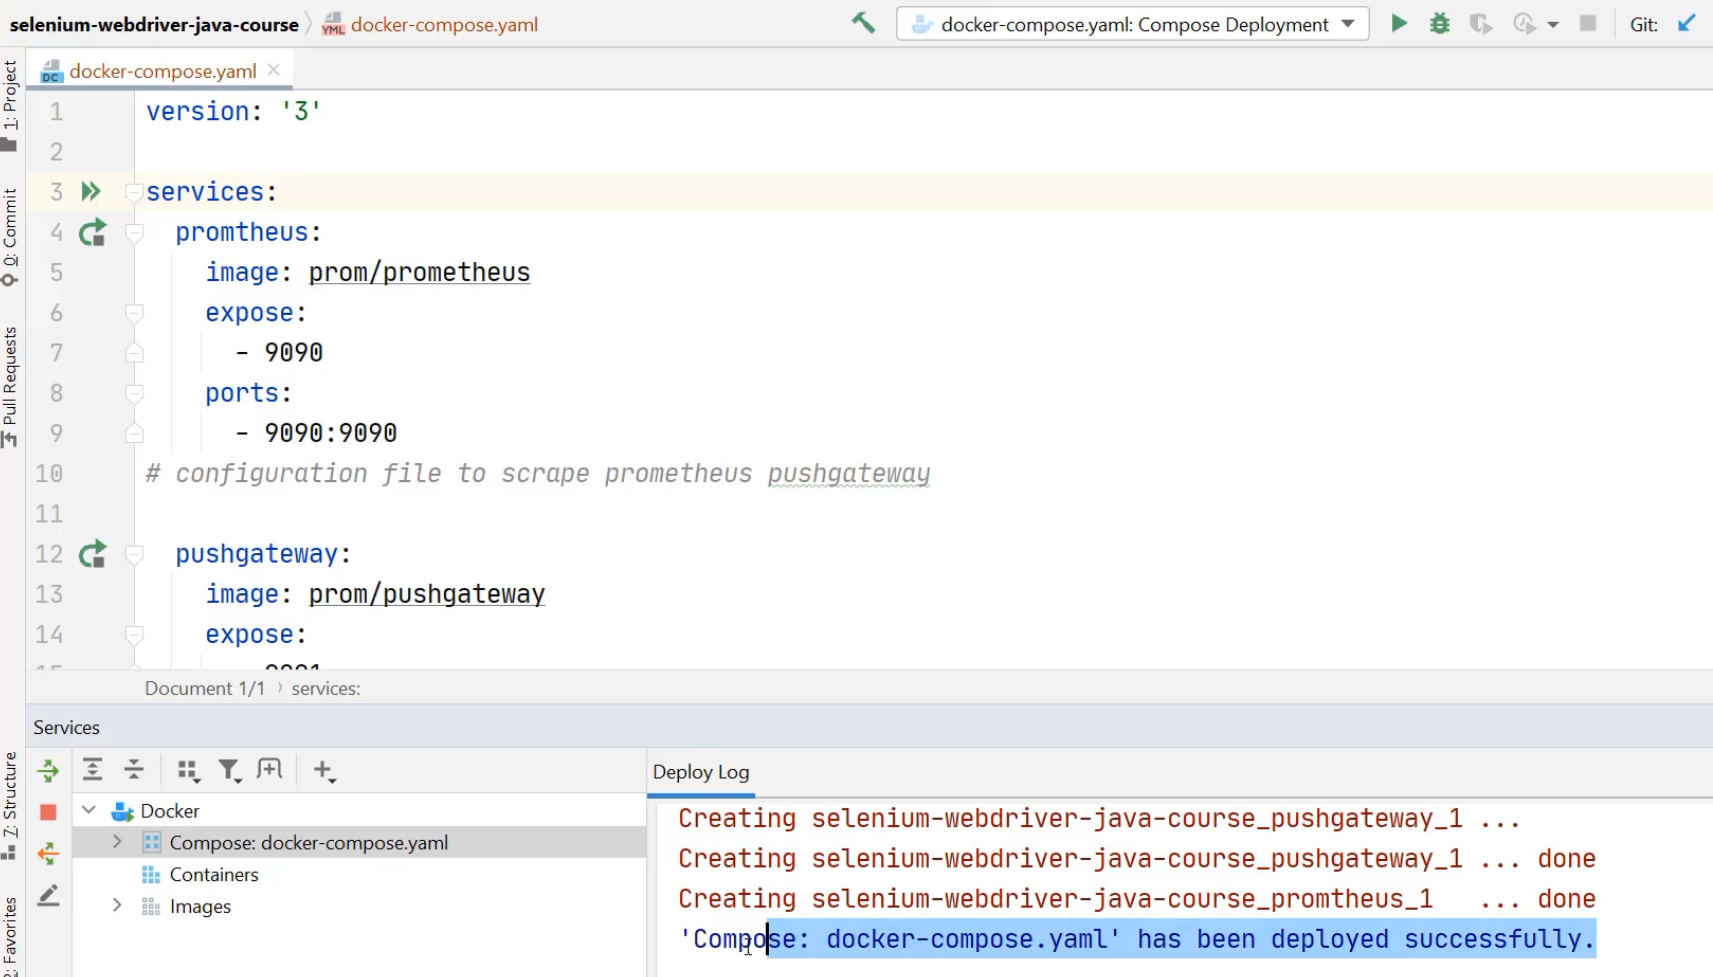
It's going to open up this bottom window where it's going to talk about opening the containers, and it says that it's been deployed successfully.
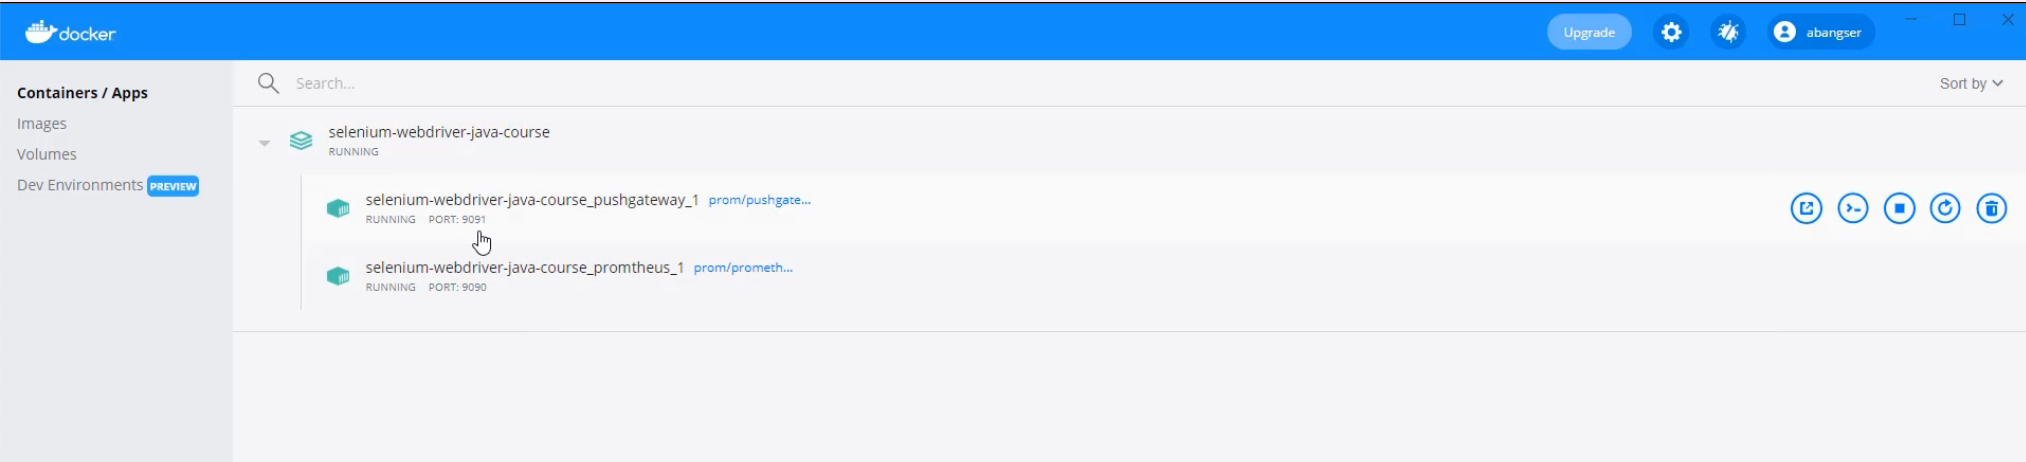
I can even see that in Docker Desktop.
I can now see that the selenium-webdriver-java-course is running two different containers, and this container is on port 9091, which is a Pushgateway, and 9090 for the server.
I can also still open this directly from here in the browser.
So, here I am at the Pushgateway browser, and if I open up the server, here I am with the server.
See how much easier it is when we have a single configuration file?
We can do that with a single push of a button, rather than needing to manually click and open things, but we're not done yet.
We still need to configure the Prometheus server to know where the Pushgateway is.
Back in my codebase, the last thing I need to do is solve this configuration file for how to scrape Prometheus Pushgateway.
To do that, I'm going to introduce a new file inside of a new directory.
I'm going to create a directory and I'm going to call that prometheus and inside of this prometheus directory, I'm going to introduce a new file called prometheus.yml.
The reason this is yml, is that this is a shortened version of the ending yaml that we've been using previously.
You can think of this a little bit like "jpeg" - you can have j-p-e-g or you can have j-p-g, but they actually are the same type of file.
We're going to be particular here and use the yml because the Prometheus server is configured to look for this specific file name, and we don't want to do any more complex configurations for it to look for a different file name, even if it's just to use a different ending.
With this file created, we now can create any custom configuration we want, but it makes sense to start with the default.
I'm going to return to my running Prometheus server, and I'm going to go check out the configuration.
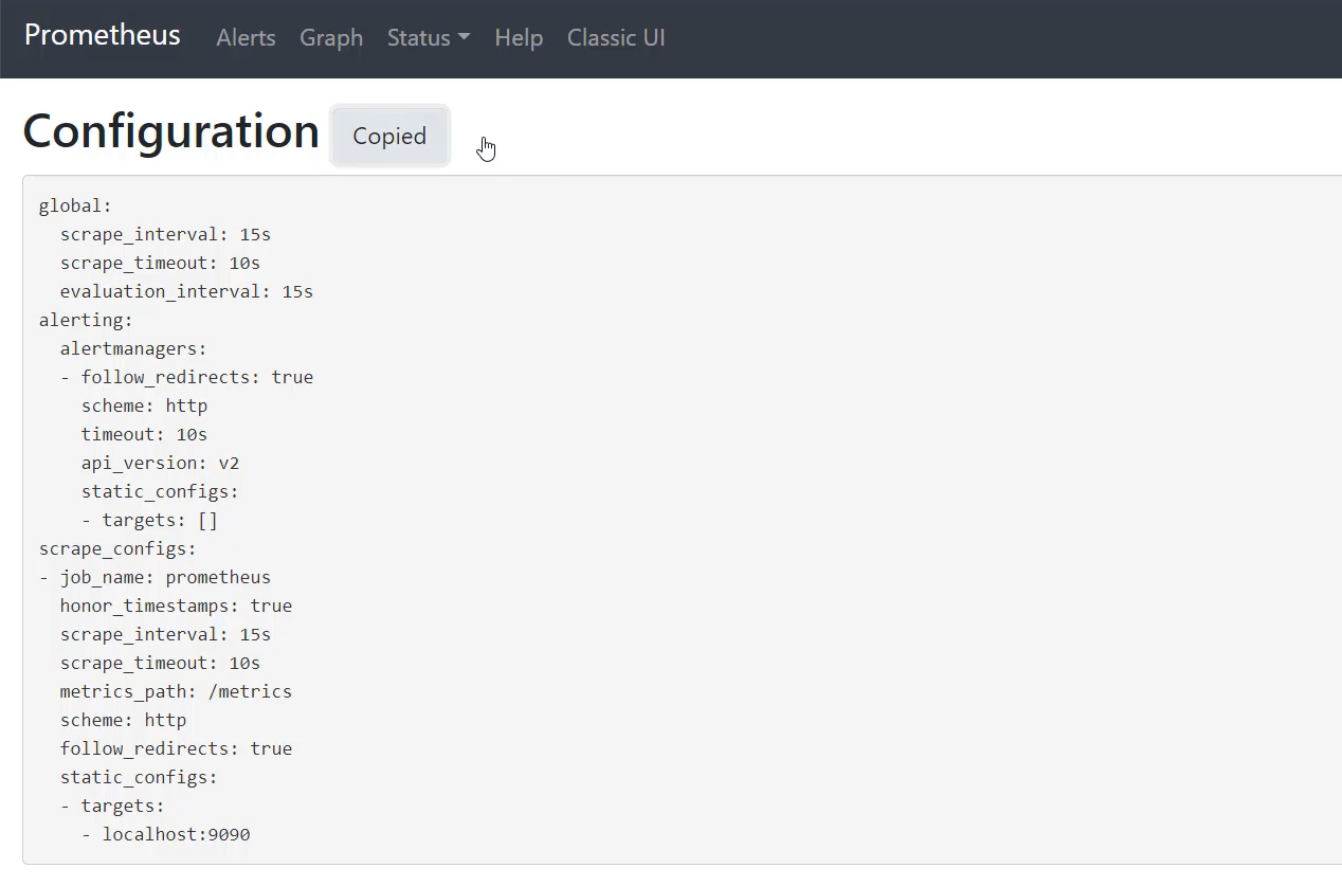
Here, I'm able to copy this to my clipboard, and that will be my starting point.
With that configuration pasted in, I can see it's a fairly trivial thing to add a new scrape target.
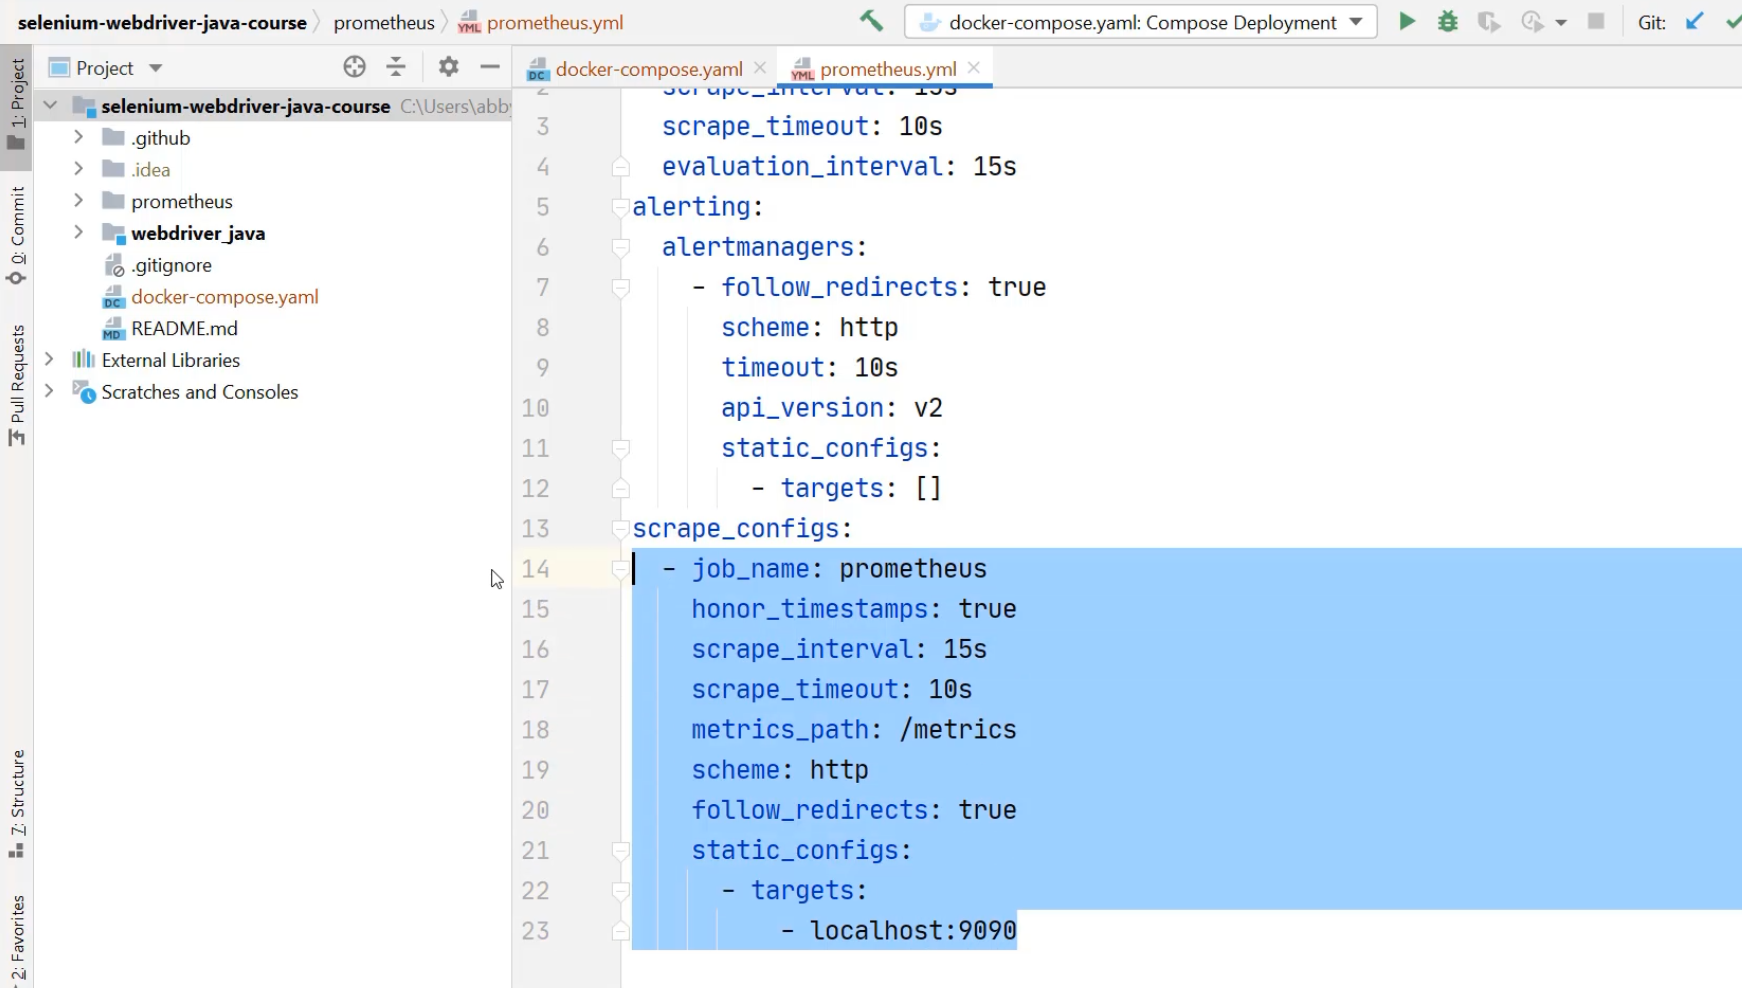
I can just copy this entire job and I can paste it down below.
With that, I now have two jobs by the same name, scraping the same target, and that's not exactly what we want to do.
Instead, what we want is this to be named after the type of metric it's pulling - so the pushgateway metrics.
We also need to change how it finds that service.
The way that we do that is we use a docker-compose aspect, which is the name of the service and its port.
So, it's not going to be localhost, because it's not on the same container as prometheus, but it's going to be pushgateway, which is the name of the service, and 9091, which is the port.
We now have a configuration file for prometheus, which contains a scrape configuration for itself and a scrape configuration for the pushgateway running next to it.
When I go back to the docker-compose, I need to tell the Prometheus service about this new configuration file.
I do that by introducing a volumes list.
Volumes are ways for us to map files on our local computers into the Docker containers, and more specifically, we need to map the directory, which is prometheus.
I'm going to map this to the directory on the container called /etc/prometheus.
This is where the Prometheus service is by default looking for its configuration file.
version: '3'

services:
  prometheus:
    image: prom/prometheus
    expose:
      - 9090
    ports:
      - 9090:9090
    volumes:
      - ./prometheus:/etc/prometheus

  pushgateway:
    image: prom/pushgateway
    expose:
      - 9091
    ports:
      - 9091:9091
I'm going to remove this comment now that I have completed that task, and I can rerun this docker-compose.
docker-compose is actually quite smart - it's able to tell that the Prometheus Pushgateway is up-to-date and doesn't require any changes, but it does need to recreate the selenium-webdriver-java-course_prometheus, which is the Prometheus server.
It's now done recreating that so I can return to the browser and check it out.
Here I am in the browser, and when I refresh this, I can see the longer configuration file.
I can see that it is now configured to push to the pushgateway and check the metrics endpoint at pushgateway:9091.
What really matters is that it can do that.
I can check on the status of this by going to "Status" > "Targets" and seeing that I now have a second endpoint.
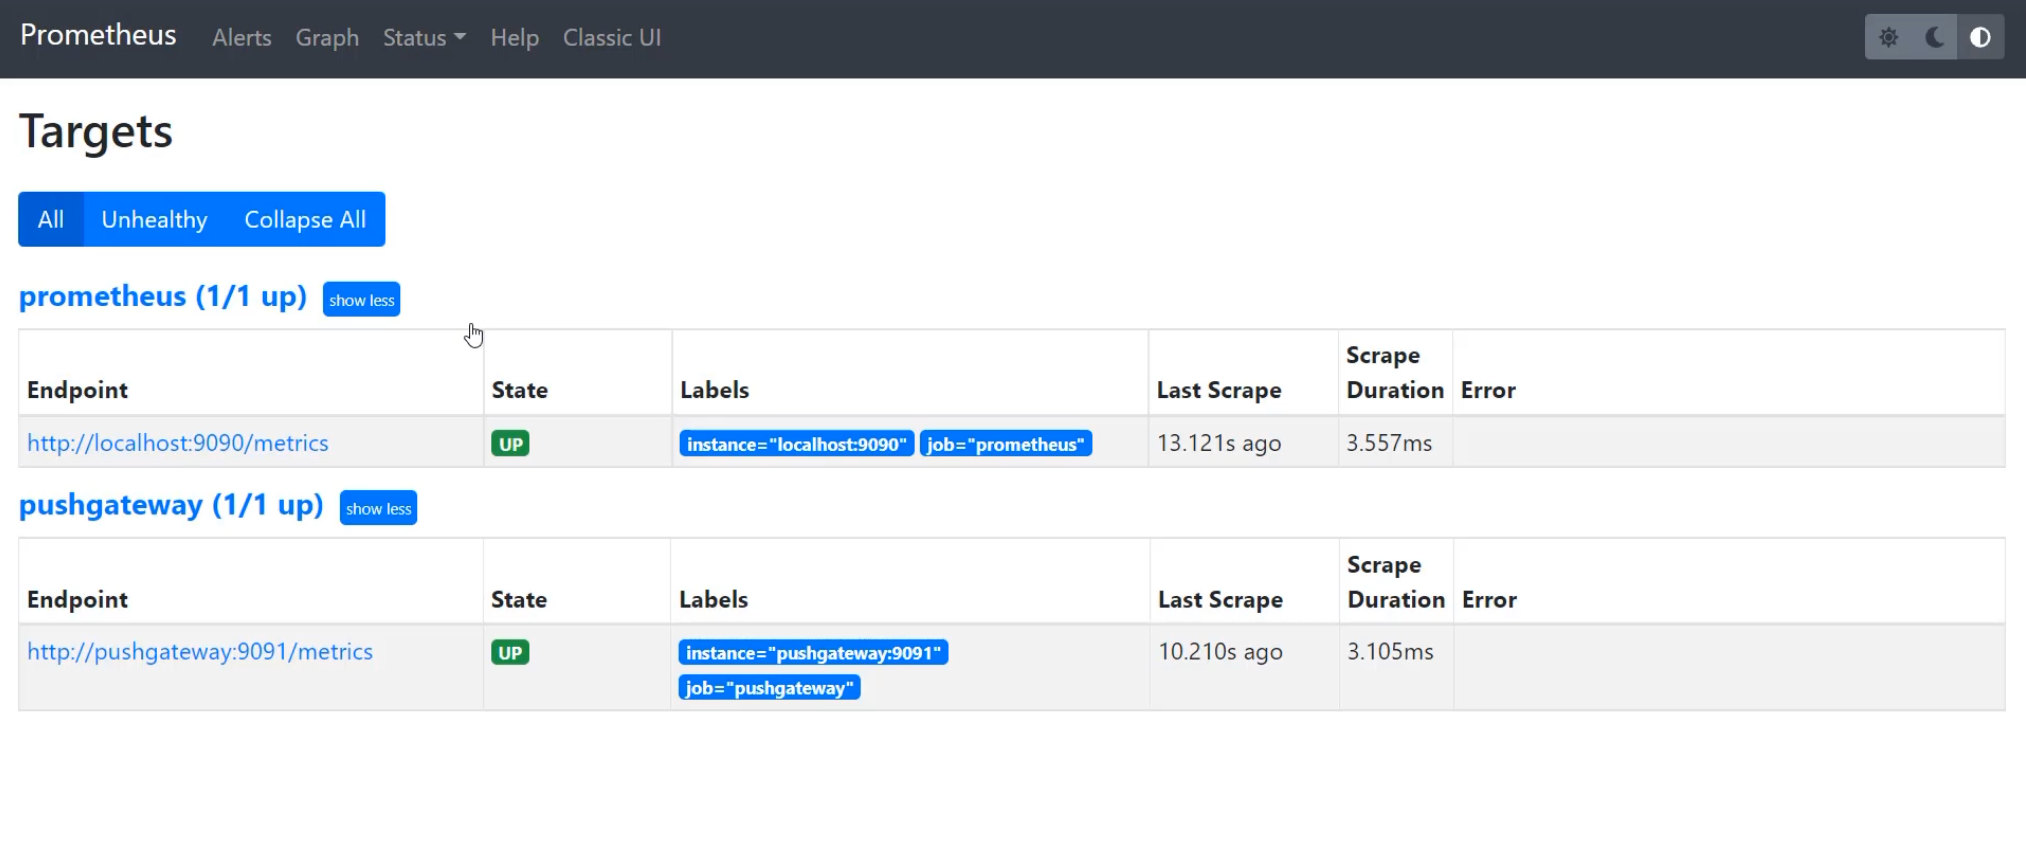
I have a localhost:9090 that is able to scrape metrics, and I also have a pushgateway that is able to scrape metrics.
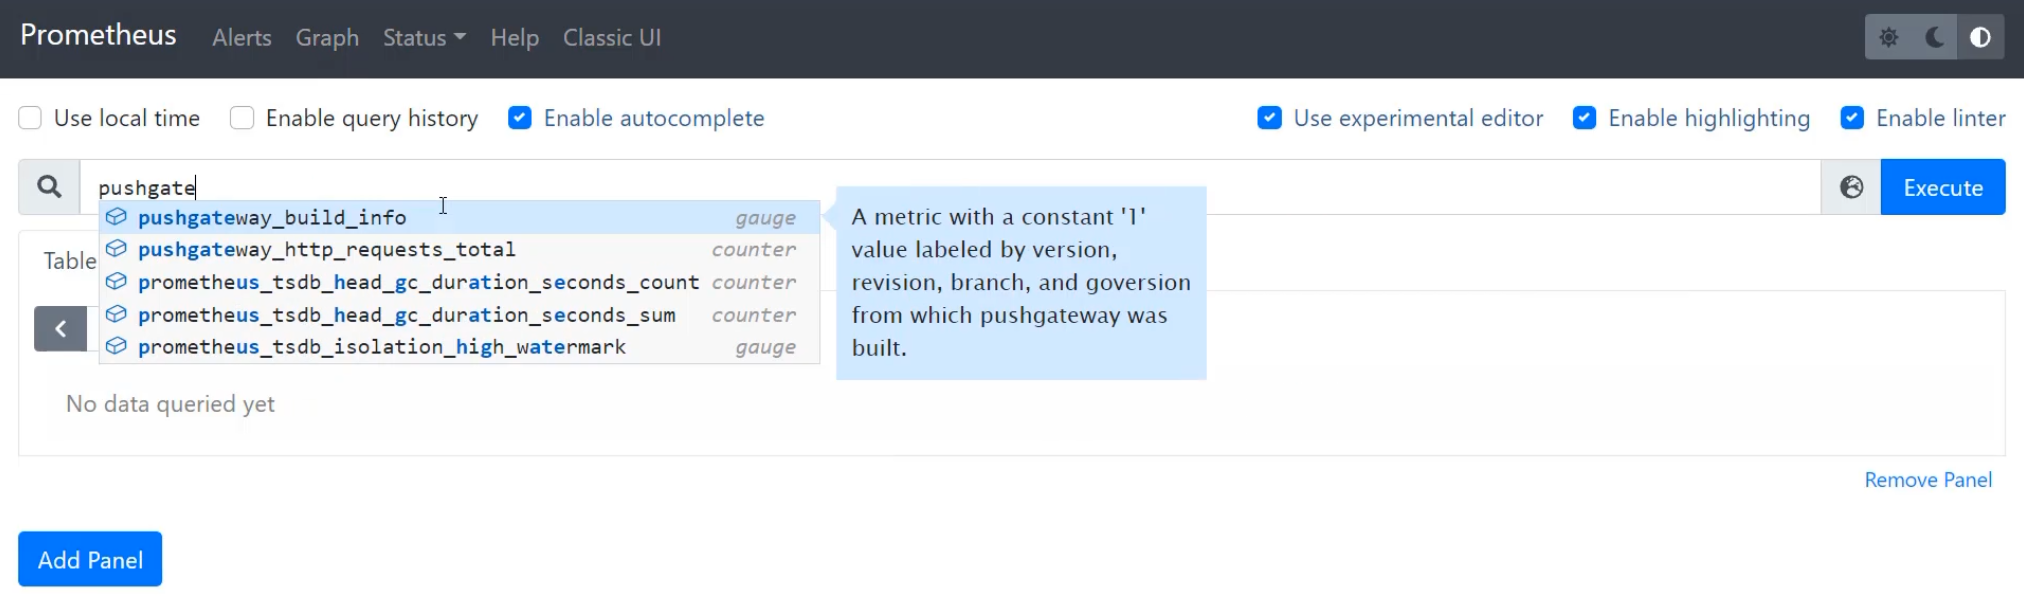
I can also confirm this by looking and seeing that I'm getting pushgateway specific metrics, which I wasn't previously.
One thing you'll notice is that the metrics that we created in the last chapter won't exist anymore.
If I look for chapter-9, it doesn't exist.
That's because we have recreated these Docker containers, and so all of the storage has disappeared.
These are what we call ephemeral, meaning that they don't retain storage over time.
In order to fully test that we can get this metric in Pushgateway into Prometheus and map it, I'm going to need to push a new metric.
Right now this metrics page is empty, but I'm going to go to the Terminal and send a new curl request.
To do that, I need a string, which is the metric name - I'm going to call that chapter_10.
I also need a metric value - this time instead of using date, I'm just going to use a manually entered number 123.
Then I need to send that into a curl request as the data and that curl request needs to hit our localhost:9091 metrics endpoint, and I need to send it in what job this is - so I'm going to call this job/chapter10.
echo "chapter_10 123" | curl --data-binary @- http://localhost:9091/metrics/job/chapter10
With that, I've sent the curl request to the server and I can return and see it in the browser.
I'm now going to refresh the Pushgateway and see that job "chapter10" has appeared.
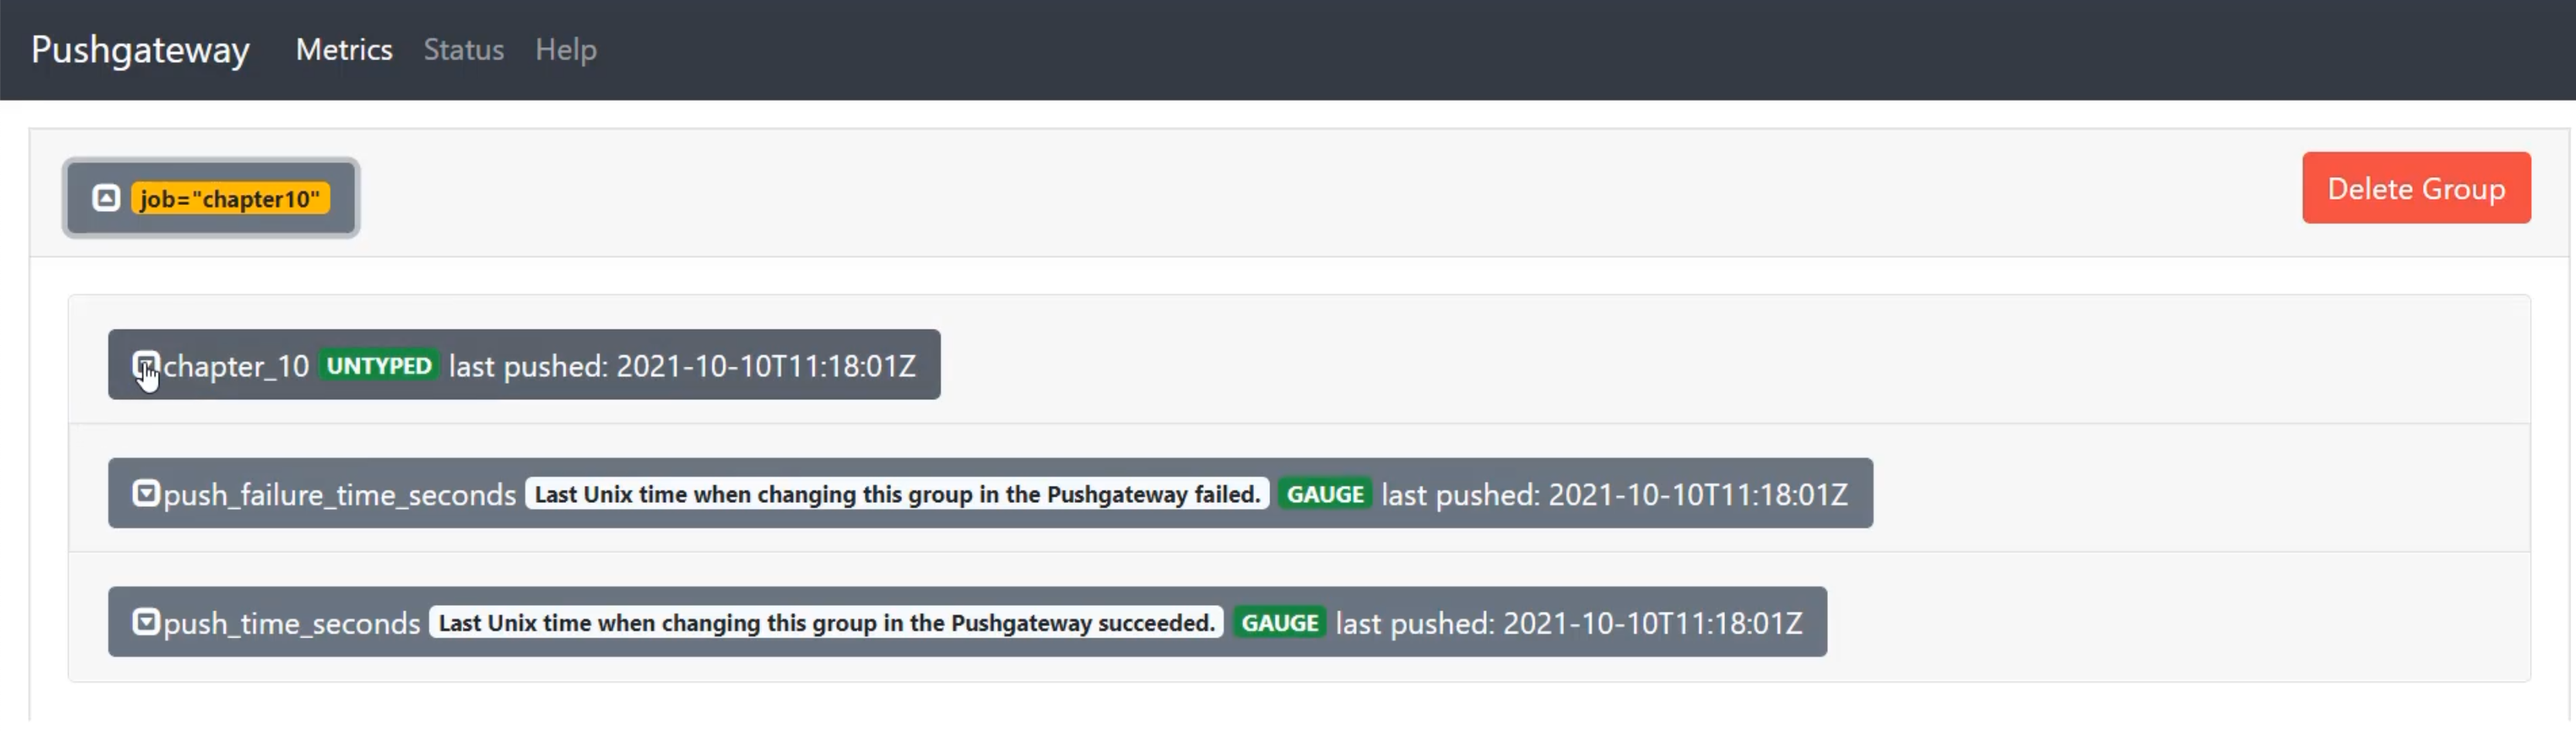
Inside of there, I can see that the "chapter10" metric exists with a value of "123".
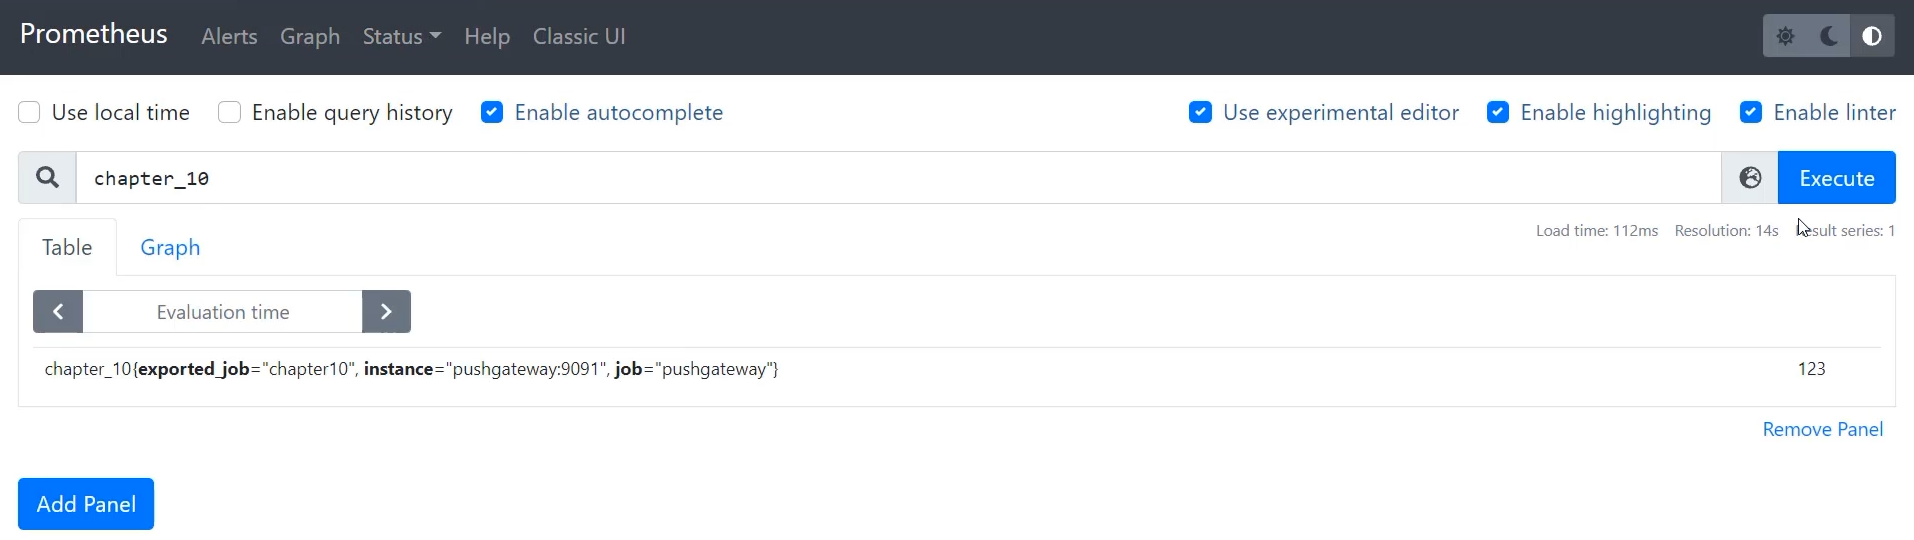
In addition, when I go into Prometheus, I can look up "chapter_10", and I can see that that has a value of "123".
Now is when we can actually explore and understand this scrape config.
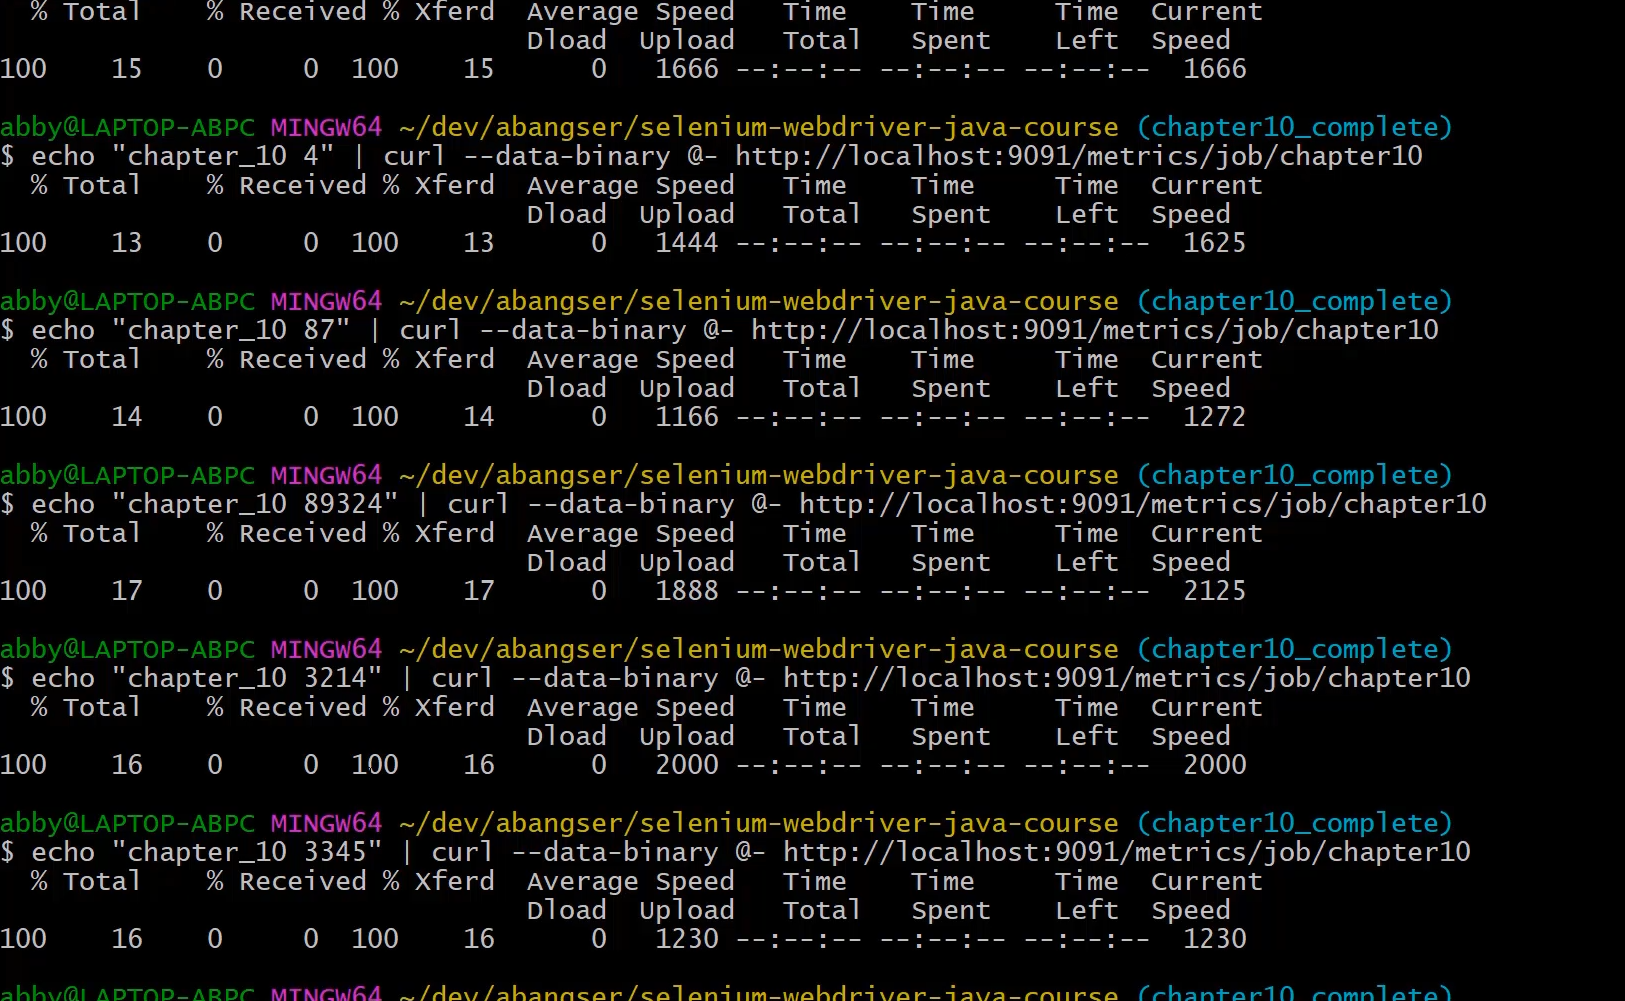
What I can do is I can send a number of curl requests in quick succession, and see what metrics show up.
I'm going to arrow up to return back to my old request.
I'm going to change this to "324",. I'm going to change it to just the number "4",. I'm going to change it to "87"... I'm just changing these to random numbers as fast as I can.
What do you expect to have happen in the user interface?
Do you expect to see all of these values?
Let's go find out.
If I return back to the Pushgateway and I refresh the page, I can still only see a single value - the most recent one that I've given.
This is because this is a point in time collection - it will only ever hold the most recent value of that metric.
Prometheus then scrapes this every 15 seconds.
So, if I run this command again, I again see the most recent, but let's go to the graph and see if I can see it over time.
Notice it's picked up a few of my changes.
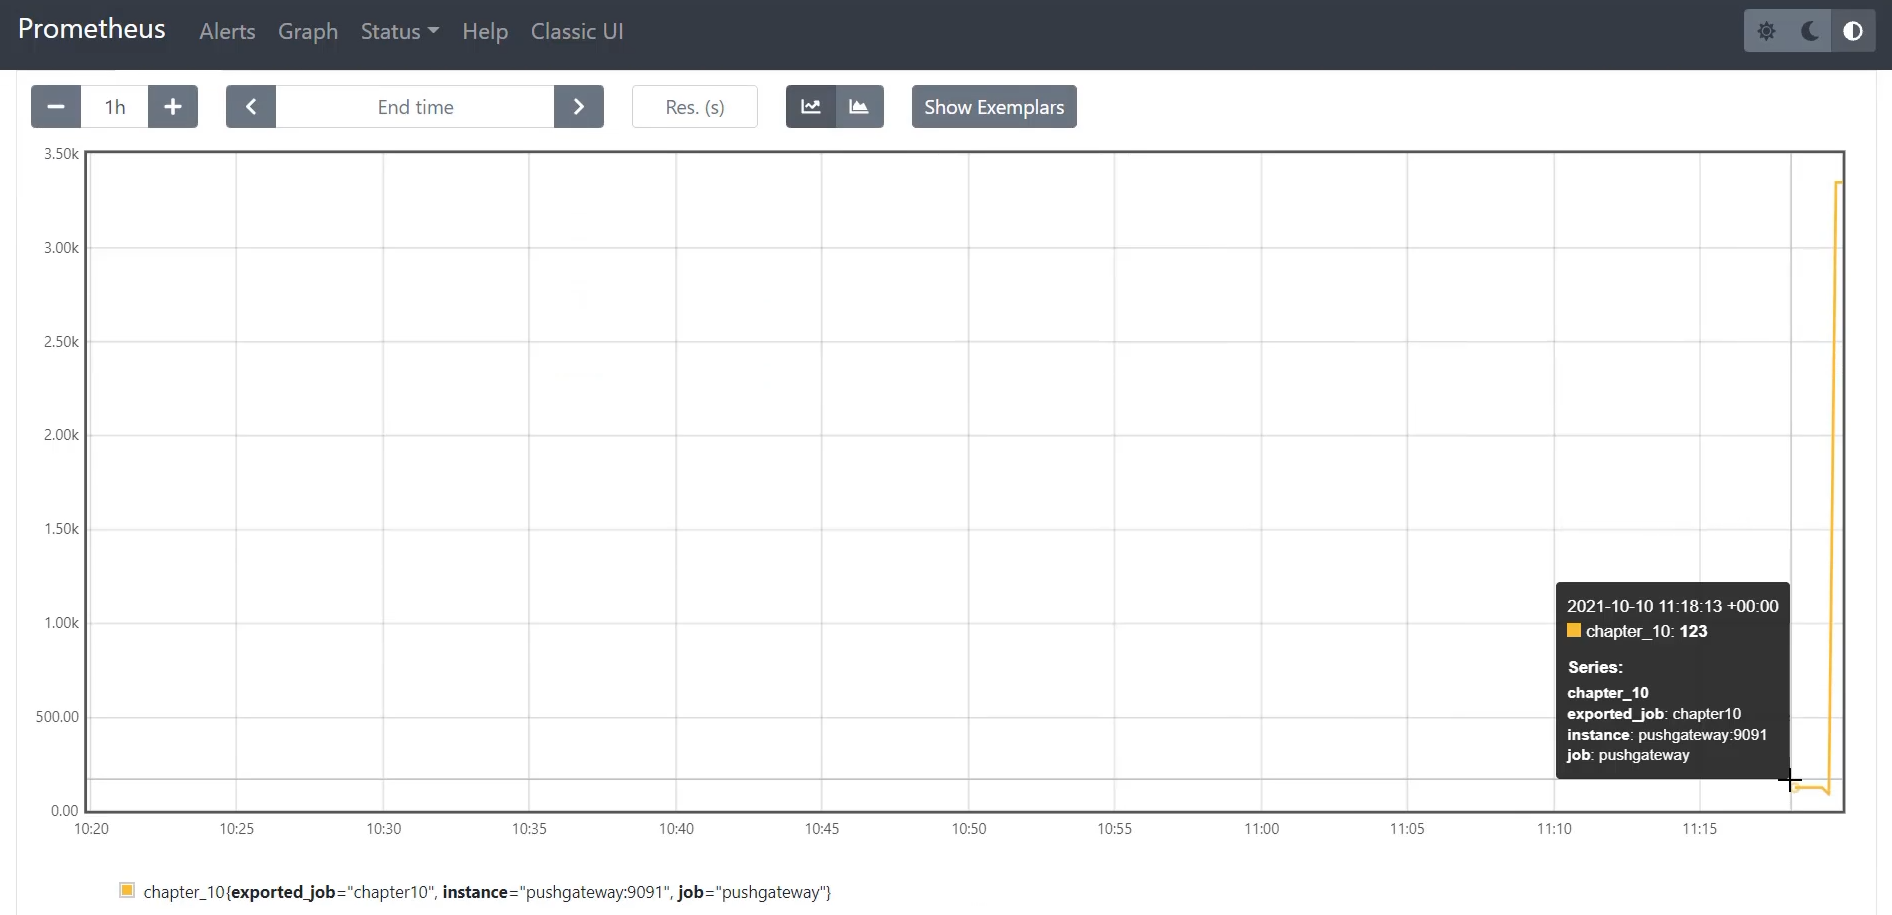
Let's zoom in here, to be able to see this a little bit clearer.
It started as 123, and then it dropped to 87, but then it rose to 3345.
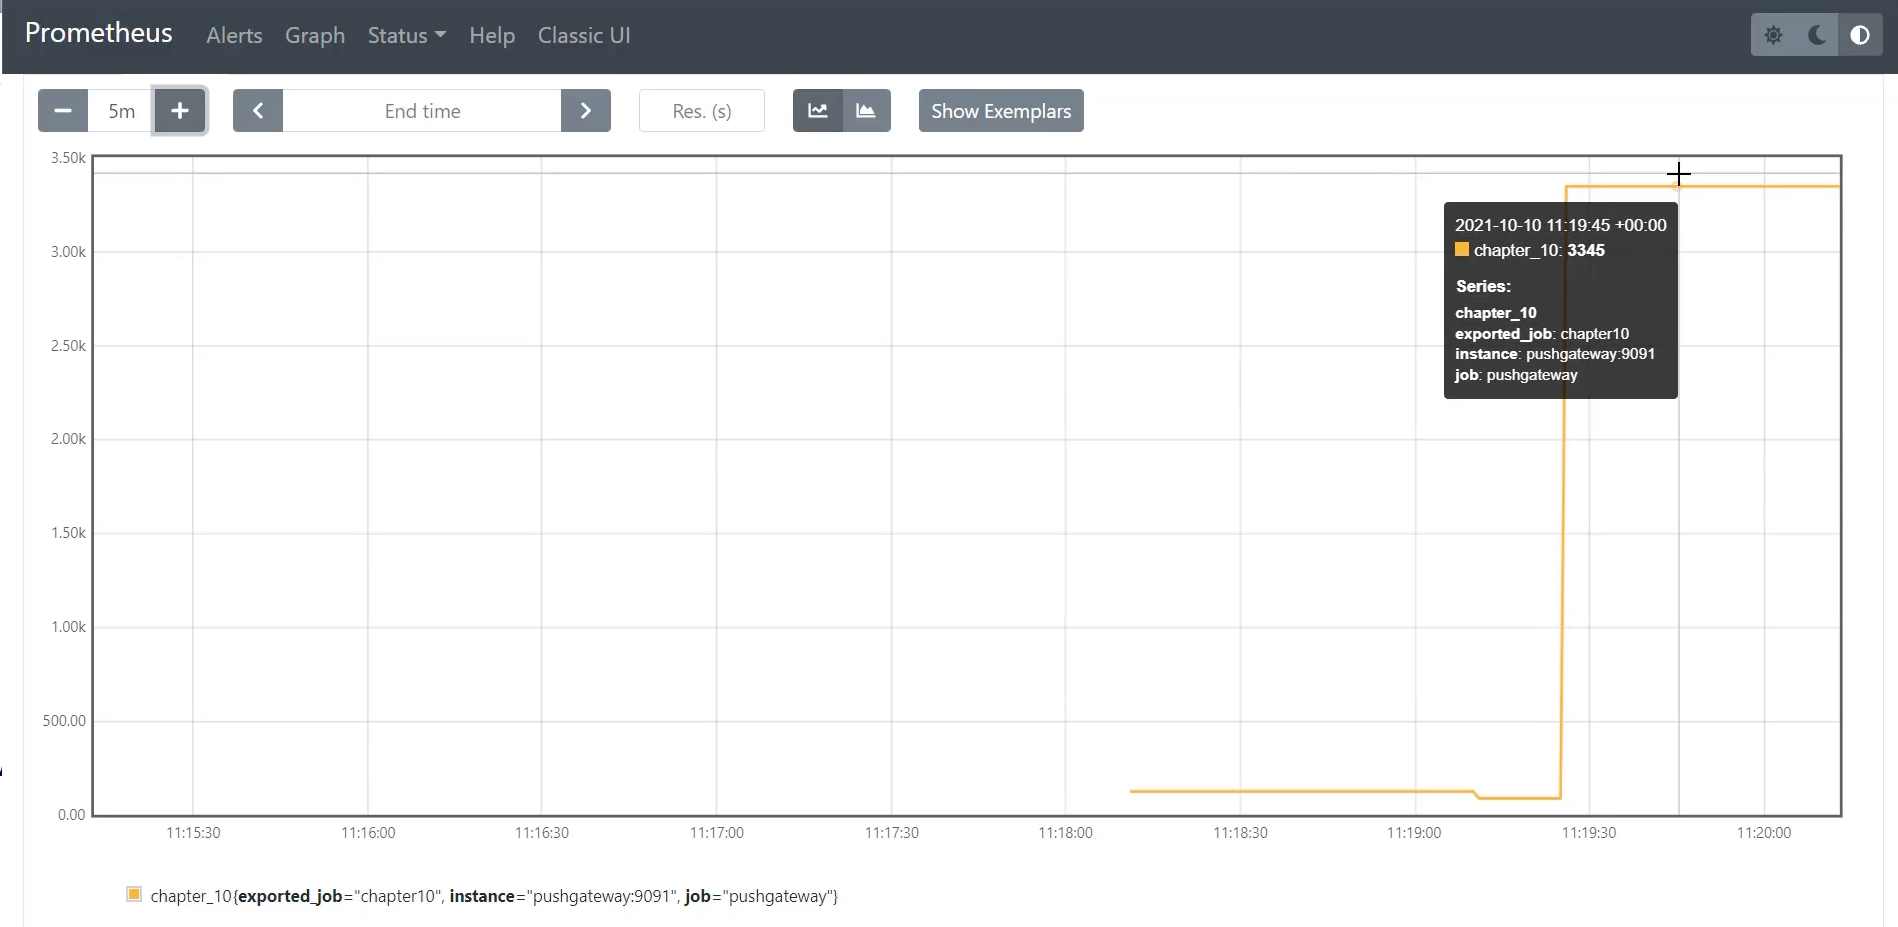
If I return back to all of my curl requests, I can see that I did a whole bunch of requests and it wasn't just to 87. So 123, 324, 4, and then 87, so we lost these two measurements.
In addition, we did a whole bunch of requests after 87, this 89324, and then 3345.
Because we can only store the most recent value in time in the Pushgateway and Prometheus only scrapes every 15 seconds, you end up with a point in time history, in every 15 second snapshot.
This is an important understanding about how metrics work.
Fantastic, at this point, we have a fully running Prometheus server and Prometheus Pushgateway that it will be easy for us to use throughout the next few chapters.
Next up is trying to get this ready to be used by GitHub Actions and our pipeline specific metrics.
