

Transcripted Summary
So far, we have generated metrics in a fairly simple format.
They've had a name and a value.
When we look at the metrics that we've collected so far, it's easy to see that we will be left a bit frustrated if we don't have more information.
For example, with our count of tests failed, I have this graph that shows that the count has changed over time, yet I have no idea what happened.
I think these are all from the same commit because they're running on a scheduled cron, but if they're from the same commit, how could we get different failures?
And if they are flaky tests that are intermittently failing, then I want to know which ones they are so that I can root them out.
This is the type of information that we'll want to gather, and we can do this, but to get there, we have to understand the more advanced strategies around collecting metrics.
So far, we stored in the most simplistic format possible - it's had a name and a value.
So for example, we are collecting github_actions_failed_tests{}.
If you notice, I've appended curly braces {} to the end of this name.
That's because when you send in just a metric name, it's implied that the curly braces are empty.
But what can go in those curly braces?
Those curly braces can hold tags, and those tags are key value pairs.
By default, there are two tags on every metric.
These help us make sure that the metrics of all the different services can be differentiated.
They tell us the name of the instance of Prometheus that collected the data, and they tell us the name of the service that we collected the data from.
These are both fundamentally required for Prometheus to work.
But, they don't add a ton of value to us when we're trying to understand what tests failed and what we should do about it.
Luckily, we can add our own custom metrics as well.
Here's an example of how I could add the GitHub repo that is reporting these test results in.
github_actions_failed_tests{repo="abangser/selenium"}
This can be helpful if we might work with multiple repositories, like for example, also the forked repository angiejones.
github_actions_failed_tests{repo="abangser/selenium"}
github_actions_failed_tests{repo="angiejones/selenium"}
The way that the multiple repos will show up is that they'll actually show up as new entries in the database.
That's because each unique combination of metric name plus unique set of labels will be a new entry that gets tracked over time for changes in value.
Now repos may help us some, but right now we're only working with a single repo, so I think I want more details.
Let's go look at the GitHub Actions page to see what else we might be able to take from it.
On this page, I can see that I may be interested in knowing the name of the workflow "on_push", the specific GitHub actions workflow that occurred, so number 31, as an example.
I may also want to know what branch this is running on and what commit, so "main" and the commit number "343".
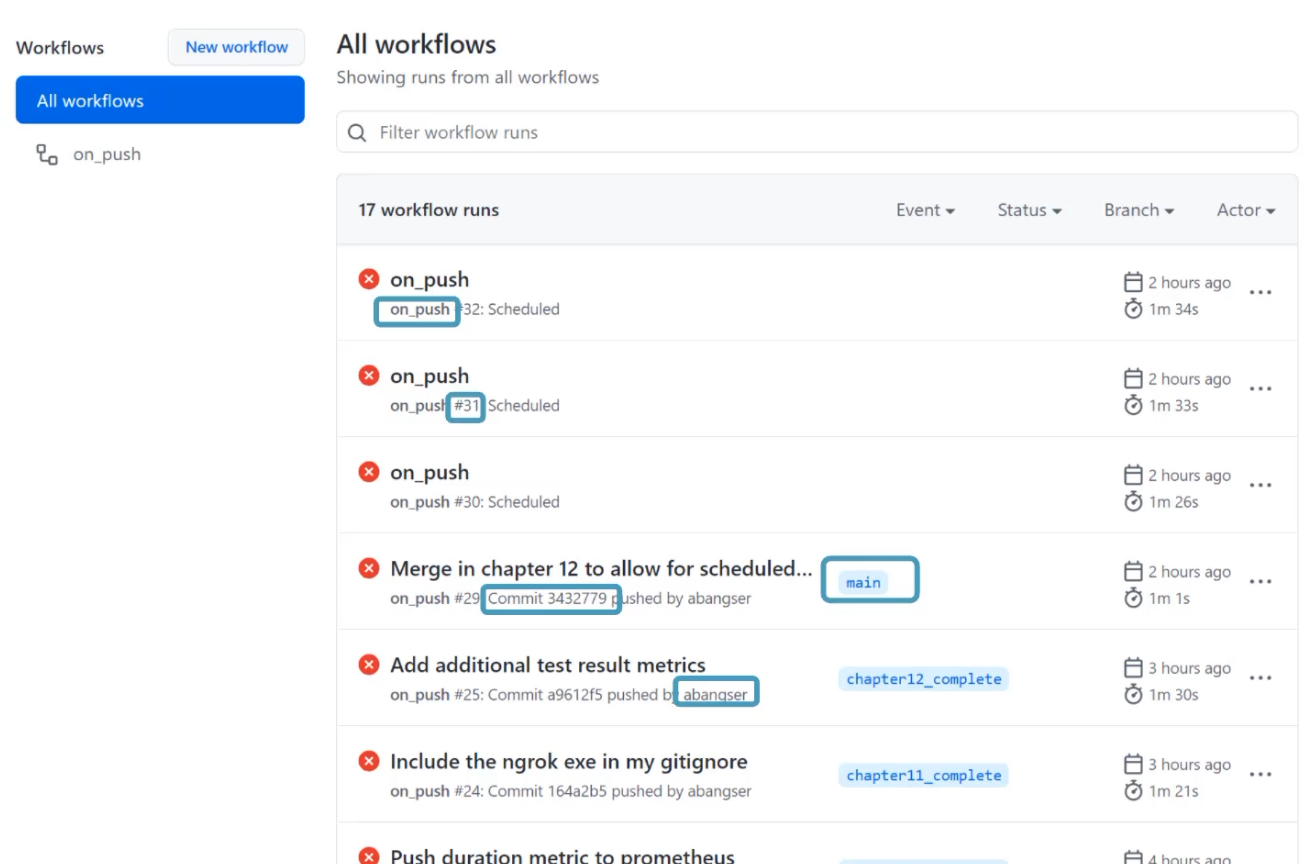
And of course, I may be interested to know what engineer this is running for, so that I can talk to them if there's a failing test.
I can dig in a little bit deeper though, and see even more.
For example, when I go to the specific workflow page, I can see that each step has an individual duration that may be helpful to me, and that each step has a pass or fail that may be helpful as well.
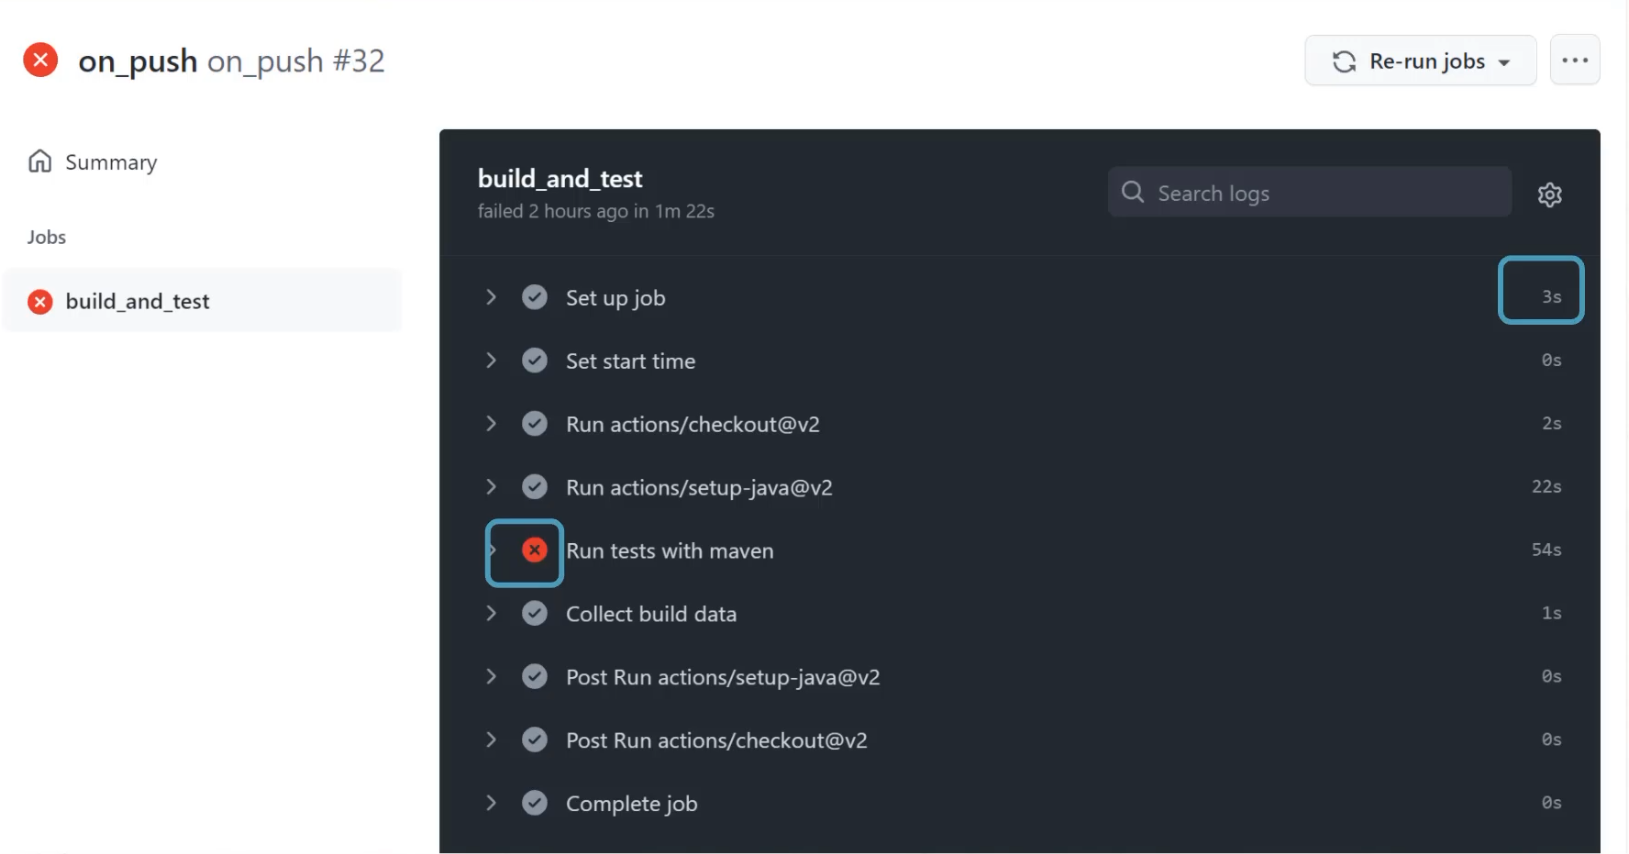
Going even deeper, I can see that inside of these steps, there may be valuable information.
Like for example, in here, I can see which test has failed.
All of this information can be added in as tags.
For example, here, I've added in the git branch as well.
github_actions_failed_tests{repo="abangser/selenium", git_branch="main"}
github_actions_failed_tests{repo="abangser/selenium", git_branch="chapter12_complete"}
github_actions_failed_tests{repo="angiejones/selenium", git_branch="chapter11_complete"}
I can see that I have two metrics for the abangser repo - one for the git branch main and one for the git branch chapter12_complete.
But if I keep going with this, what if I added the custom git_action_id?
github_actions_failed_tests{repo="abangser/selenium", git_branch="main",git_action_id="34"}
github_actions_failed_tests{repo="abangser/selenium", git_branch="main",git_action_id="35"}
github_actions_failed_tests{repo="abangser/selenium", git_branch="chapter12_complete",git_action_id="32"}
github_actions_failed_tests{repo="angiejones/selenium", git_branch="chapter11_complete",git_action_id="31"}
Now I have three metrics for the abangser repository, because I have two for the git branch main that have different IDs - id 34 and id 35.
What we're talking about here is cardinality.
Cardinality describes how many different values there can be for any given tag, and then that will roll up into a cardinality for the metric.
When we talk about things being low cardinality, these are topics that have only one or a few different possible values.
This might be for example, the repo.
When we talk about things having higher cardinality, they can have many or possibly even an infinity level of values.
For example, the custom ID for action ID is going to be unique for every run because it is a unique identifier.
Since each metric costs storage and energy to deal with, low cardinality is lower cost, but it also is a cost on us as engineers because we don't get as much information.
Higher cardinality is a higher cost on our database, but provides us potentially the details that we need to be able to understand what's going on.
Let's have a look at the math behind this, just to get a sense of how this grows.
If we're looking at something fairly small - maybe two test suites, a few branches, and a few authors, we're sitting at something like 150 metrics over time being calculated.
The minute that we start adding something with higher cardinality, like the ID, or like the commits, we're already speaking about thousands, because this is a multiplied value across all the different tags.
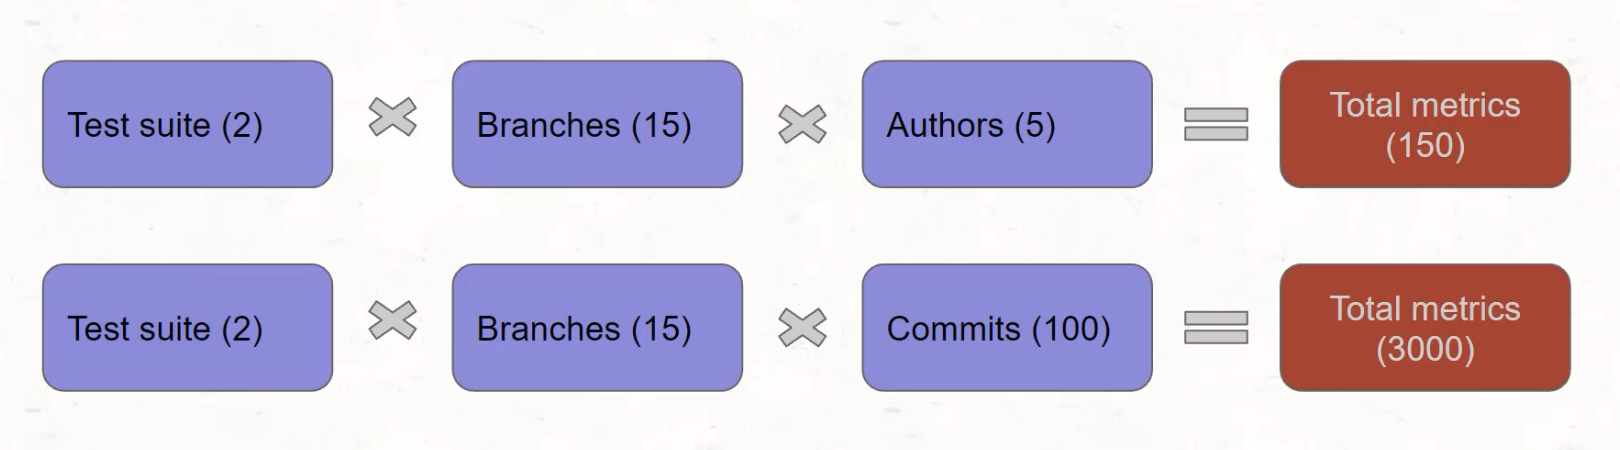
Each new tag you introduce gets multiplied against all other existing tags.
# What does more metrics mean?
With time series databases, those new metrics with those new tags and those new values get tracked over time.
The database will always know about the metric that existed with that unique combination of tags, and it will be thinking about whether or not it should be adding a new value to it.
That's why high cardinality data can substantially impact the performance of a database.
Now, as someone who's using these metrics, you should look to try and include some useful information when trying to store them or else you're storing data that it won't be useful anyways.
But, you may even need to work with your operations engineers to make sure that the data you're adding is not negatively impacting the service that they're providing.
Let's now take a moment to extend on the metrics that we have in our codebase to add more cardinality.
Here I am, and I'm going to go look at the script where I'm introducing the metrics about test results.
That script can be found under webdriver_java/resources/test_result_script.sh.
Inside of here, I have an opportunity to add some labels to this result.
To do that, I need to add the curly braces {} at the end of the metric name (ex. github_actions_ignored_tests{}).
Within these curly braces, I can add key value pairs - like for example, I might want to add commit.
I may also want to add author, and finally, I might want to add the branch that this is on.
github_actions_ignored_tests{commit="", author="", branch=""} $(echo ${TEST_RESULTS_STRING} | awk -F '"' '{ print $2 }')
This way, I can start to prioritize things that are happening on my main branch, things that are happening to commits that I did, and things that are happening on the same commit, but differently.
For each of these, I'm going to introduce an environment variable that's provided from GitHub.
With that, I need to use a dollar sign and curly braces ${} to introduce that variable.
These variables can be found on the GitHub website. \
I'll go and have a look at how to identify them.
The link to this documentation is listed below.
Here are the default environment variables.
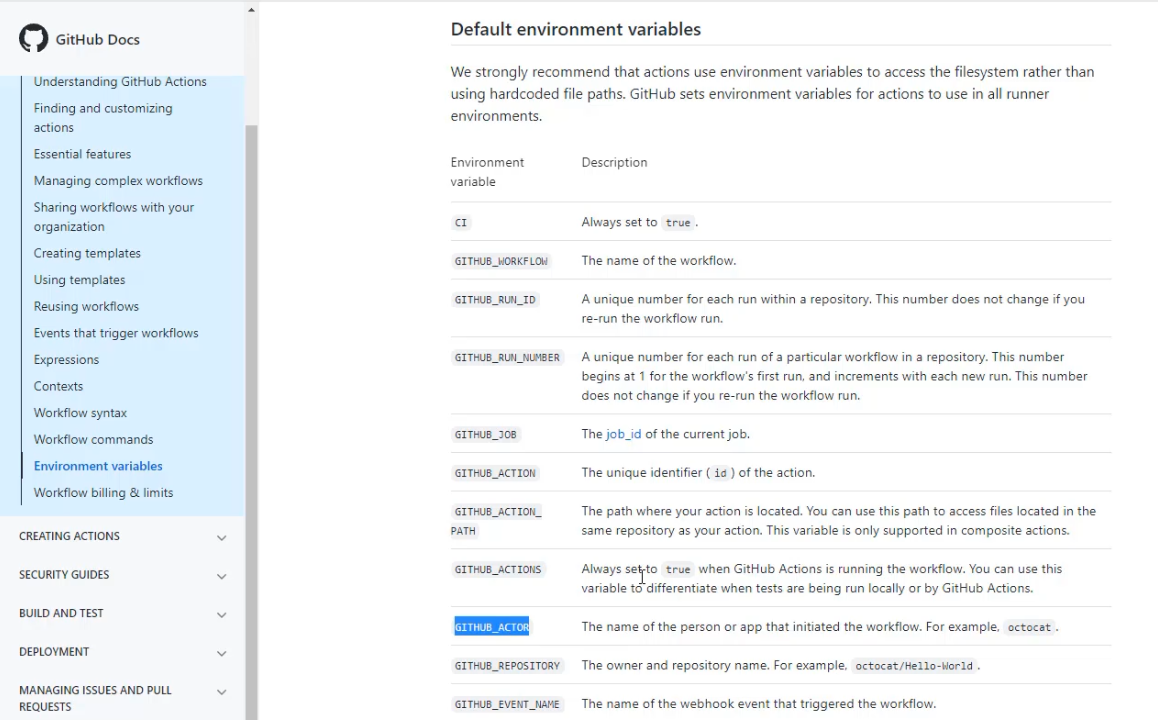
For example, I can see that GITHUB_ACTOR would indicate to me who has created this GitHub Action.
I'll take that and head back to my codebase.
Now, that might be slightly different than the author, so I think I want to change author to actor, and I'm going to introduce that variable.
Now, I need commit and branch.
The commit is going to be the GITHUB_SHA and the branch is going to be GITHUB_REF.
github_actions_ignored_tests{commit="${GITHUB_SHA}", actor="${GITHUB_ACTOR}", branch="${GITHUB_REF}"} $(echo ${TEST_RESULTS_STRING} | awk -F '"' '{ print $2 }')
I can now look to replicate these tags across all of the metrics. I can copy that and paste it, each of these locations.
cat <<EOF | curl --data-binary @- ${PUSHGATEWAY_URL}/metrics/job/github_actions
github_actions_ignored_tests{commit="${GITHUB_SHA}", actor="${GITHUB_ACTOR}", branch="${GITHUB_REF}"} $(echo ${TEST_RESULTS_STRING} | awk -F'"' '{ print $2 }')
github_actions_total_tests{commit="${GITHUB_SHA}", actor="${GITHUB_ACTOR}", branch="${GITHUB_REF}"} $(echo ${TEST_RESULTS_STRING} | awk -F'"' '{ print $4 }')
github_actions_passed_tests{commit="${GITHUB_SHA}", actor="${GITHUB_ACTOR}", branch="${GITHUB_REF}"} $(echo ${TEST_RESULTS_STRING} | awk -F'"' '{ print $6 }')
github_actions_failed_tests{commit="${GITHUB_SHA}", actor="${GITHUB_ACTOR}", branch="${GITHUB_REF}"} $(echo ${TEST_RESULTS_STRING} | awk -F'"' '{ print $8 }')
github_actions_skipped_tests{commit="${GITHUB_SHA}", actor="${GITHUB_ACTOR}", branch="${GITHUB_REF}"} $(echo ${TEST_RESULTS_STRING} | awk -F'"' '{ print $10 }')
EOF
Now I'm ready to send these to Prometheus by committing these into my repo.
Go to "Commit", and I can have a commit message that talks about adding the tags, add that change to the script, "Commit and Push". \
With that successfully pushed to the remote, I can go back to GitHub and check out the Actions tab.
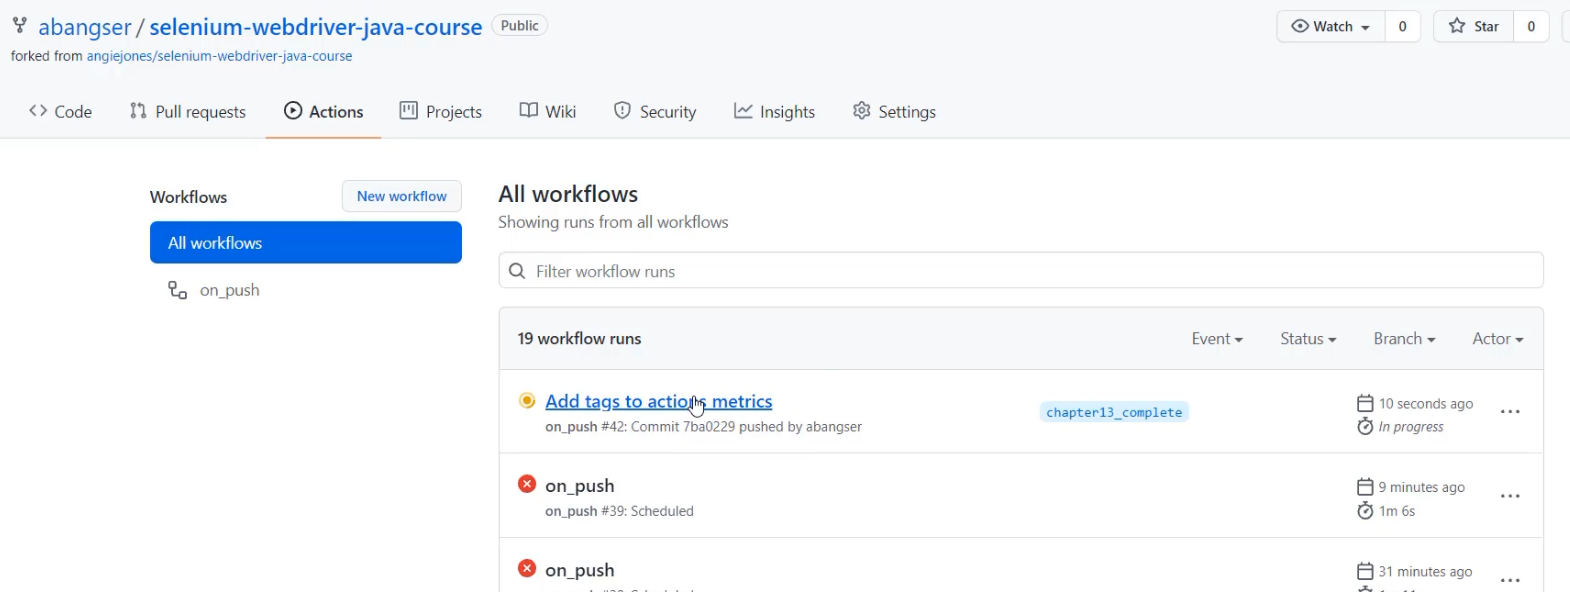
Here, I can see that that has triggered a new workflow so I can open that up and follow along, which I will speed up for ease of watching.
Here I am with my completed tests.
I can see that I sent these metrics off to Prometheus, and so I can go to the Prometheus tab and have a look.
Here in Prometheus, I can have a look for my GitHub actions, failed tests, and I can search for those.
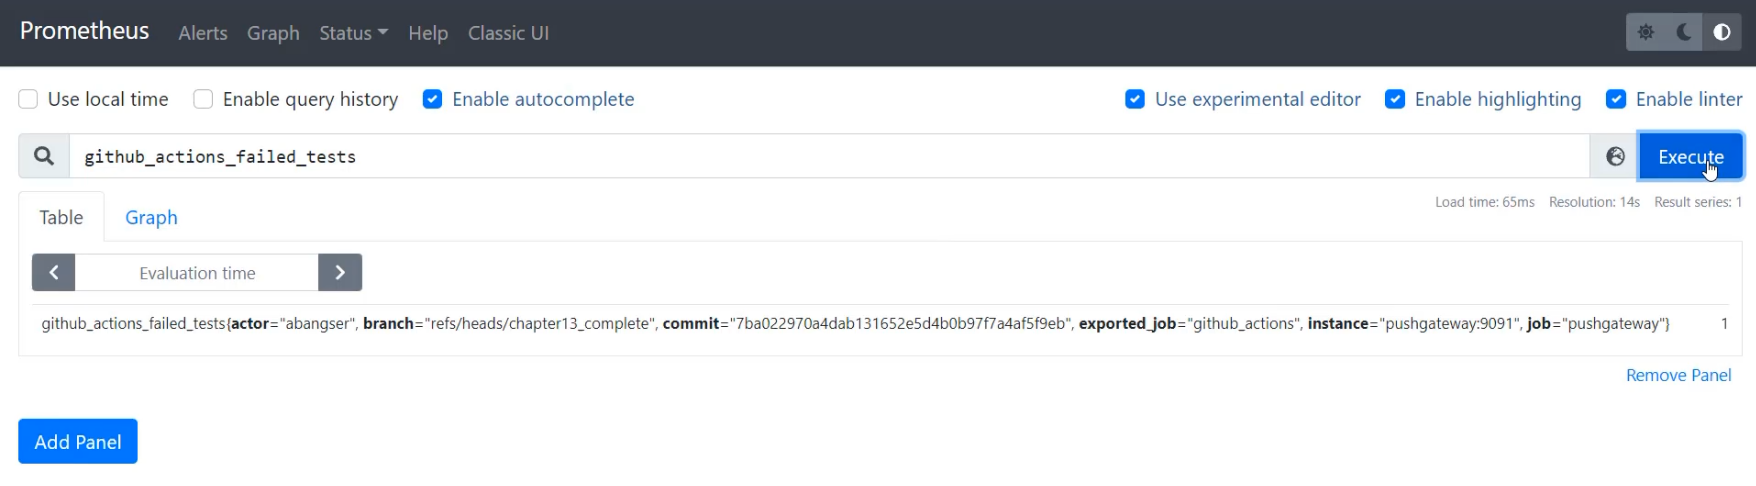
Here I can see that I've had a single metric that has added "actor", "branch", and "commit" to the tags.
Now with running these over time, I'll be able to see that these will change because the branch will change, as will the commit and the actor.
But on this repo, not too much will change about these tags, so it might be interesting to add one more tag in - for example, the specific action that is running the test. \
Let's return to our codebase and add that tag.
Here I am and I'm going to add action_id, and that's going to have a GitHub environment variable as well.
To look that up, I'm going to return to the browser and here in the environment variables, I can look for the GITHUB_RUN_ID.
This is a unique number for each run within the repository.
In comparison, the GITHUB_RUN_NUMBER is a unique number for each run of the particular workflow.
This will actually increment with each and every run, including reruns - I think that's more what I'm looking for.
So I'm going to take GITHUB_RUN_NUMBER and return to my code and paste that here into this variable space.
This needs a comma at the end, and then I can replicate that across my metrics.
cat <<EOF | curl --data-binary @- ${PUSHGATEWAY_URL}/metrics/job/github_actions
github_actions_ignored_tests{action_id="${GITHUB_RUN_NUMBER}", commit="${GITHUB_SHA}", actor="${GITHUB_ACTOR}", branch="${GITHUB_REF}"} $(echo ${TEST_RESULTS_STRING} | awk -F'"' '{ print $2 }')
github_actions_total_tests{action_id="${GITHUB_RUN_NUMBER}",commit="${GITHUB_SHA}", actor="${GITHUB_ACTOR}", branch="${GITHUB_REF}"} $(echo ${TEST_RESULTS_STRING} | awk -F'"' '{ print $4 }')
github_actions_passed_tests{action_id="${GITHUB_RUN_NUMBER}",commit="${GITHUB_SHA}", actor="${GITHUB_ACTOR}", branch="${GITHUB_REF}"} $(echo ${TEST_RESULTS_STRING} | awk -F'"' '{ print $6 }')
github_actions_failed_tests{action_id="${GITHUB_RUN_NUMBER}",commit="${GITHUB_SHA}", actor="${GITHUB_ACTOR}", branch="${GITHUB_REF}"} $(echo ${TEST_RESULTS_STRING} | awk -F'"' '{ print $8 }')
github_actions_skipped_tests{action_id="${GITHUB_RUN_NUMBER}",commit="${GITHUB_SHA}", actor="${GITHUB_ACTOR}", branch="${GITHUB_REF}"} $(echo ${TEST_RESULTS_STRING} | awk -F'"' '{ print $10 }')
EOF
With this I can make another "Commit and Push".
I can return and have a look at the actions running and then later the metrics themselves.
We've got this action running now, and in about a minute, I'll be able to see this come through in Prometheus.
Great, time to go back to Prometheus and re-get this metric.
As long as I've waited 15 seconds, I'll see the action_id appear.
This will be very interesting because when I refresh again after the next run, I will see a different action_id.
If I go back to my "Actions" tab, I can see that I have a scheduled run about to kick off, so when this one comes through, I'll be able to see that there's more than one metric here.
I've now let this run for a few scheduled runs, and I'm going to go back to Prometheus and check out the metric.
Here I am with the metric, and it's fully up to date.
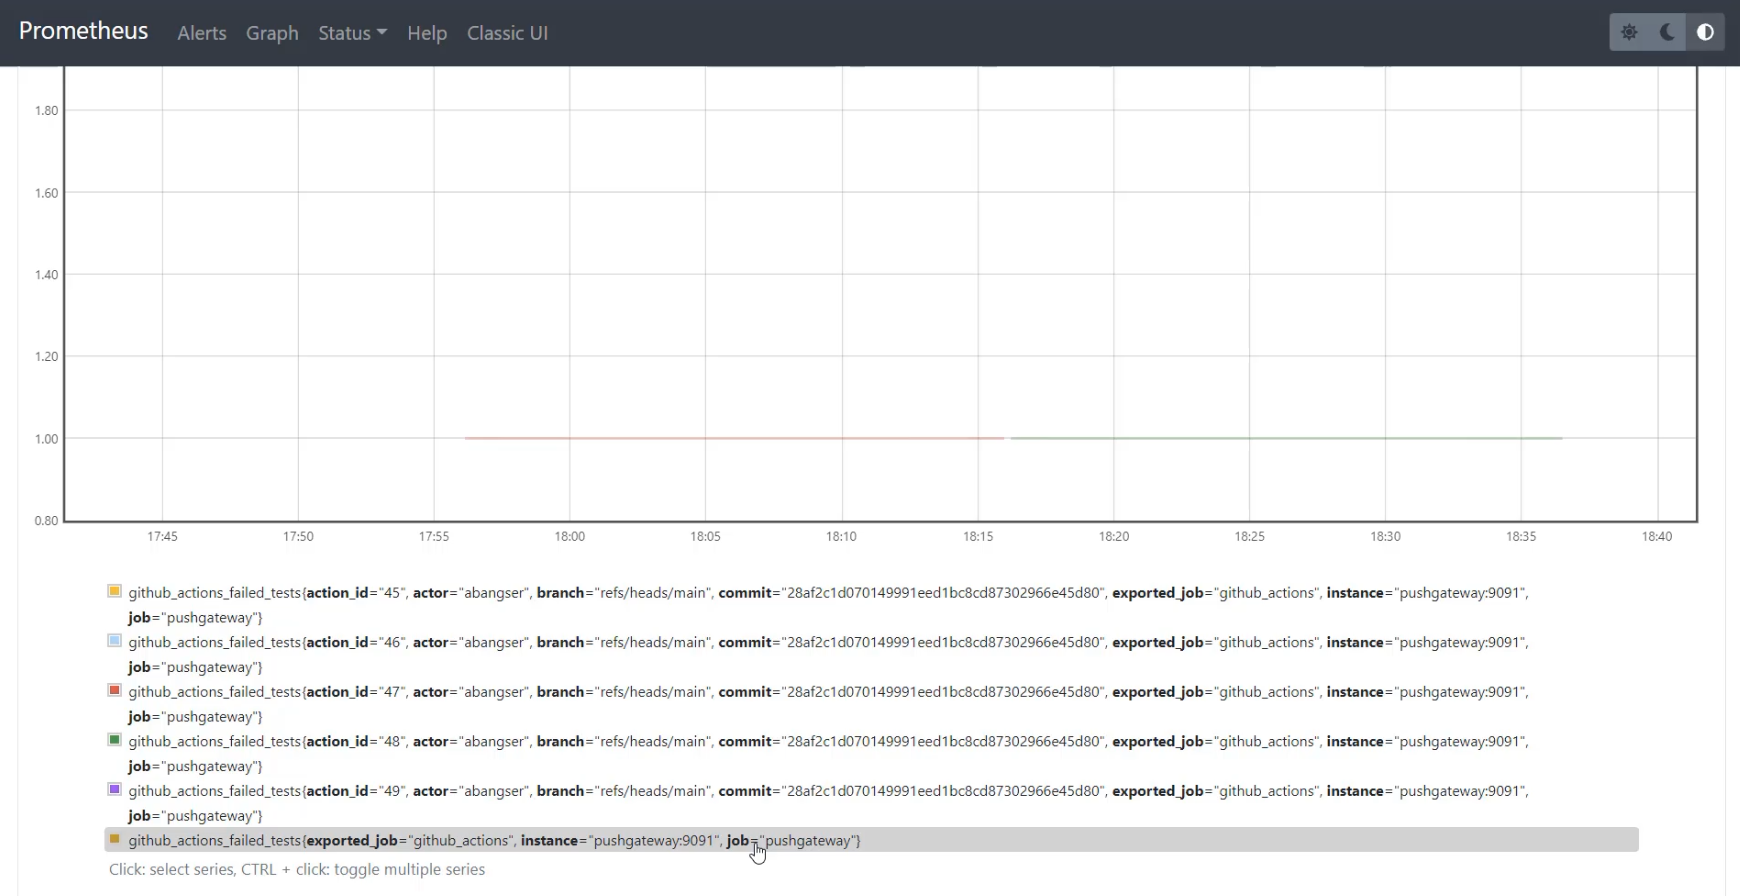
I'm now going to switch to the "Graph" tab to see how it's changed over time.
With the "Graph" tab open if I scroll down, I can see all of the different series that make up the graph.
I can see that I have a series per action_id - this is meaning that I'm not getting a nice long flow, but I am seeing all the action_ids.
If I want to see a flow of the number of failed tests across action_id, I can use the Prometheus query of without and I can pass action_id, and to do this, I need to have some sort of an aligner on, so I'm going to use max.
max(github_actions_failed_tests) without(action_id)
This way, if there's ever two different calculations of the GitHub failed tests at the same time that can't be uniquely identified by action_id, we're going to take the larger and show it on the graph.
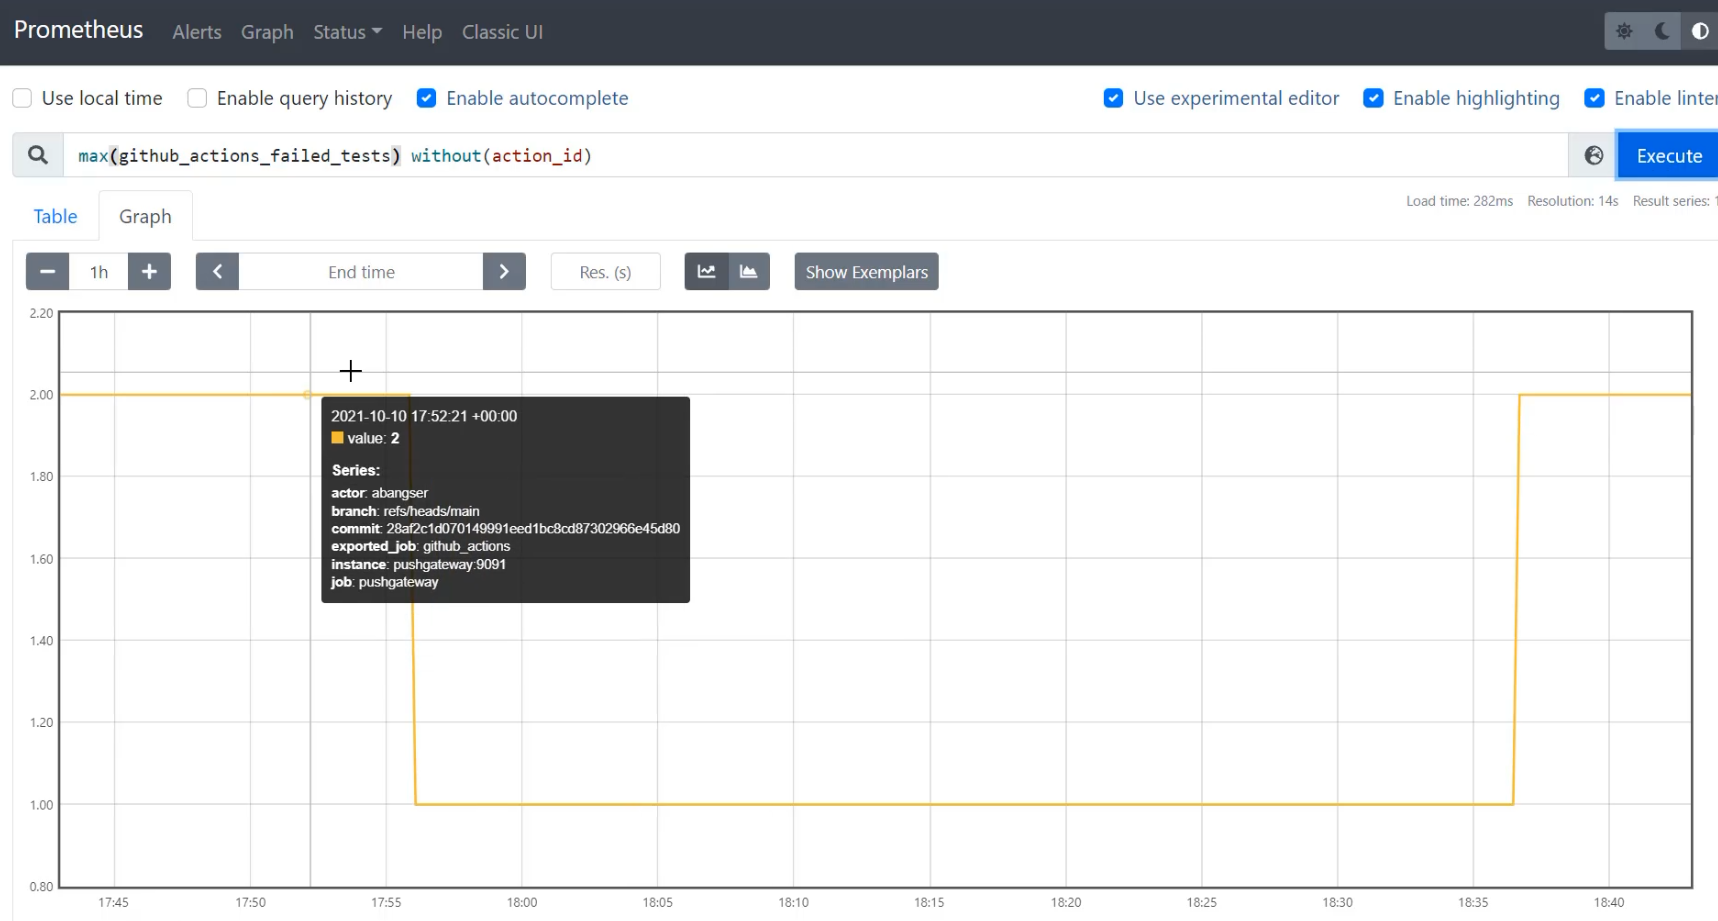
When I do that, I can now see that those lines have been connected and we're taking the largest value at any given time, ignoring the action_id. This allows us to have the detail of action_id if we do see a problem, but also gives us the ability to create trends over time, which can give us dashboards and alerts as things have changed.
Therefore, we have monitoring to trend over time and also, a little bit of support of observability to be able to triage when we do see problems.
We're going to wrap up the chapter here and we're going to talk a little bit more about how metrics support monitoring and observability in the next chapter.
