

Transcripted Summary
So far in this course, we have covered our hopes for what monitoring and observability can provide us.
We have also created a test subject that has some odd behaviors we may want to investigate.
Let's dig in a bit deeper on what we would benefit from knowing about this test suite.
Here I am, looking at the builds we have run so far in GitHub Actions.
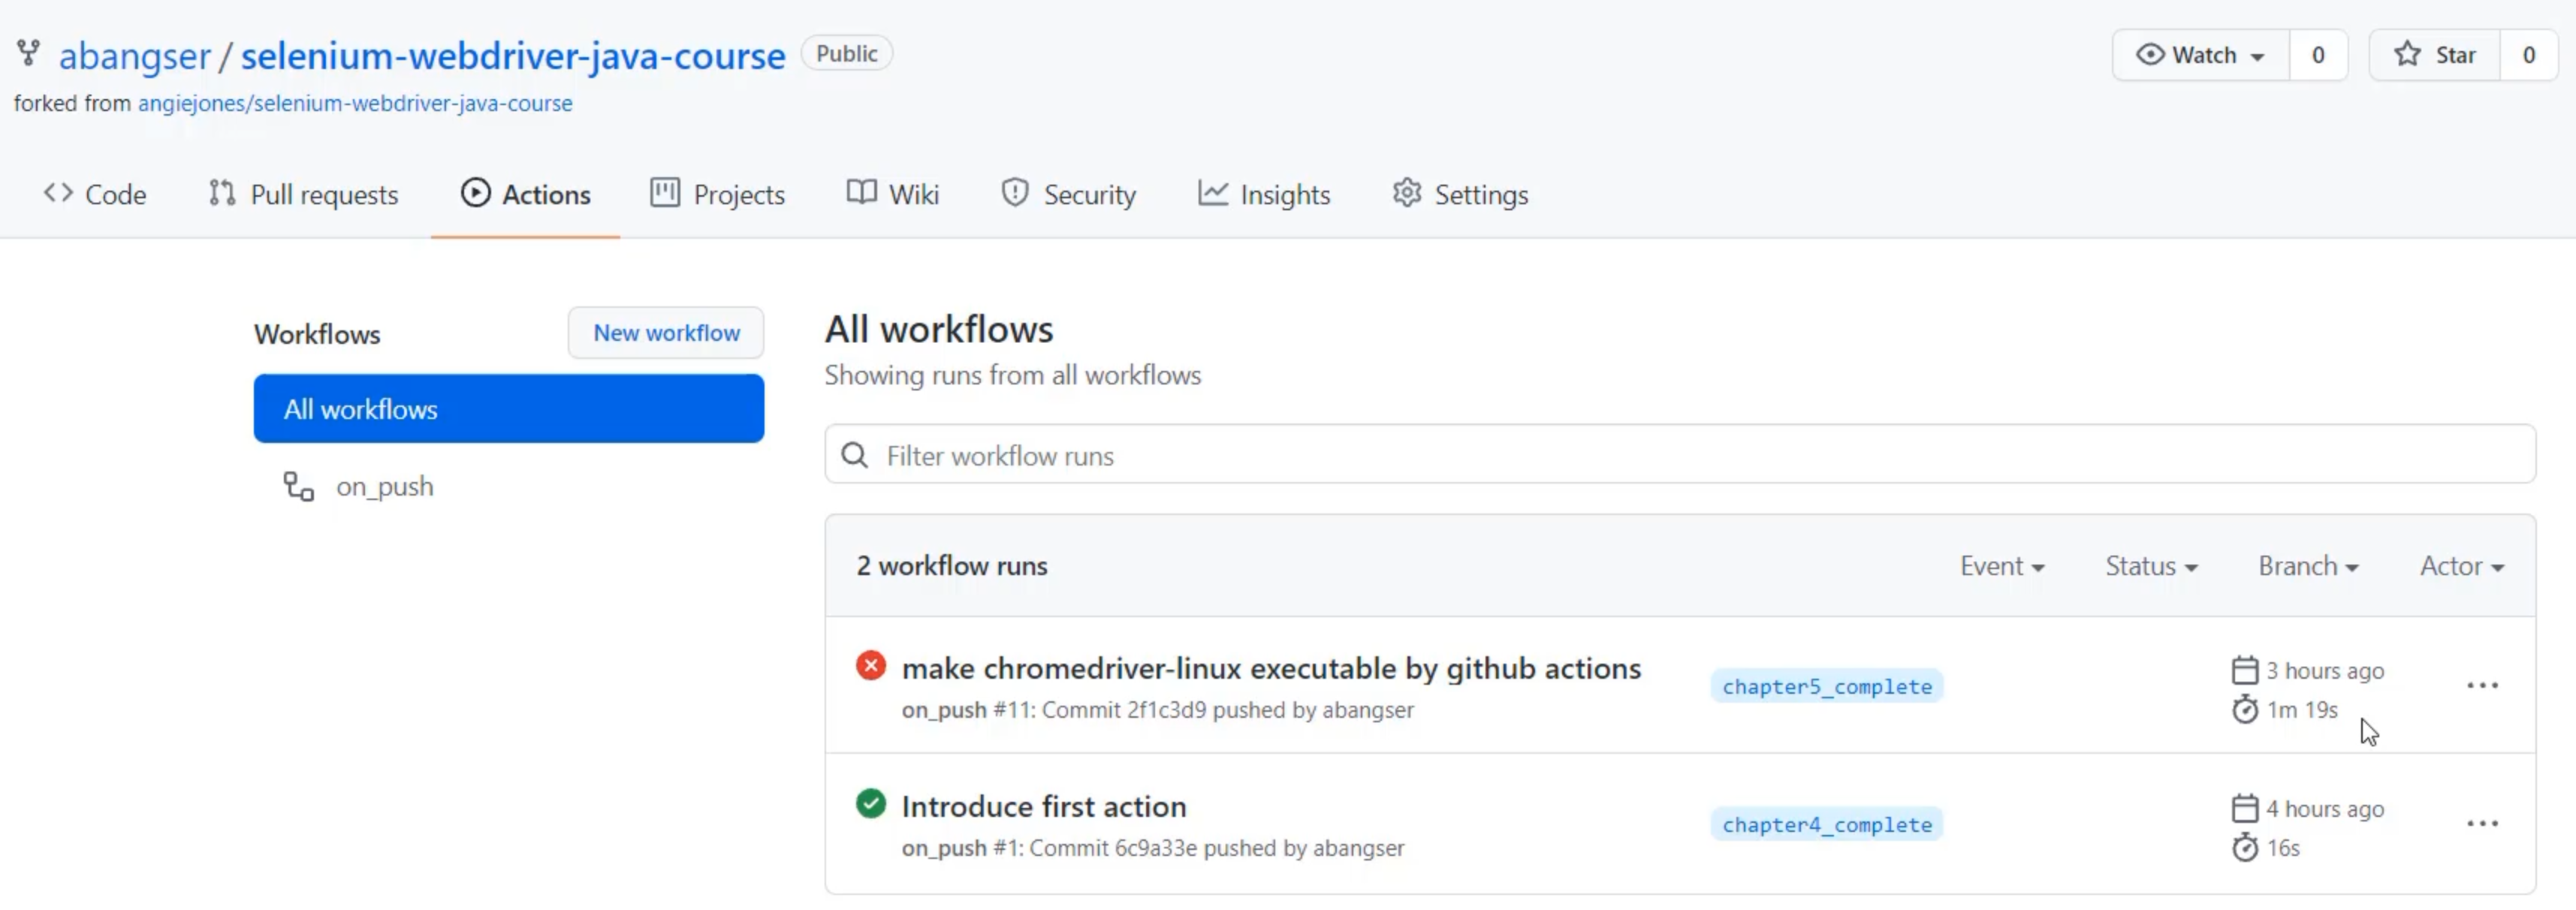
I can see all sorts of interesting information on this screen, but so much of it is hidden beneath the surface, behind some number of clicks.
For example, I can see what the commit was that forced this workflow to run.
I can also see the engineer who pushed it.
I can also see how long that job took - 16 seconds or 1 minute 19 seconds here.
But I can't see what each of the individual steps inside of that job took to run, so I can't tell why one might be much faster or slower than the other.
In addition, I can see that this one failed and this one passed, but I can't see for what reason.
Not only that, I can't see what the ratio is.
Of course I can look at this screen and see that I have a 50% passing rate, but imagine that I had tens or hundreds or thousands of these -how will I know how I'm doing on a regular basis?
Let's now click in and get to see a little bit more detail.
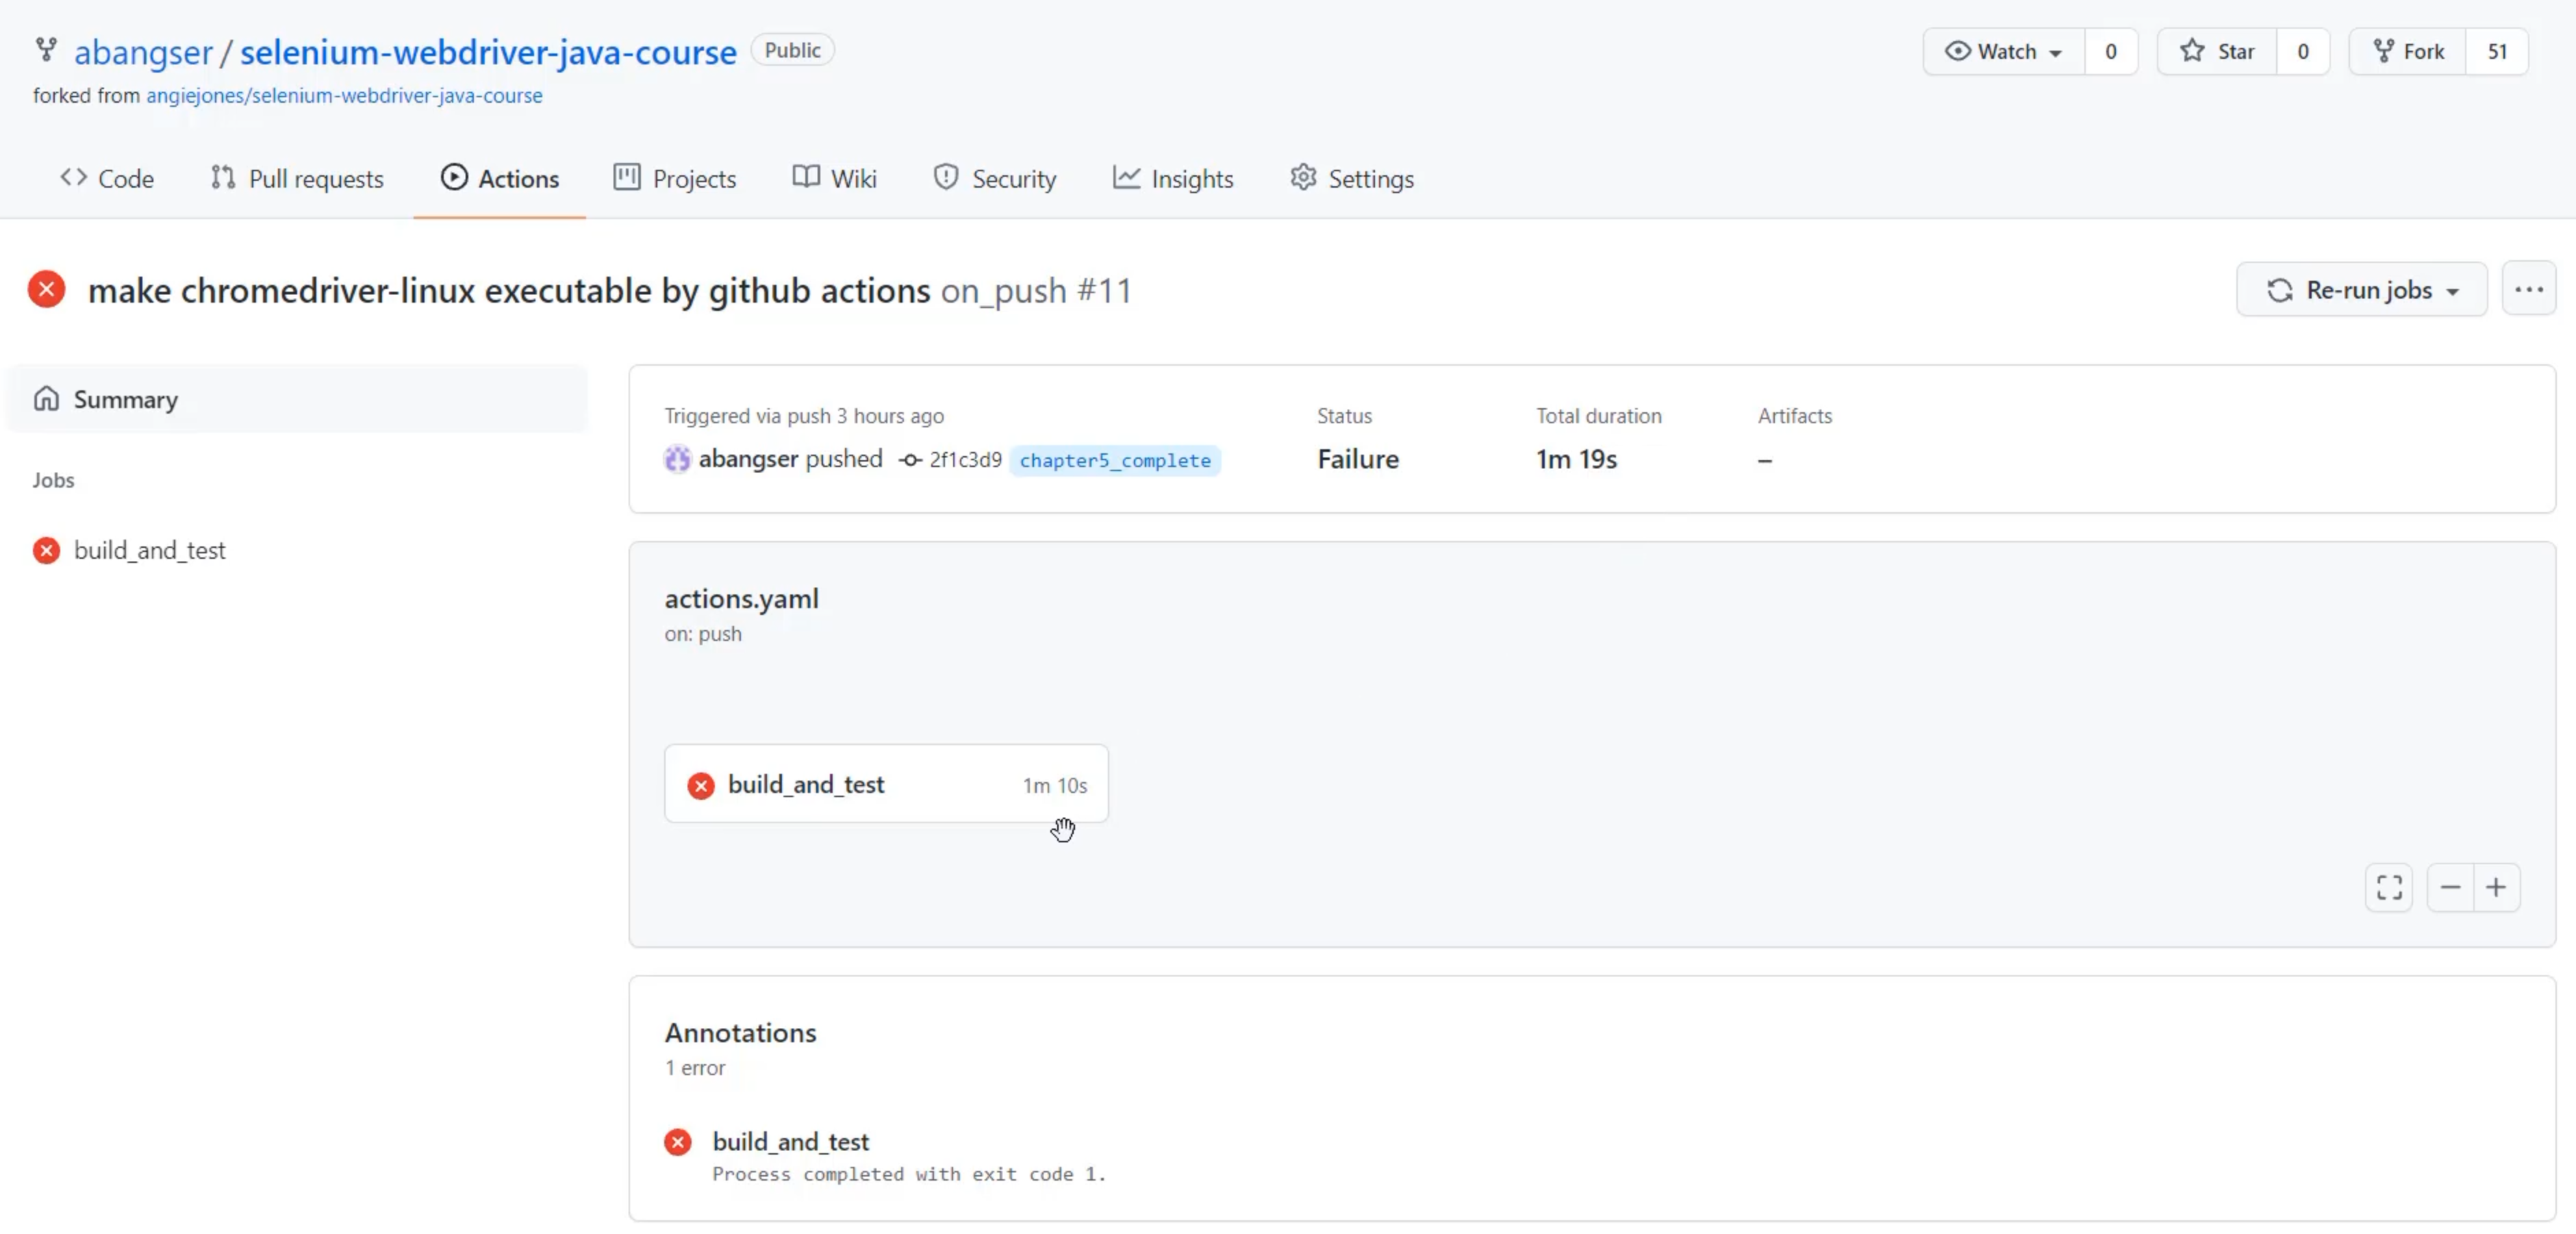
In here, I have a little bit more detail - like for example, the total duration is 1 minute 19 seconds, whereas my job took only 1 minute 10 seconds.
So, this shows me some amount of overhead for running these jobs on GitHub Actions.
But reality is, I still need a lot more detail, so I need to click in and look at the "build_and_test" job in specific.
I'm going to first collapse this and look at the job as a whole.
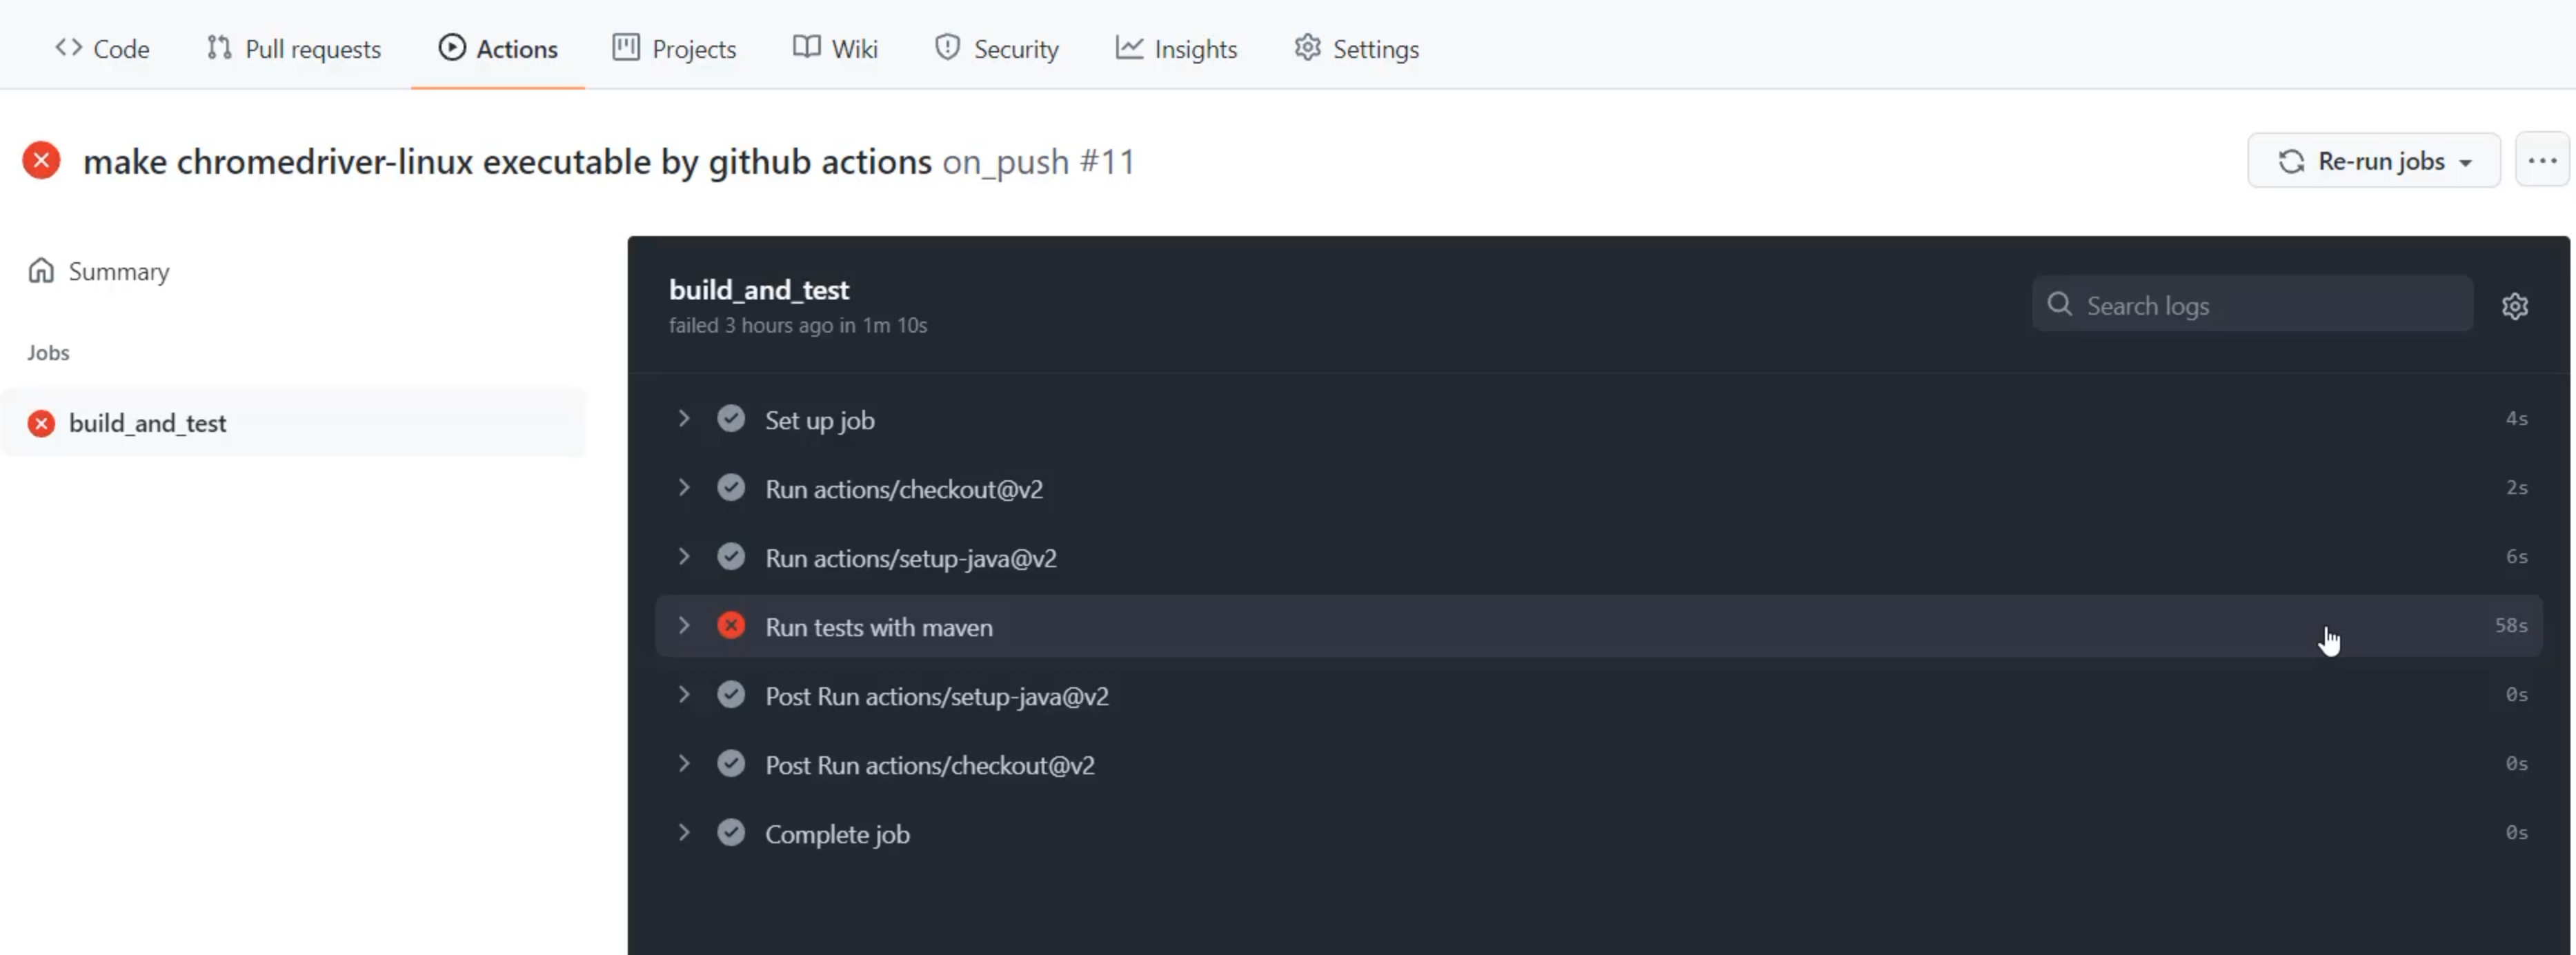
I can see here that there are a few different steps, and the main step we're doing, which is running tests with Maven, took the bulk of the time at 58 seconds.
When I open up that step, I can see all sorts of logs in here.
This is information about what ChromeDriver is doing as it's going, so clicking on things and typing things.
It's also talking about the versions that I'm using of the different software.
Down the bottom, I get a sense of how the overall suite performed.
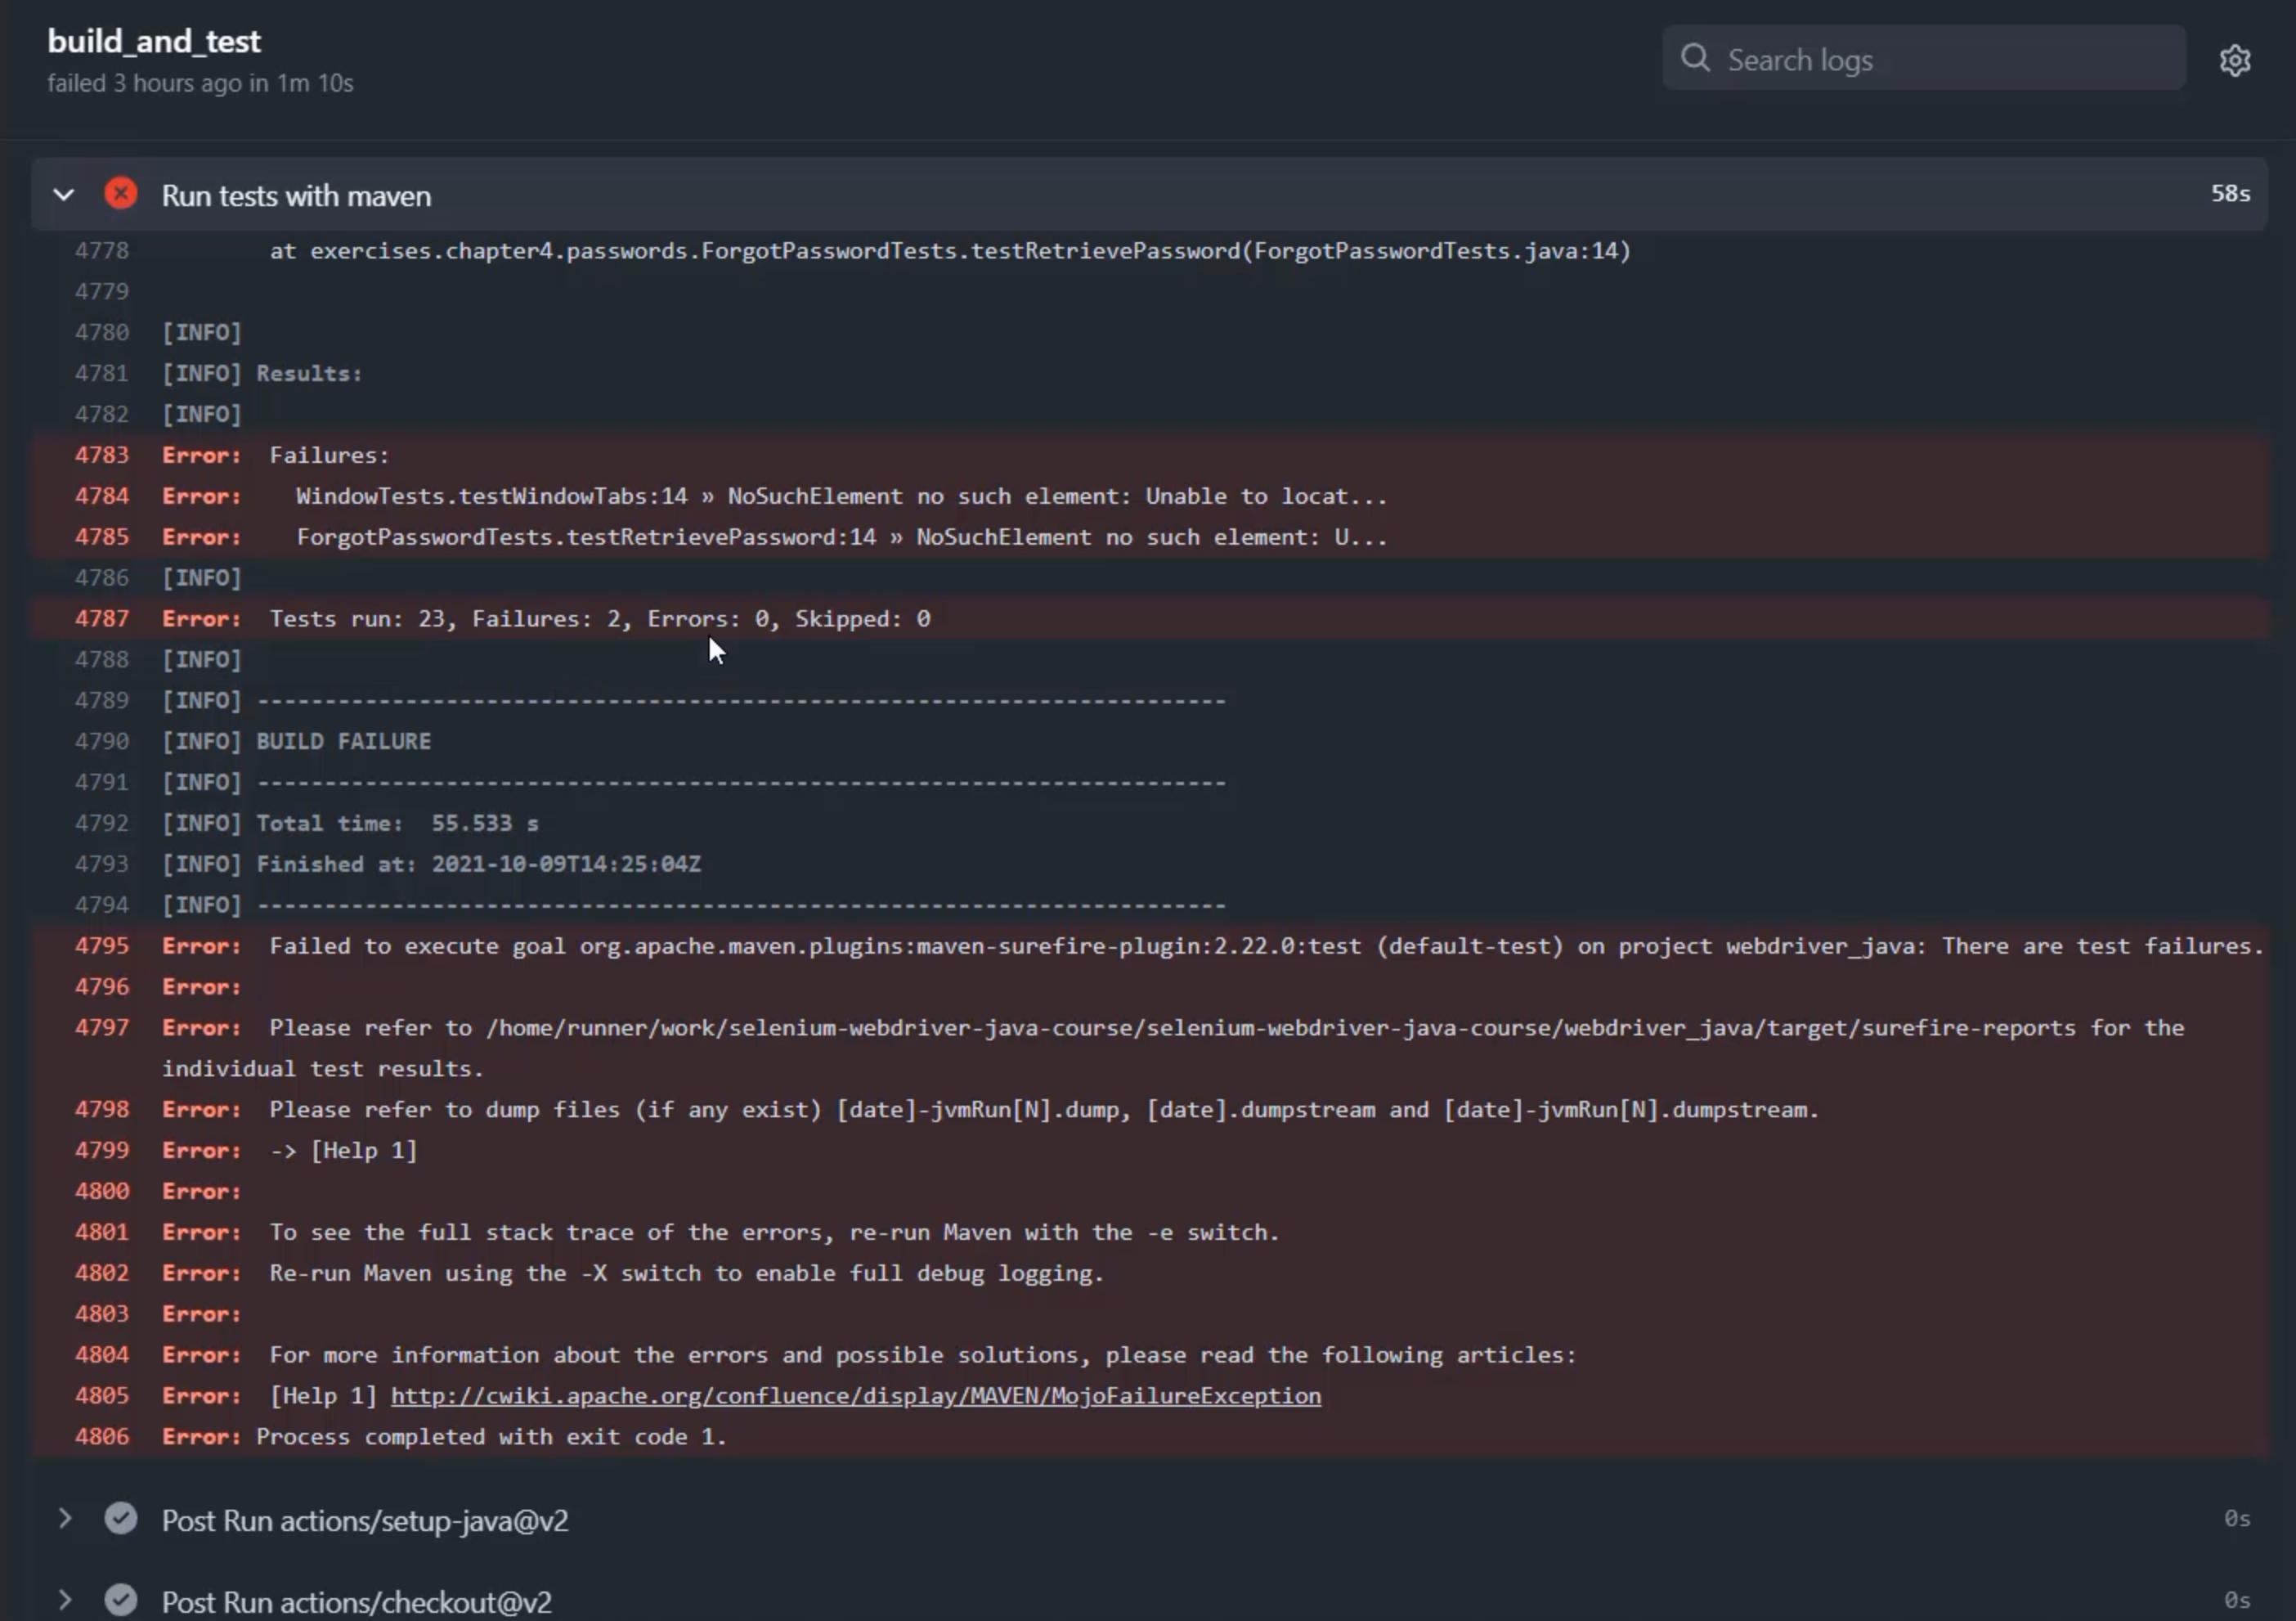
I can see that I ran 23 tests, of which two failed, no errors and no skips.
Within those failures, I can see which tests failed here on this line and this line.
And even further within those failures, I can see stack traces about what actually failed in those tests, so I can go and find the specific line of code that was having a problem.
As we talk about the different information available here, we may be starting to scratch that itch and that concern about when do we use metrics and when do we use logs?
So if we list out all of these items as a list, we can have a think about why logs and why metrics.
As a recap, logs are expensive to keep for a long period of time.
That's because they're really great for holding specific details and they can hold a whole lot of text that can take space to be able to store, and that costs money.
Metrics on the other hand, store only a single numeric value over time, so they provide a cheap way to track over long durations.
But that cheap way becomes extremely expensive the more detail you add to it, the more you make it like logs.
So if we take this list and we try and split it, we may get a better sense for what makes a good metric and a good log.
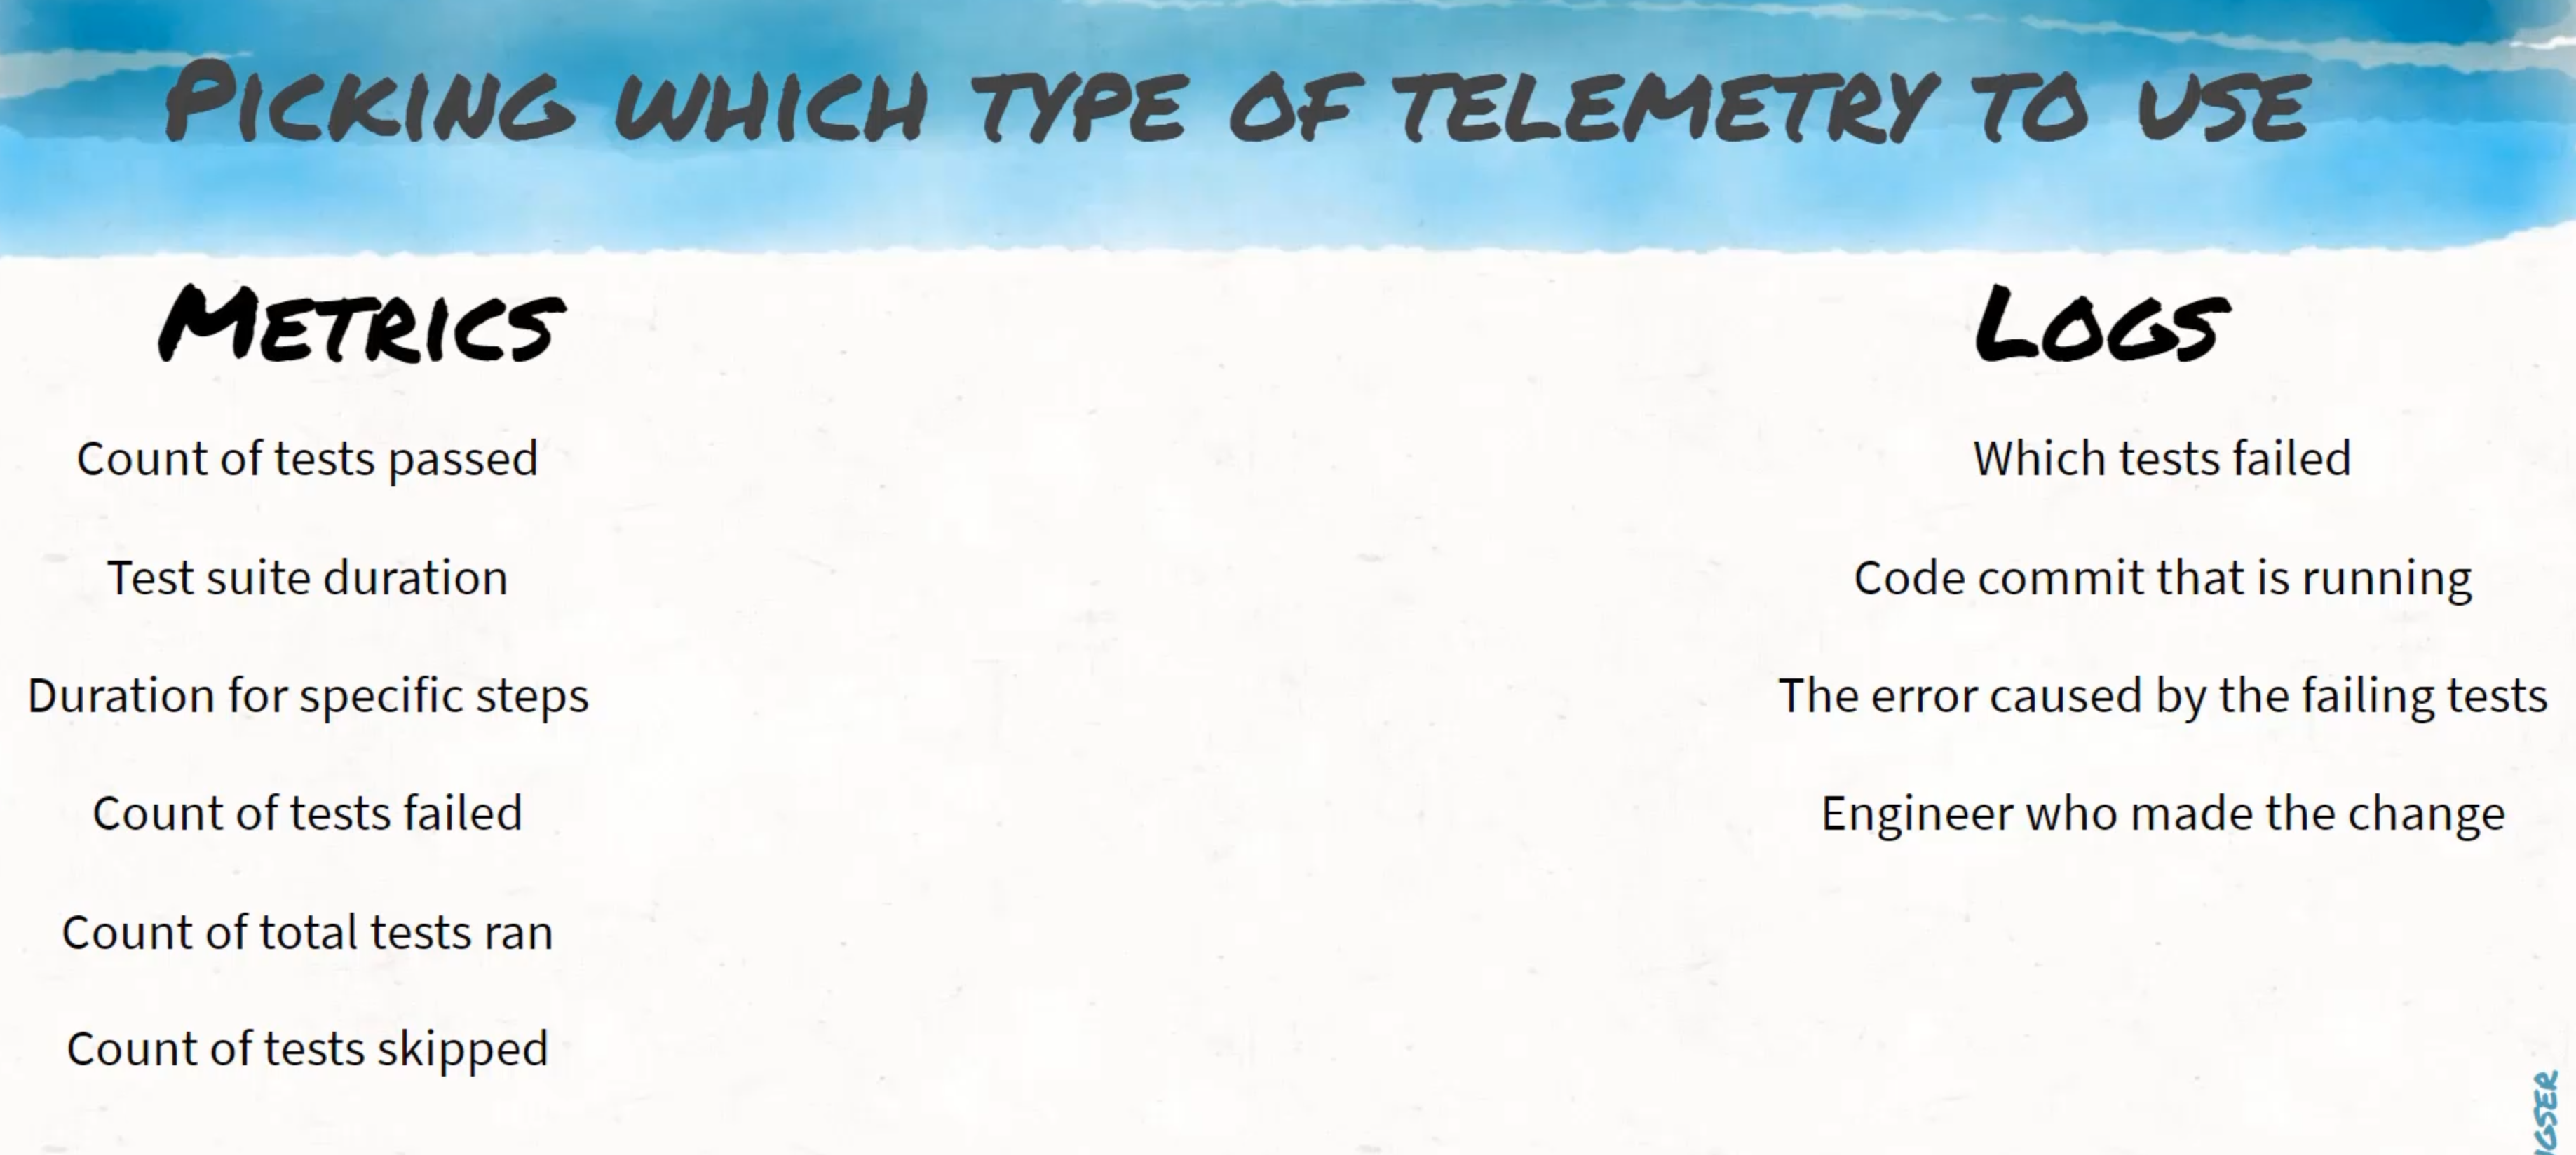
For example, a count of how many tests passed makes for a great metric.
We now can see this number trending either up or down over time.
Same thing with test suite duration.
When we start looking at which test failed or which code commit was the one that was running, and even more so, what the errors were that were caused by the failing tests, we're starting to live in the world of logs.
Some specifics can live in metrics.
For example, duration of a specific step is still a metric.
You can track some details like 'What step is this?' along with the metrics.
Counts of tests failed, of course, can be living in the metrics world.
Which engineer made a change is the type of detail that lives with logs.
Then we can also count as many other things as we want, like total tests run or tests skipped.
We will be returning to this list of data as we try and extract this from the pipeline throughout the rest of the course, and as we try and load it into both monitoring and observability tools in order to explore it further.
That being said, there are probably a lot more metrics that I can think of and so can you.
I encourage you to brainstorm for your project - what are the things about your pipelines and about your systems that would provide you information in a quick and easy way to be able to triage and fix problems in your pipeline?
But for this course, we will leave it here. Join me in the next chapter to look at how to extract these from our GitHub Actions.
