

Transcripted Summary
In this chapter, we're going to wrap up our look at metrics by understanding where there are some gaps in our observability when using metrics.
So far in our course, we introduced three different visualizations of telemetry data.
Those are: metrics, traces, and logs.
These are three different visualizations, but they are also often three different databases and types of data, and for that reason, we focused in on only one so far, metrics.
With metrics, we were able to see how they are stored, including how you can add interesting information, like tags, to them.
We've also seen how they can be trended over time to see how things change.
But the only reason we're talking about telemetry at all is because we're interested in investigating new behaviors in our system.
That investigation lifecycle looks a bit like this.
You need to identify that there is something you want to look into, you need to start investigating and triaging that issue, then introduce a fix and monitor that fix for long-term success.
Metrics are great at doing identification.
With the way that metrics trend over time, we can track changes, and therefore know if things have degraded over time.
But they tend to be less valuable as we move into investigation and fixing, though when we get back to monitoring in the long-term, it's cyclical, and metrics are support again.
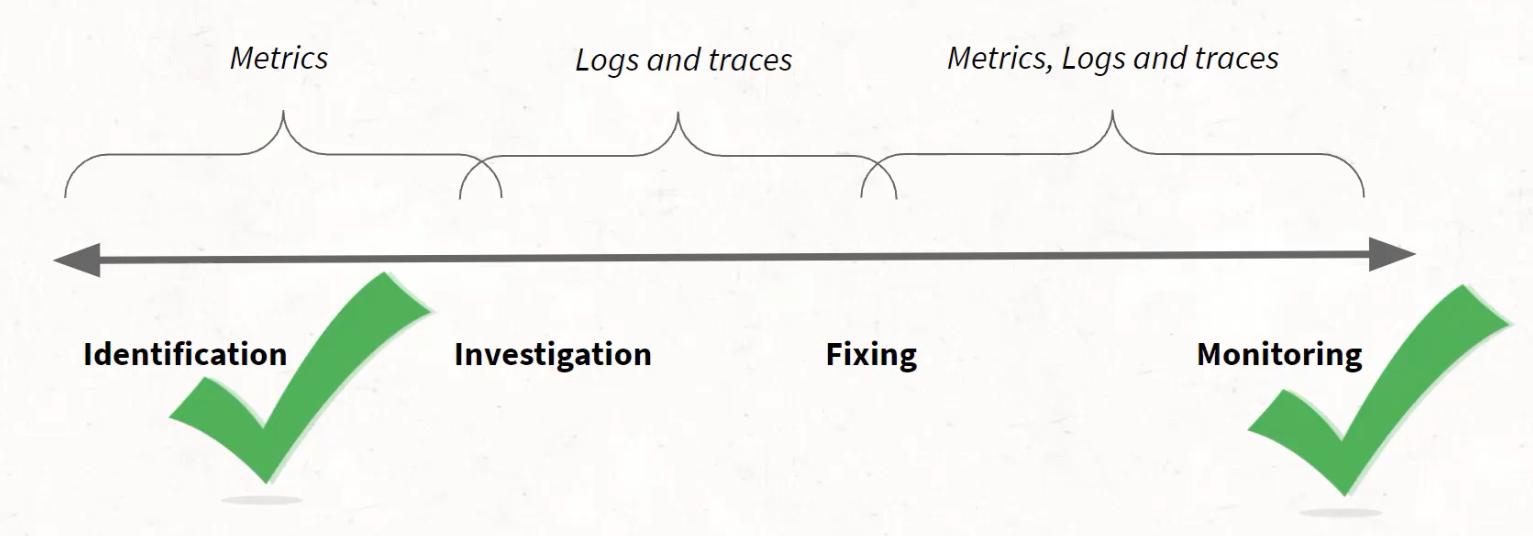
But it's this middle section - it's this investigation and fixing section - that we are unable to support with pure metrics.
In an ideal world, the telemetry that we would collect and store in our databases would be able to support the entire lifecycle, rather than us needing to subdivide this lifecycle across different databases with different data.
Needing to subdivide means that I not only need to pay for storage across these different types of data, but I also need to have the awareness of what to store where and how to jump between these phases.
There are two main reasons why metrics can't support investigation and fixing as much as we may like.
**The first is that cost of high cardinality. **
The sheer shape of the database means that we cannot put high cardinality data in without thought.
The issue is that high cardinality data is the data that can help us solve problems.
It is the data that can help identify that only certain customers are impacted or certain parts of the world or certain devices.
The devil's in the details when it comes to investigating complex systems, and unfortunately metrics cannot support that kind of detail.
**The other big reason is because of the way that the configuration works. **
These point in time scrapes, no matter how quickly they happen, will have some sort of bucketed data.
Here is a picture of a highlight from two different parts of the same graph.
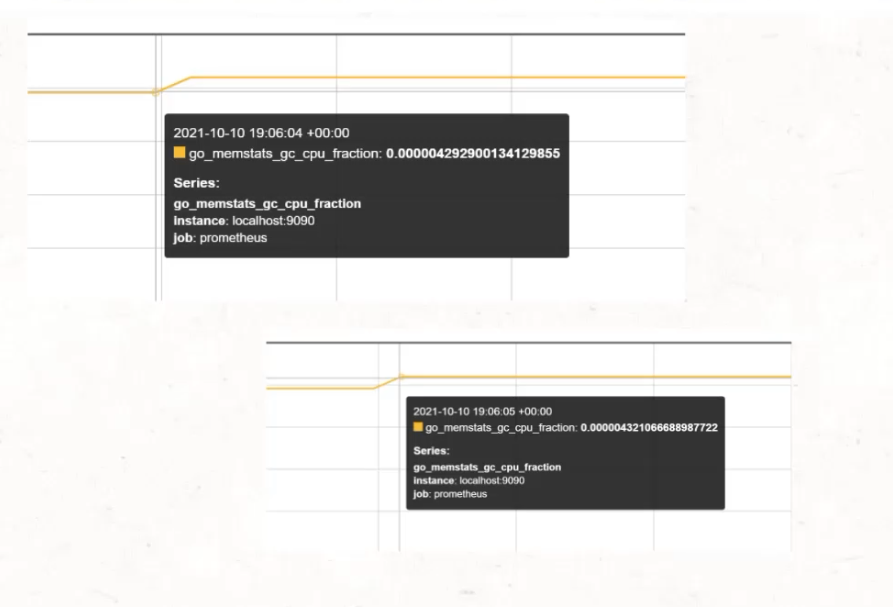
These lines are exactly one measurement apart.
You can see that the first happened at 19:06:04 and the second happened at 19:06:05.
But the thing is, they aren't actually a second apart - this is just the second where the scrape identified a difference.
Metrics are actually bucketed information.
We can only know what the value is at that moment in time and not the details inside of it.
It's what we call pre-aggregated data, and it's similar to trying to capture snowflakes in a bucket.
Snowflakes are all unique and interesting, just like the data about our users.
But, as soon as you collect that snowflake on the ground or into a snowball or into a bucket, it becomes snow. \
You can never re-divide that snow into individual flakes.
The same thing goes for metric data.
Because this data is pre-aggregated and is collected at only certain intervals, we can never understand the intricacies between those intervals.
What happened to change the CPU fraction between scrapes?
Do we know if at any point during that 15 seconds between scrapes, that that number was either much higher or much lower than what is reported?
We don't, and we can't with the way that metrics work.
As a final recap, we know that metrics are great for the ability to trend over time and do quick math, but their drawbacks mean that we're unable to delve into the details of what those numbers really mean, and we can't connect these numbers with real experiences by our users.
In particular, the inability to have high cardinality data means that we need to be very particular with what we collect in metrics, and that means that we often wish that we had data that we don't have at the time that we need it.
This may all feel like a fairytale, the information that we feel like we're missing, but stick around and have a look at what events can offer in the next chapter.
