

Transcripted Summary
So far, we've identified a whole host of things that we may want to extract from our pipeline and be able to graph and to query in interesting ways.
The first step was to generate a build duration that we can send to these tools.
Next, we want to tackle a few more of the interesting data types.
In specific, we're going to extract out the counts of how many tests ran, failed, errored, and skipped.
To do this, I have generated a small bash script that starts by just printing these values.
Bash is a really useful language, as it can be run on just about any server, but it's not the easiest to test or to generate readable code with.
If you know other scripting languages, you can feel free to generate this script in your own way.
If not, I would suggest that you copy the script I've written via the link listed below, and we're going to take a moment to look through what it does before you go and try and run it.
As we go through the script, I think it would be best to be able to show you the commands live.
In order to do that, I've opened up Docker Desktop again, and I'm going to run another container that is Ubuntu.
So, I'm once again going to go to the "Images" tab in Docker Desktop, go to the Ubuntu image, and click "Run".
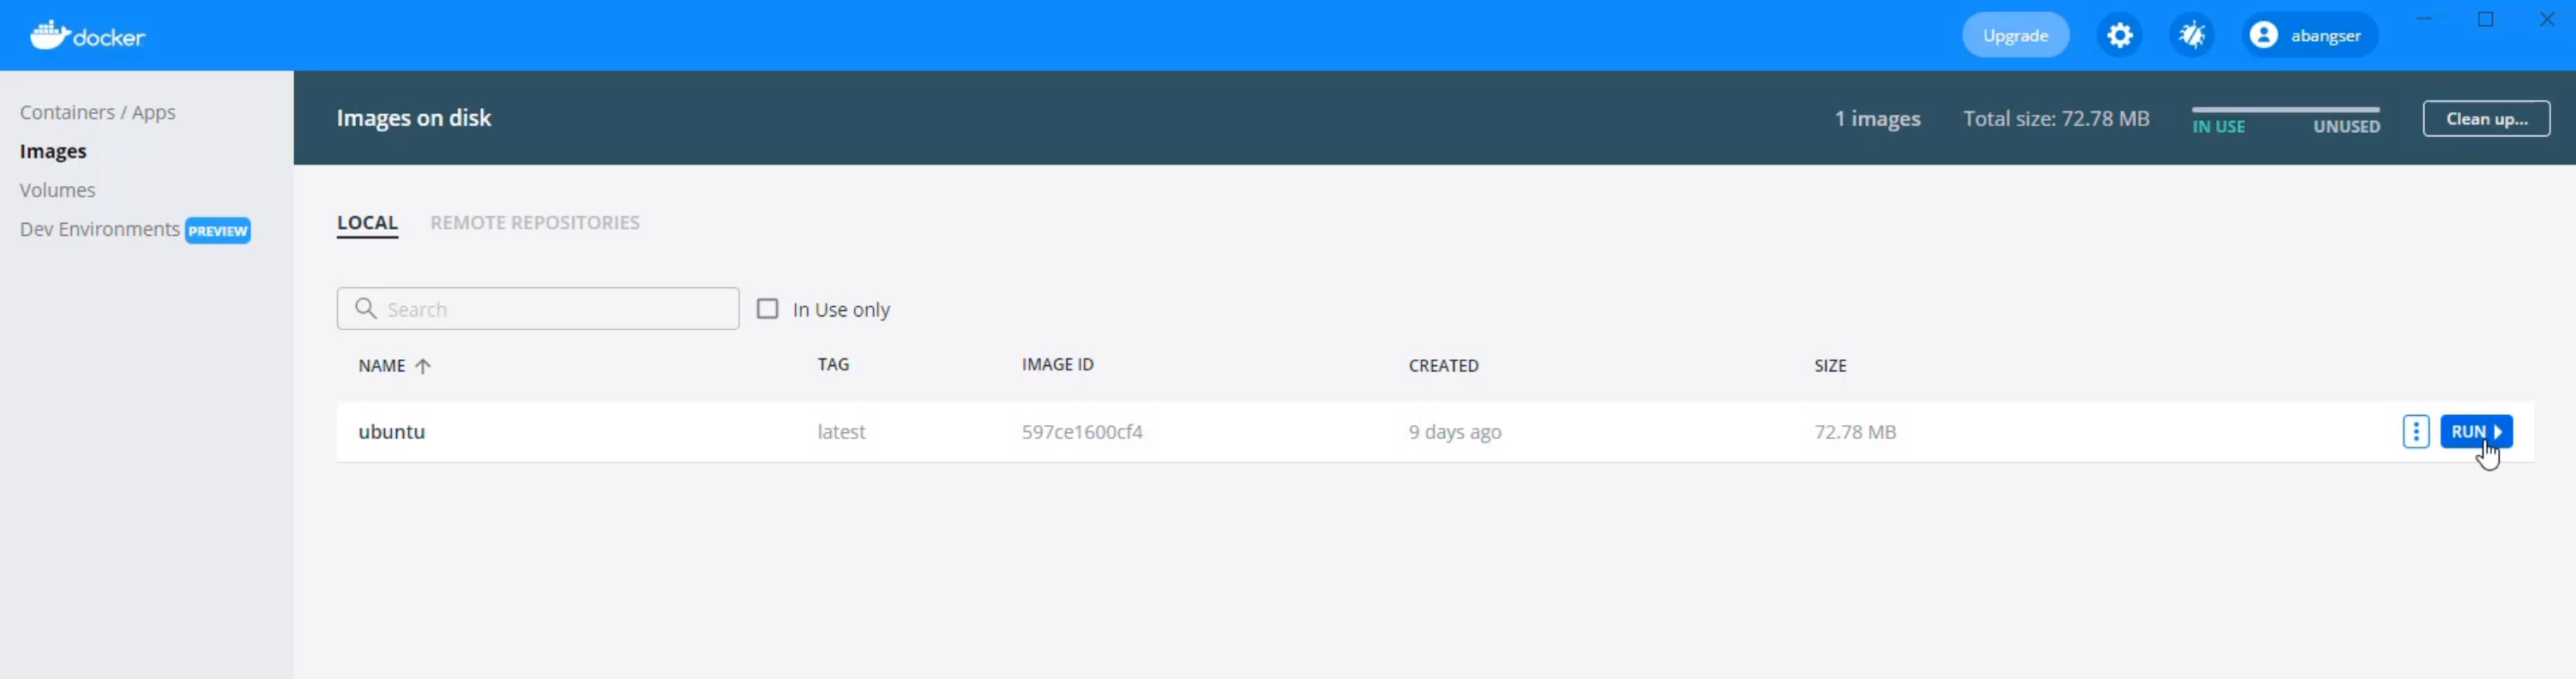
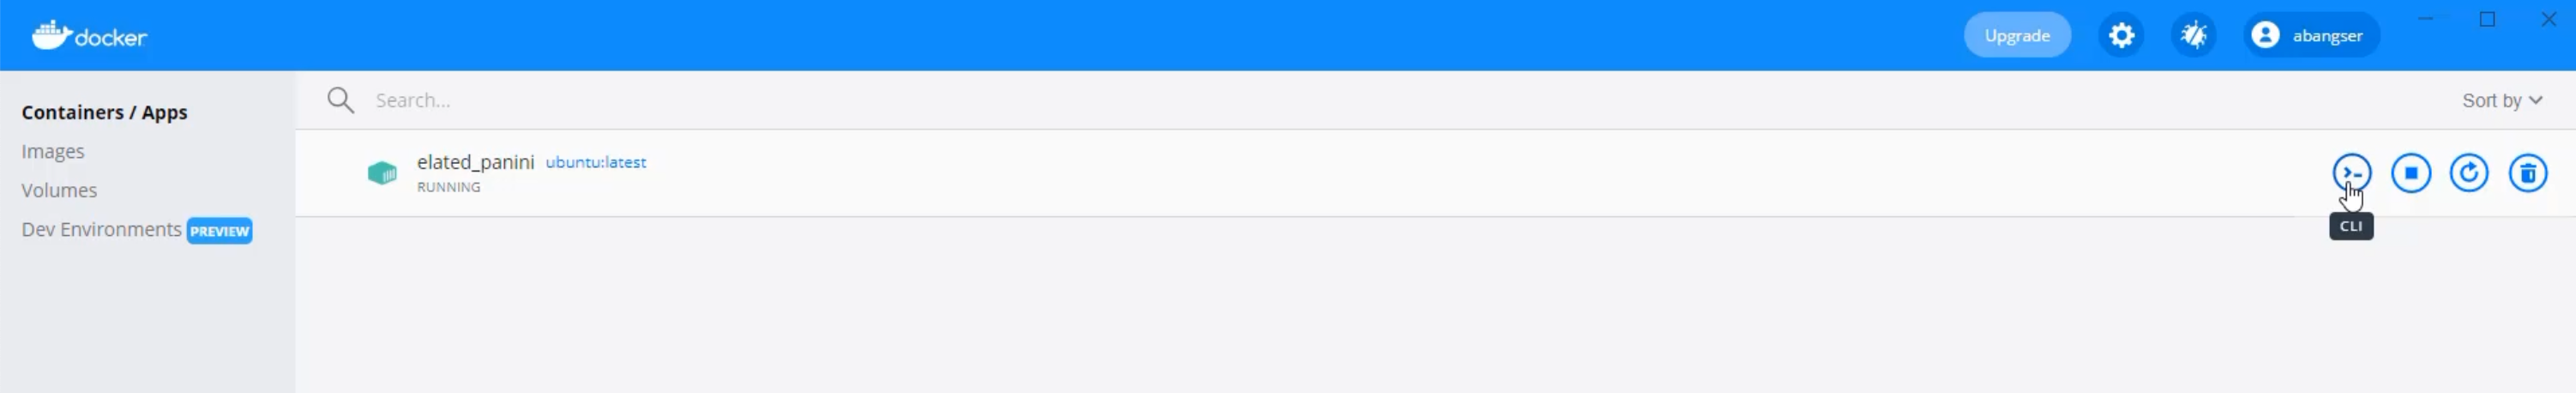
Once that begins running, I'll be able to click on the CLI and open that up in order to run these commands as if I was on the continuous integration server.
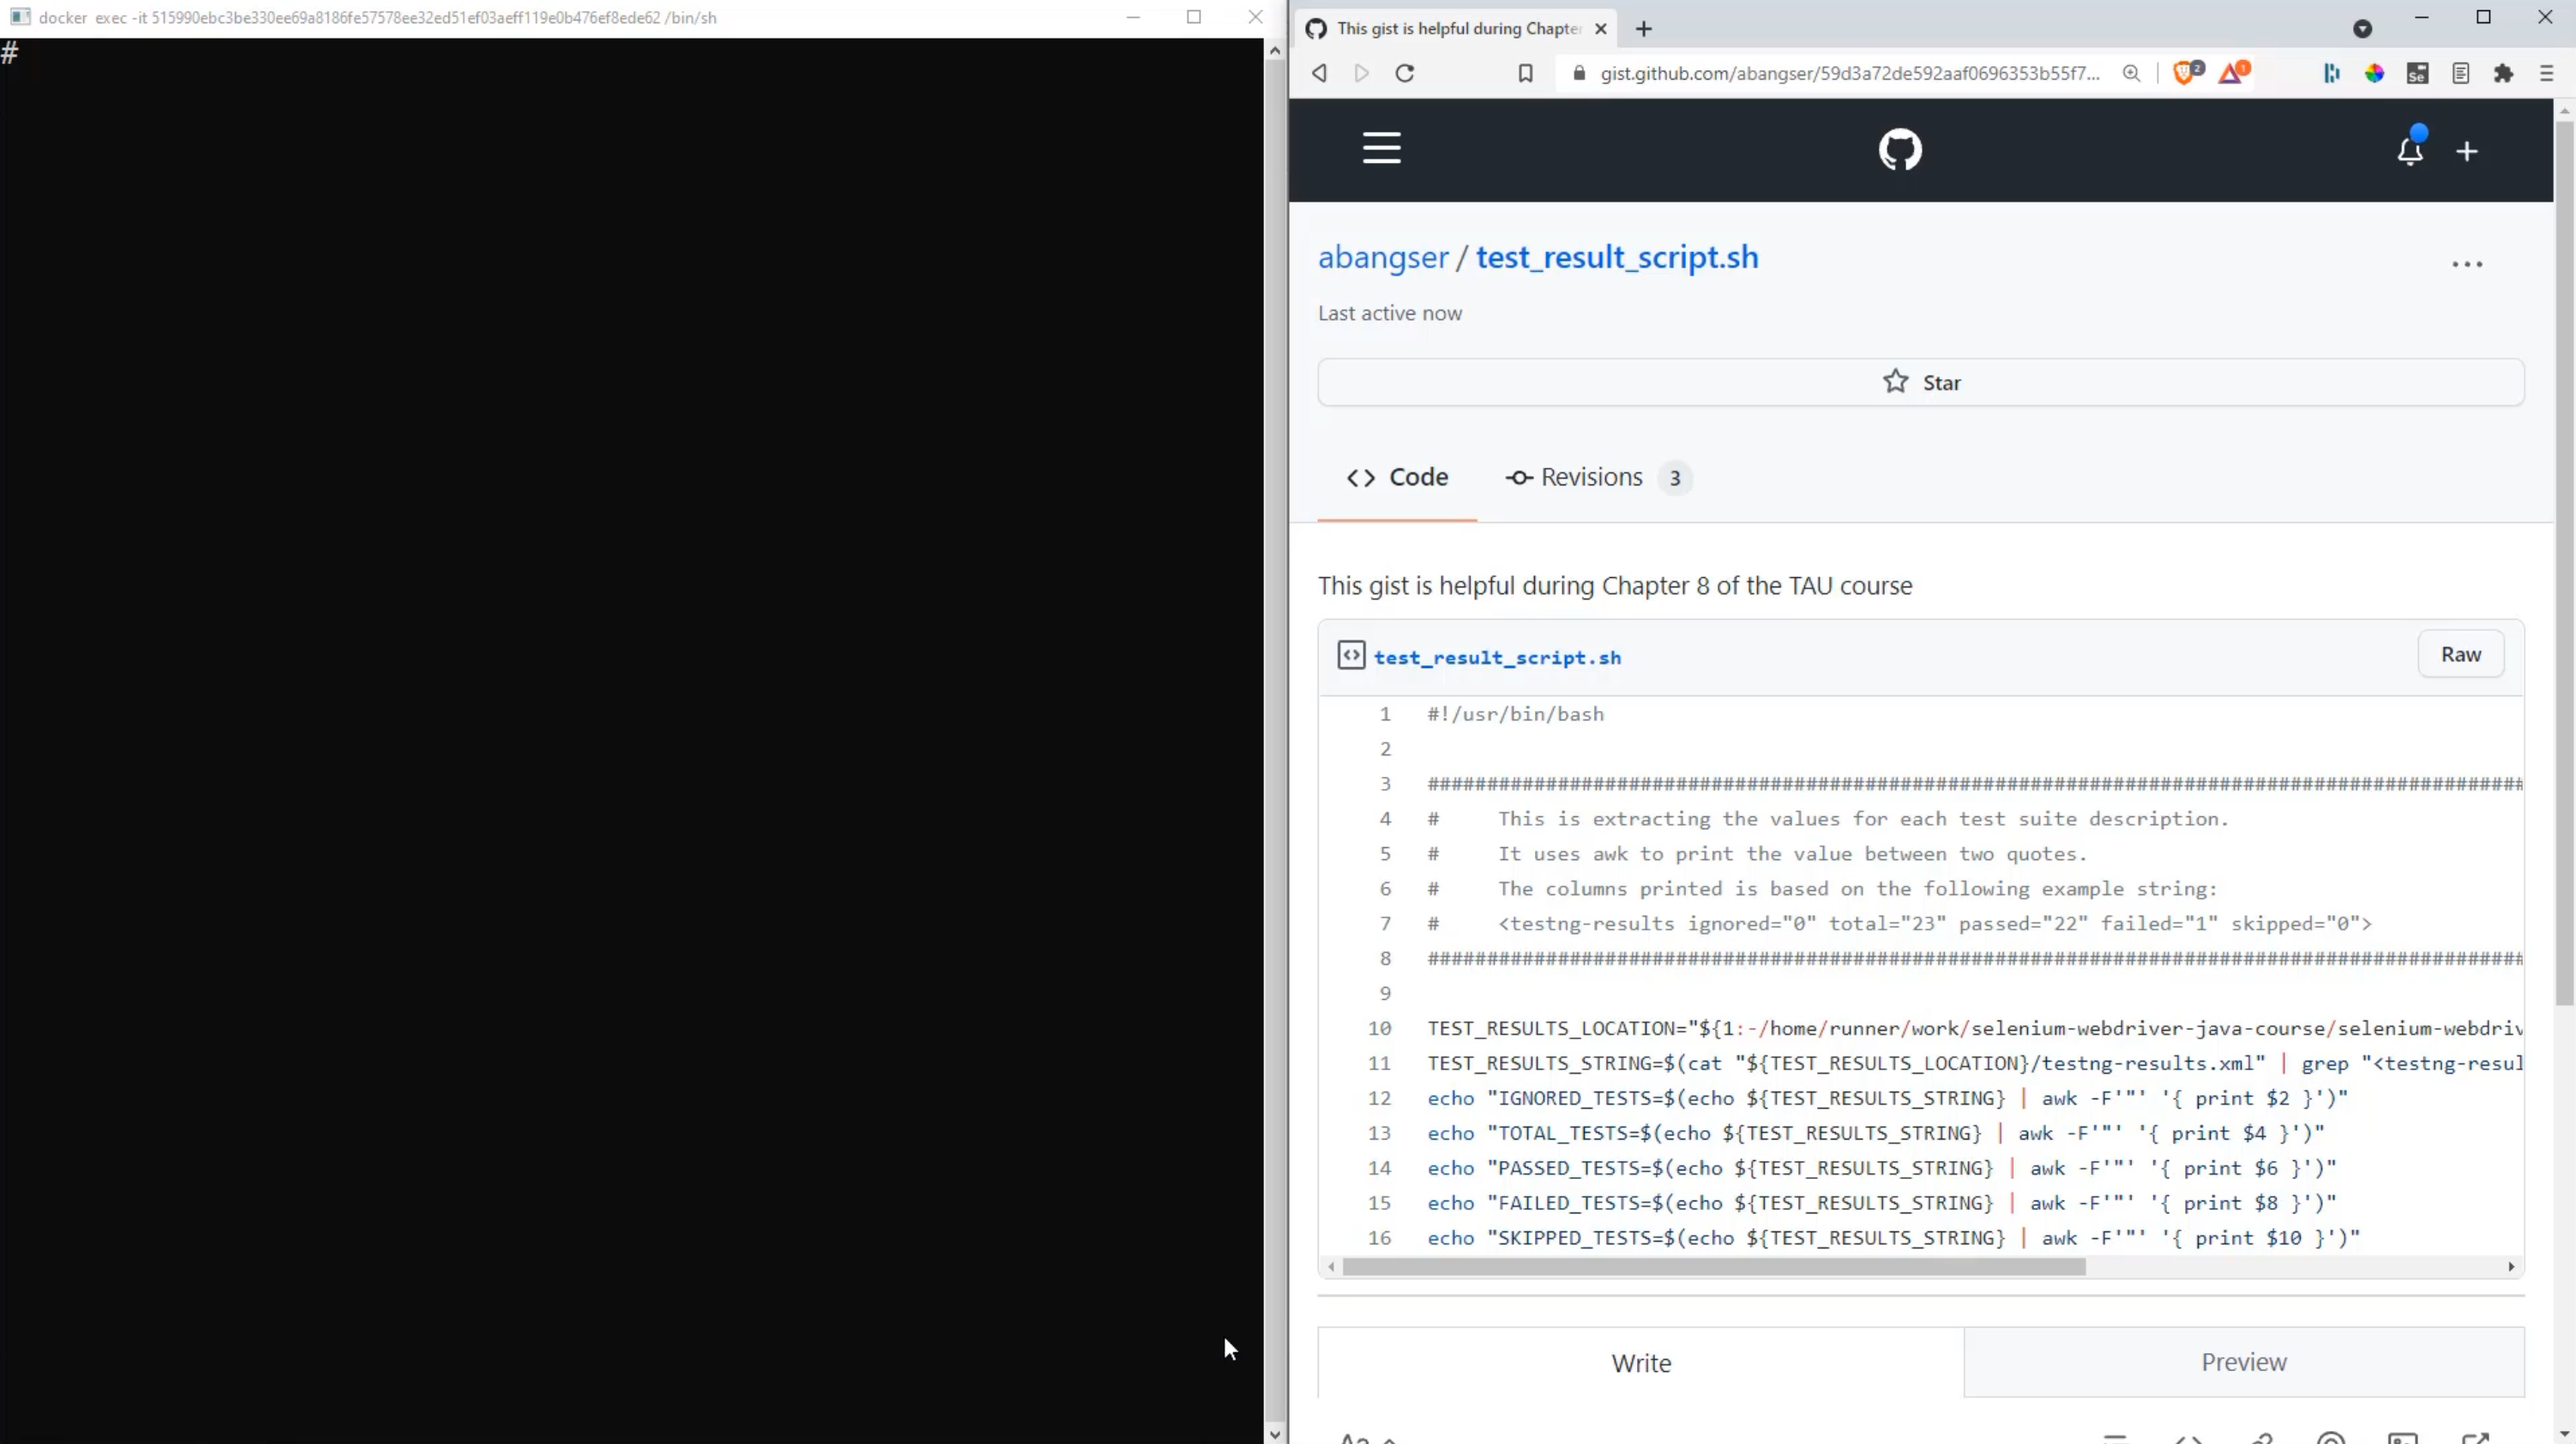
Here I am in my terminal, and I've actually brought up the gist, or the script, on the right hand side, so that I can read through the script and look at the terminal at the same time.
Let's start with the script.
First lines first - we start with a comment, but this is a special comment, because it has a bang !, or exclamation point, directly following the pound sign #.
What this does is it tells the computer what type of interpreter to use for this script.
We are writing a bash script, so this is the interpreter I'm using.
You will see this with all types of scripting, though, so for example, you might see this in Python scripts or Ruby scripts as well.
Then we continue on, and the rest of these lines at the top here through to line eight are also just for help; they're comments.
This comment will come in handy in just a minute, but in general, what we try to do with bash scripting when it's not easy to read, is we try and give some context as to what's going on and why.
But now let's get into the meat of the script.
The first thing that we're really doing here is we're trying to say, "where are our test results going to be located?"
I can go find those in my local codebase.
Let's pop over to IntelliJ, and check it out.
Here I am in IntelliJ, and if you remember way back earlier in the course after running tests, we were told that the test results would be under the target directory.
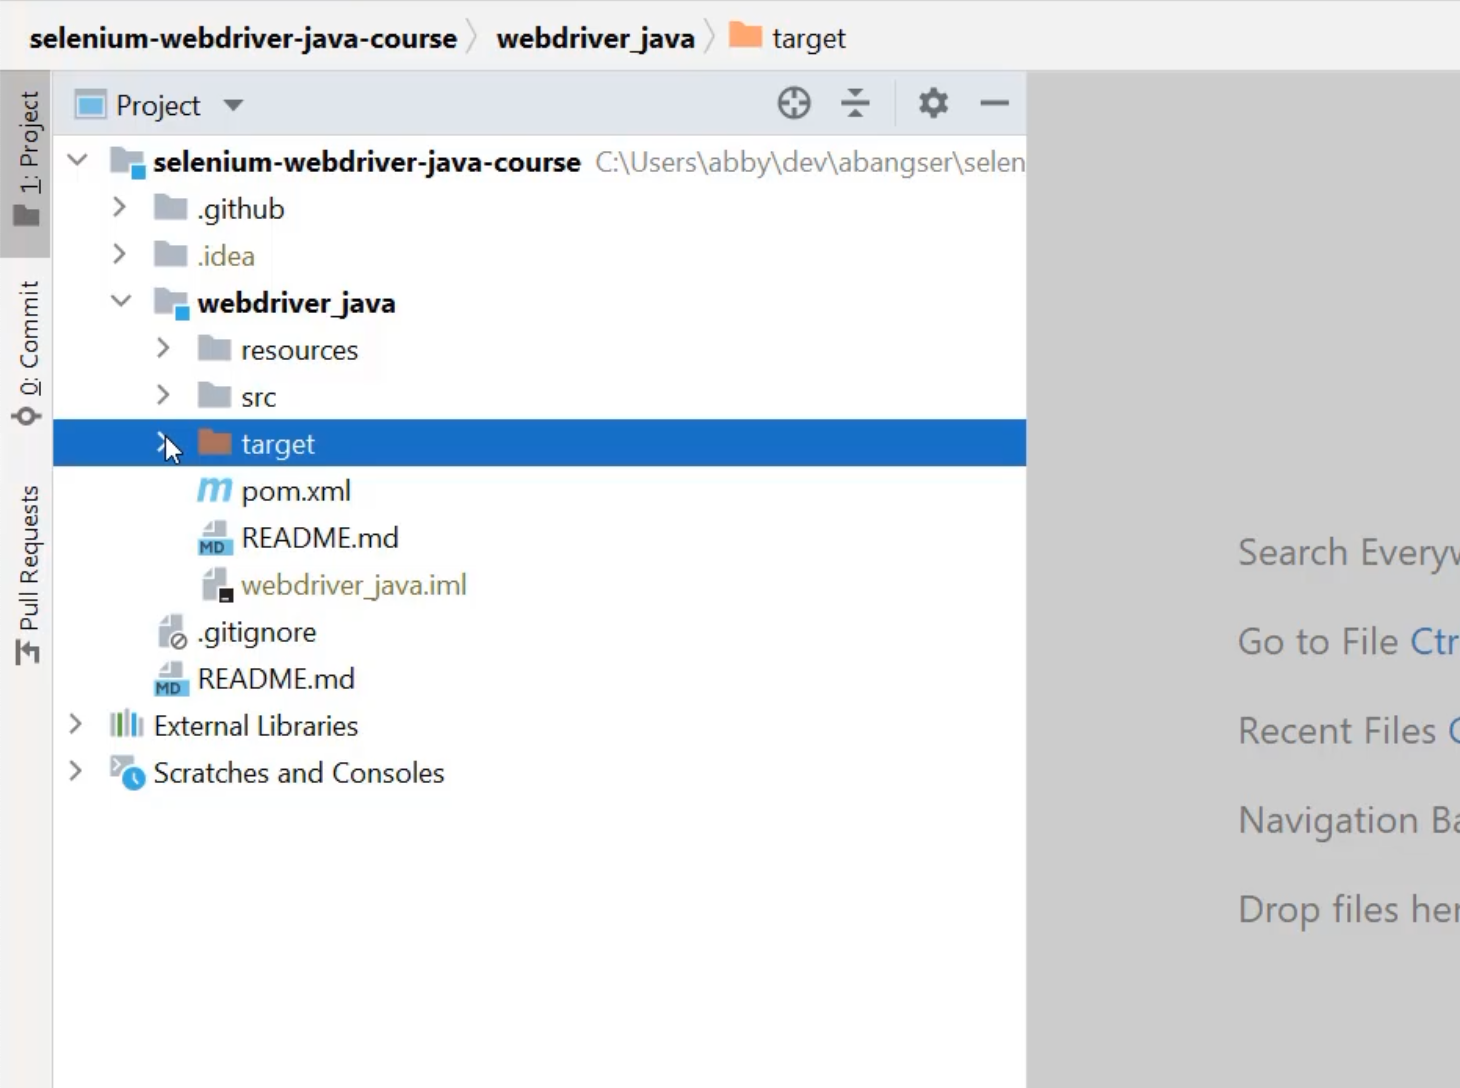
This target directory is a different color, because it's known to be a directory that gets generated, rather than one which needs to be checked into codebases.
Each time we build or run tests, a new target directory is created.
When I open this, I can see the compiled Java sources and more specifically, I can see the surefire-reports, and Surefire is our test runner.
Within here, I can see a couple of different formats for the reports, but the one I'm most interested in is testng-results.xml, because in here, I can see right here on line 2, all of the test result counts and available for me to extract.
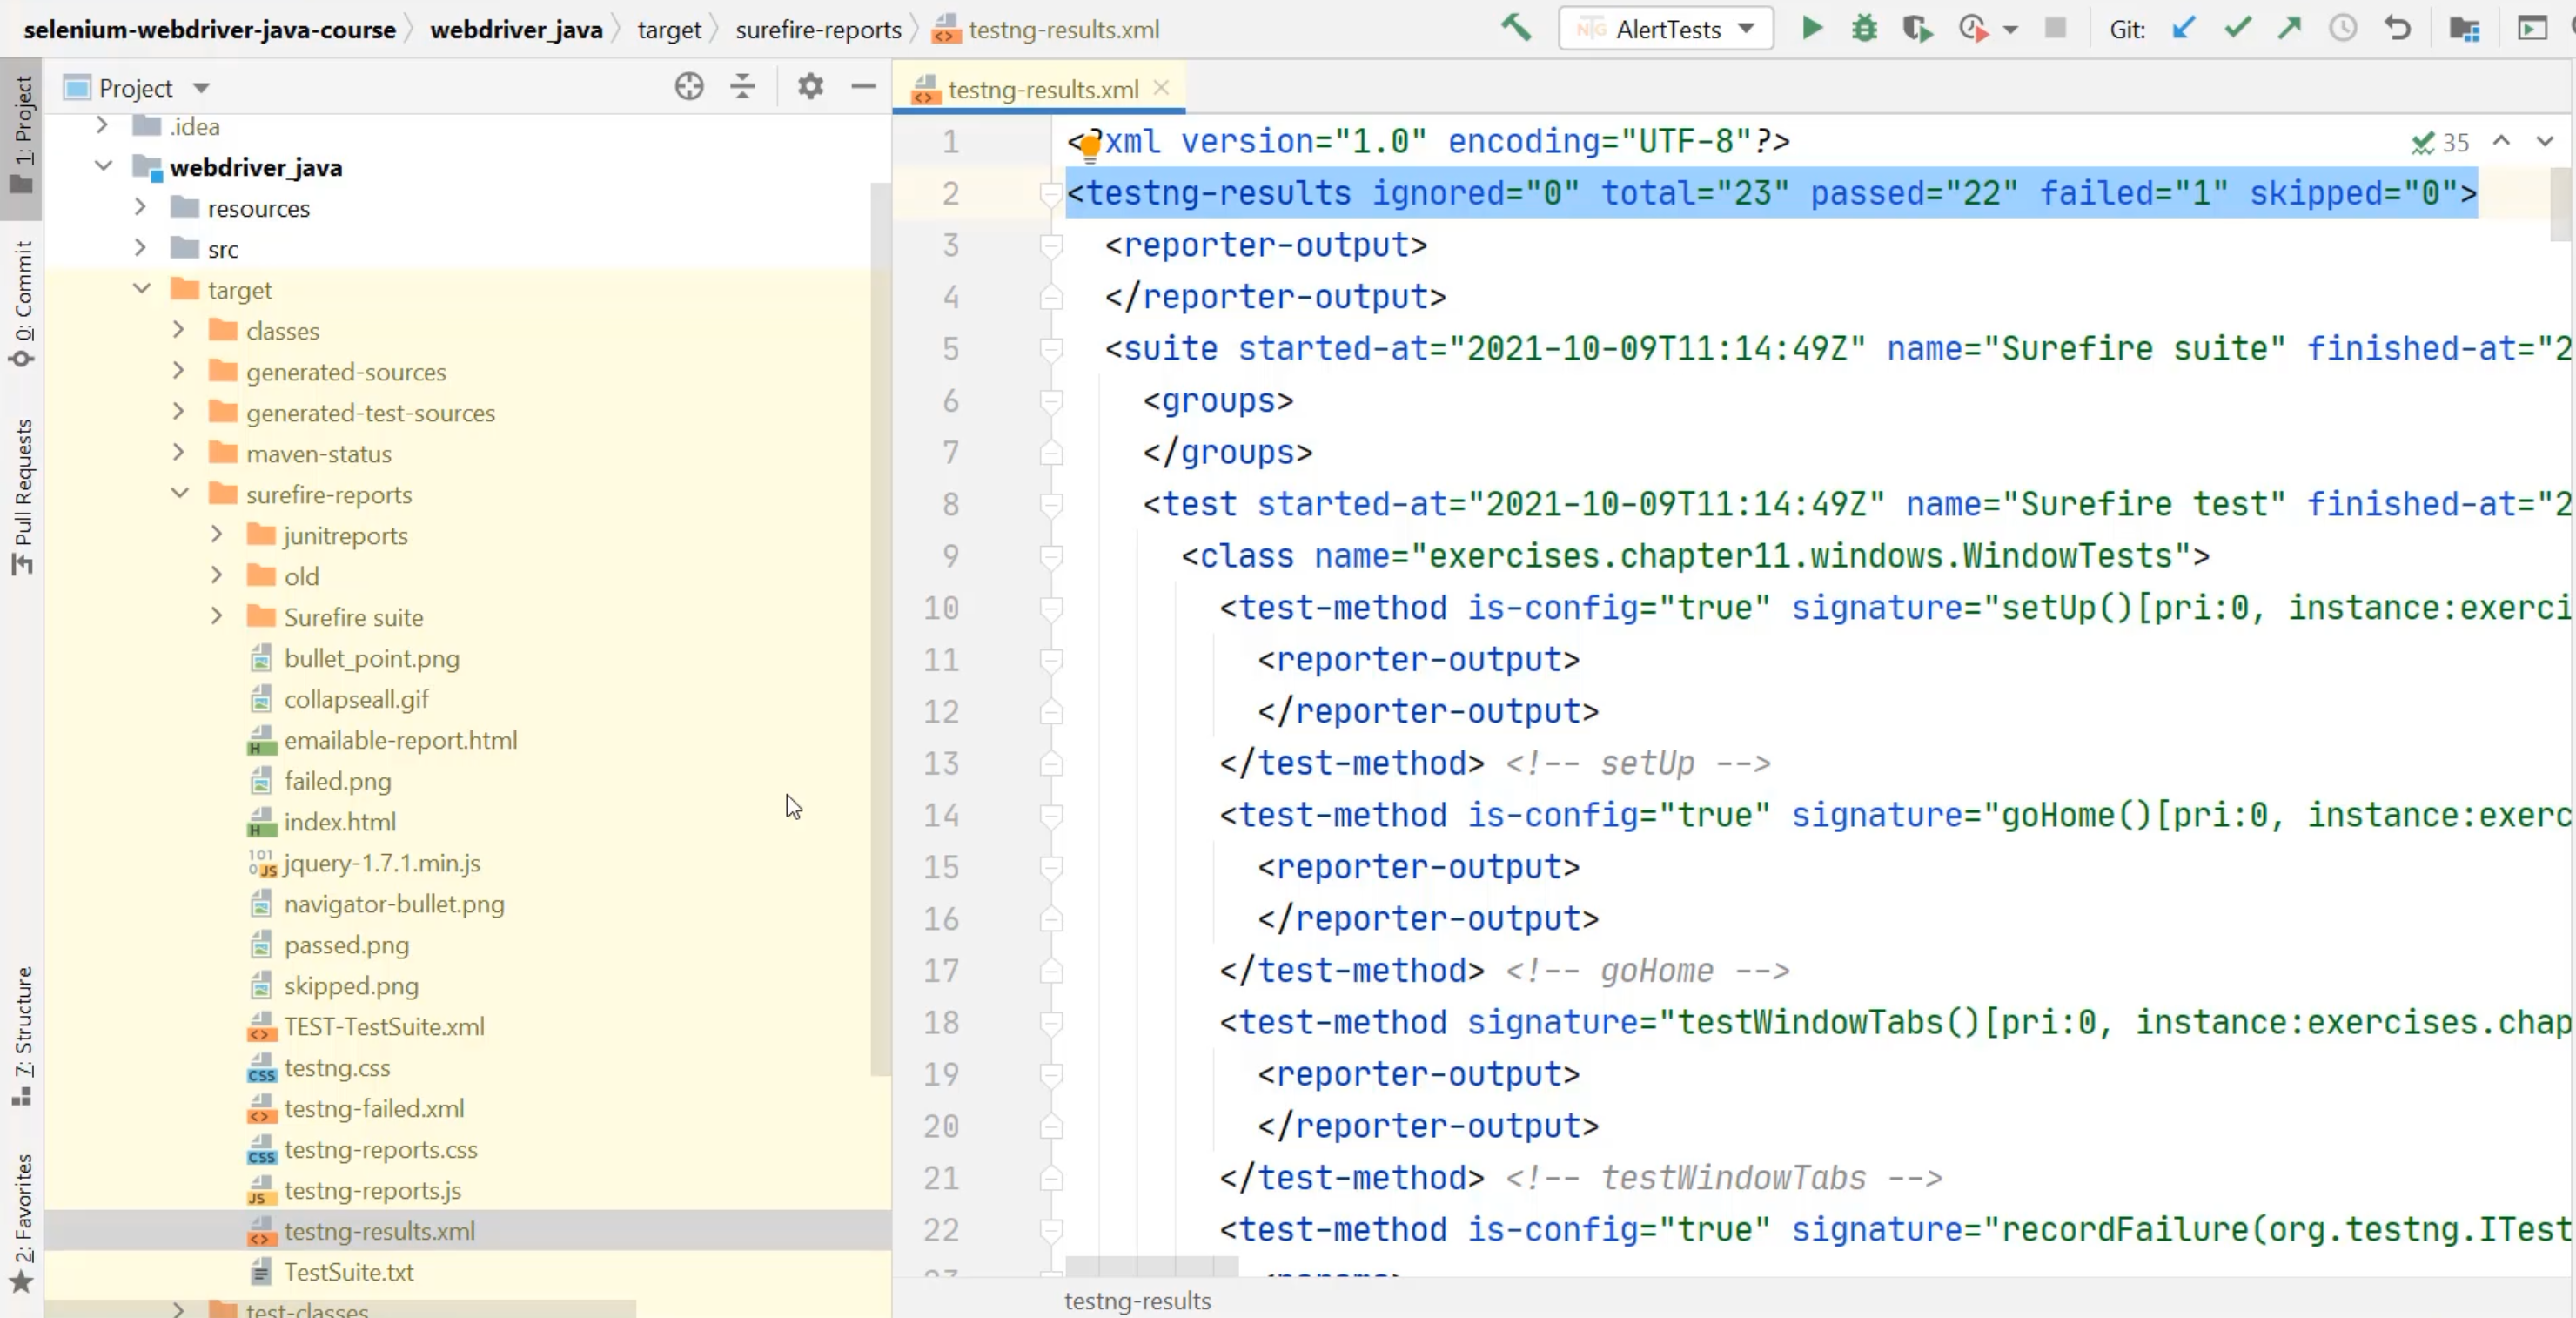
If I look at where this is located, it's located in the selenium-webdriver-java-course, inside the webdriver_java, target, surefire-reports, and then the name of the file.
Let's return back to the script and see how I do that there.
Here, I'm using a different syntax where I have this 1: first.
Then, I have this information that starts with a very different location - home/runner/work - but I can see that it's matching my selenium-webdriver-java-course/webdriver_java/target/surefire-reports.
So what's going on?
Well, this is an example of how we can keep this script flexible.
These first couple characters are saying that you can feed a parameter into the script and use that as the location of the file - this allows us to run this from anywhere.
We just need to pass in the location of the test file we want to run the script against.
But, we want to prioritize being able to run this on our continuous integration server.
So, what we've done is we've made the location on that server as the default location, if you don't pass in any parameters.
In the end, this variable TEST_RESULTS_LOCATION will be the location of a folder where the file will be located.
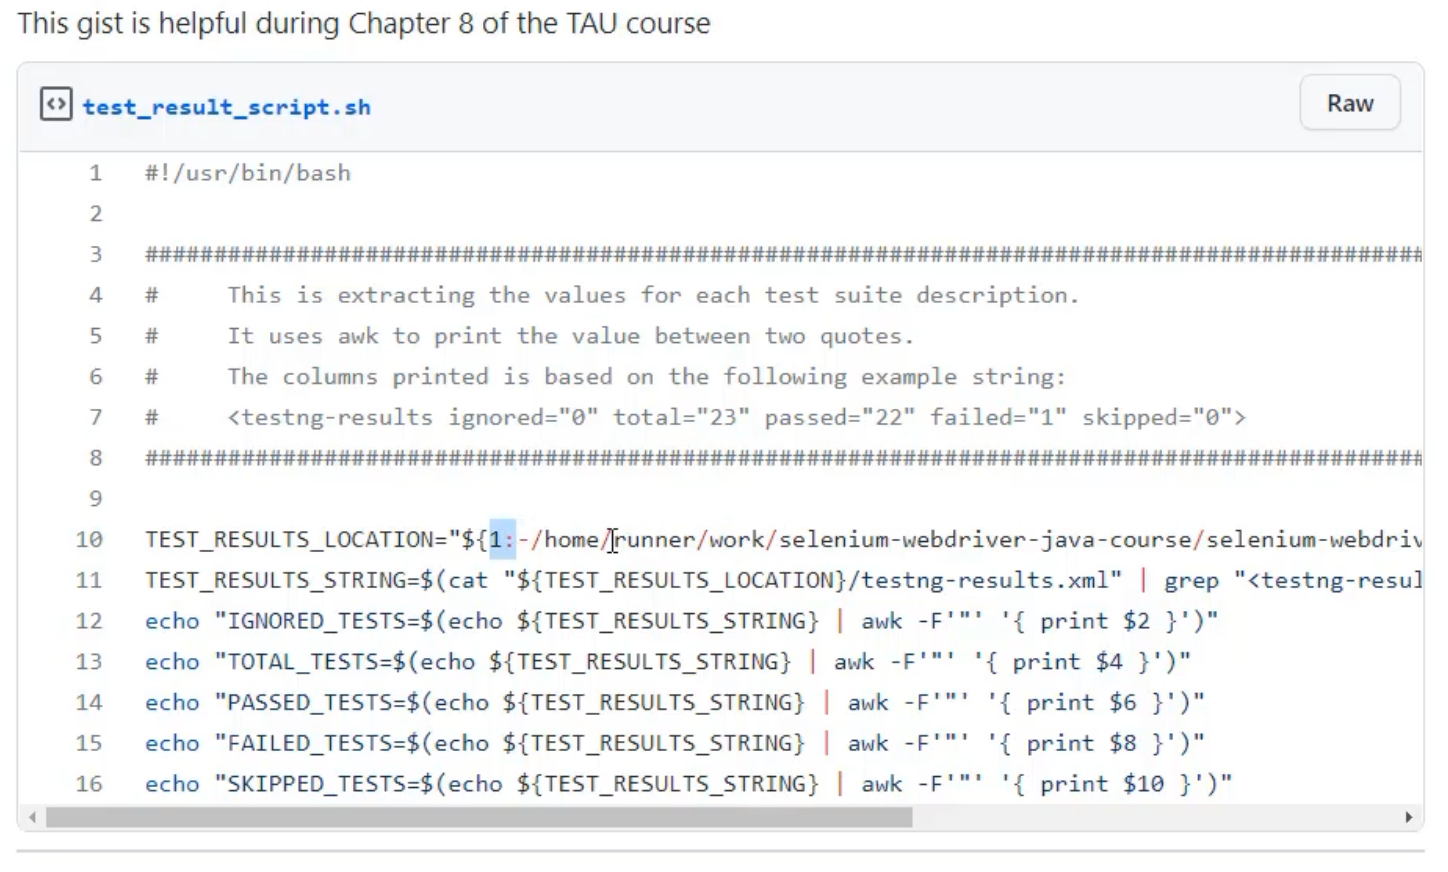
TEST_RESULTS_LOCATION="${1:-/home/runner/work/selenium-webdriver-java-course/selenium-webdriver-java-course/webdriver_java/target/surefire-reports}"
We then want to get the TEST_RESULTS_STRING, meaning that second line in the file.
TEST_RESULTS_STRING=$(cat "${TEST_RESULTS_LOCATION}/testng-results.xml" | grep "<testng-results")
The way we do that is we read the entire contents of the file into memory.
So this is using a command called cat, or concatenate, in order to read all of those values.
We then use the pipe | command in order to pass the output of that to a grep command, and grep is a way of searching.
What we're doing is we're searching for the beginning of that string - testng-results.
When that gets found, it's going to end up printing the entire line that is found, and that's going to get stored into TEST_RESULTS_STRING. \
This is where that comment comes in handy, because I don't want to have to read in the value of a file right now - it's just a little bit of extra work for what we're trying to achieve.
So I'm just going to copy this value here, and I'm going to save it directly into a variable by myself.
I'm going to say TEST_RESULTS_STRING, and I'm going to save it inside of single quotes because there's some double quotes in that string, and I don't want those to go away.
TEST_RESULTS_STRING='<testng-results ignored="0" total="23" passed="22" failed="1" skipped="0">'
Now, I have a variable called TEST_RESULTS_STRING, and I can print that variable using the command, echo.
echo $TEST_RESULTS_STRING
That's a lot cheaper than trying to print out the entire 700-line file.
We're going to now use this string a few times in order to take out all the different values we care about.
That's what lines 12 through 16 are doing.
echo "IGNORED_TESTS=$(echo ${TEST_RESULTS_STRING} | awk -F'"' '{ print $2 }')"
echo "TOTAL_TESTS=$(echo ${TEST_RESULTS_STRING} | awk -F'"' '{ print $4 }')"
echo "PASSED_TESTS=$(echo ${TEST_RESULTS_STRING} | awk -F'"' '{ print $6 }')"
echo "FAILED_TESTS=$(echo ${TEST_RESULTS_STRING} | awk -F'"' '{ print $8 }')"
echo "SKIPPED_TESTS=$(echo ${TEST_RESULTS_STRING} | awk -F'"' '{ print $10 }')"
What these are doing is they are saying that they want to print out the output of this string, and this string is saying, the name of the variable it's trying to print (ex. IGNORED_TESTS``) , equals, and then the value of the count that they're trying to print (ex. $(echo ${TEST_RESULTS_STRING} | awk -F'"' '{ print $2 }')).
To get this count value, what we're doing is we're taking the string that we've just saved into the variable, and we're sending it to a command called awk.
awk allows us to manipulate strings by splitting them on characters, by cutting them apart, and piecing them back together again.
In this case, what we're doing is we're doing a delimiter of the double quote ", and we're asking to print only one part of the output.
What this is going to do is on every single double quote ", you can think of it as treating it as a new string.
The bits before the first double quote (ex. <testng-results ignored=) would be one string, the second string would be the bits before the second quote (ex. 0), and so on.
You can see a pattern here, where the even numbers, the two, the four, the six, the eight, and the 10 are the values between the quotes.
What we'll do now, is we can take this - we've already seen how echo works - and we're going to see how awk works now.
I'm going to copy this, and I'm going to just run a very simple awk command, just to print the full and complete line.
echo ${TEST_RESULTS_STRING} | awk '{print $0}'
$0 is all of the line, and I can do that.
So, this is saying, print the line so that I can print the line again - it doesn't provide us a lot of value.
Instead, what I want to do is I want to start to split this.
echo ${TEST_RESULTS_STRING} | awk -F '"' '{print $1}'
I can say awk -F, and I'm going to put the double quote " in single quotes ' to be able to clarify that I want to split on the double quote.
Now, I'm going to print the first output.

I can see all the bits before the first quote has come through.
If I want to print now the second bit - I'm going to copy this and use $2 - and I get the number 0.
That's how we're going to break down this long string to get the values we need out of it.
I'm going to now copy the complete command from the script, and I can see that there are zero ignored tests.
If I want to confirm that it's really doing this right, I can also run it for total tests - total tests is 23.
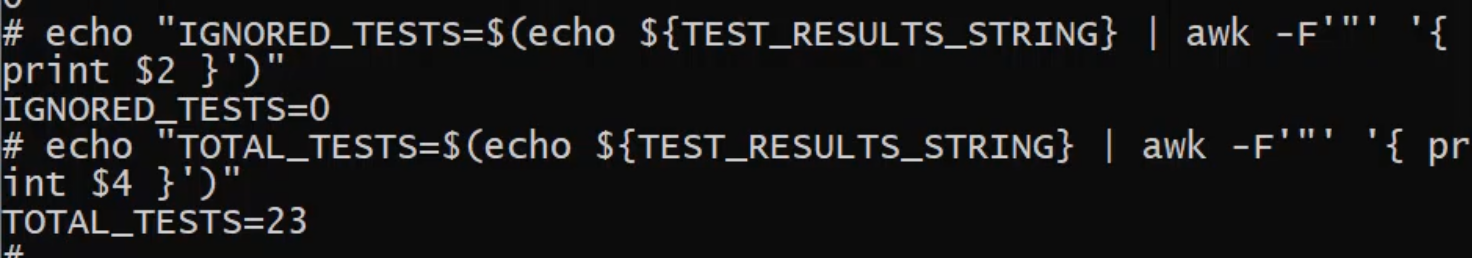
We now can extract out each of the values from this test count and print them to the screen, just like we did for the total duration of the pipeline.
I think it's time that we try and take this into our codebase.
I'm going to close out of this Docker container, and then shut the container down by clicking the trash sign. That way, I don't keep this running on my local computer.
Now let's get to the codebase.
With that open, I can again write my pseudo-code to be able to see what I want to achieve.
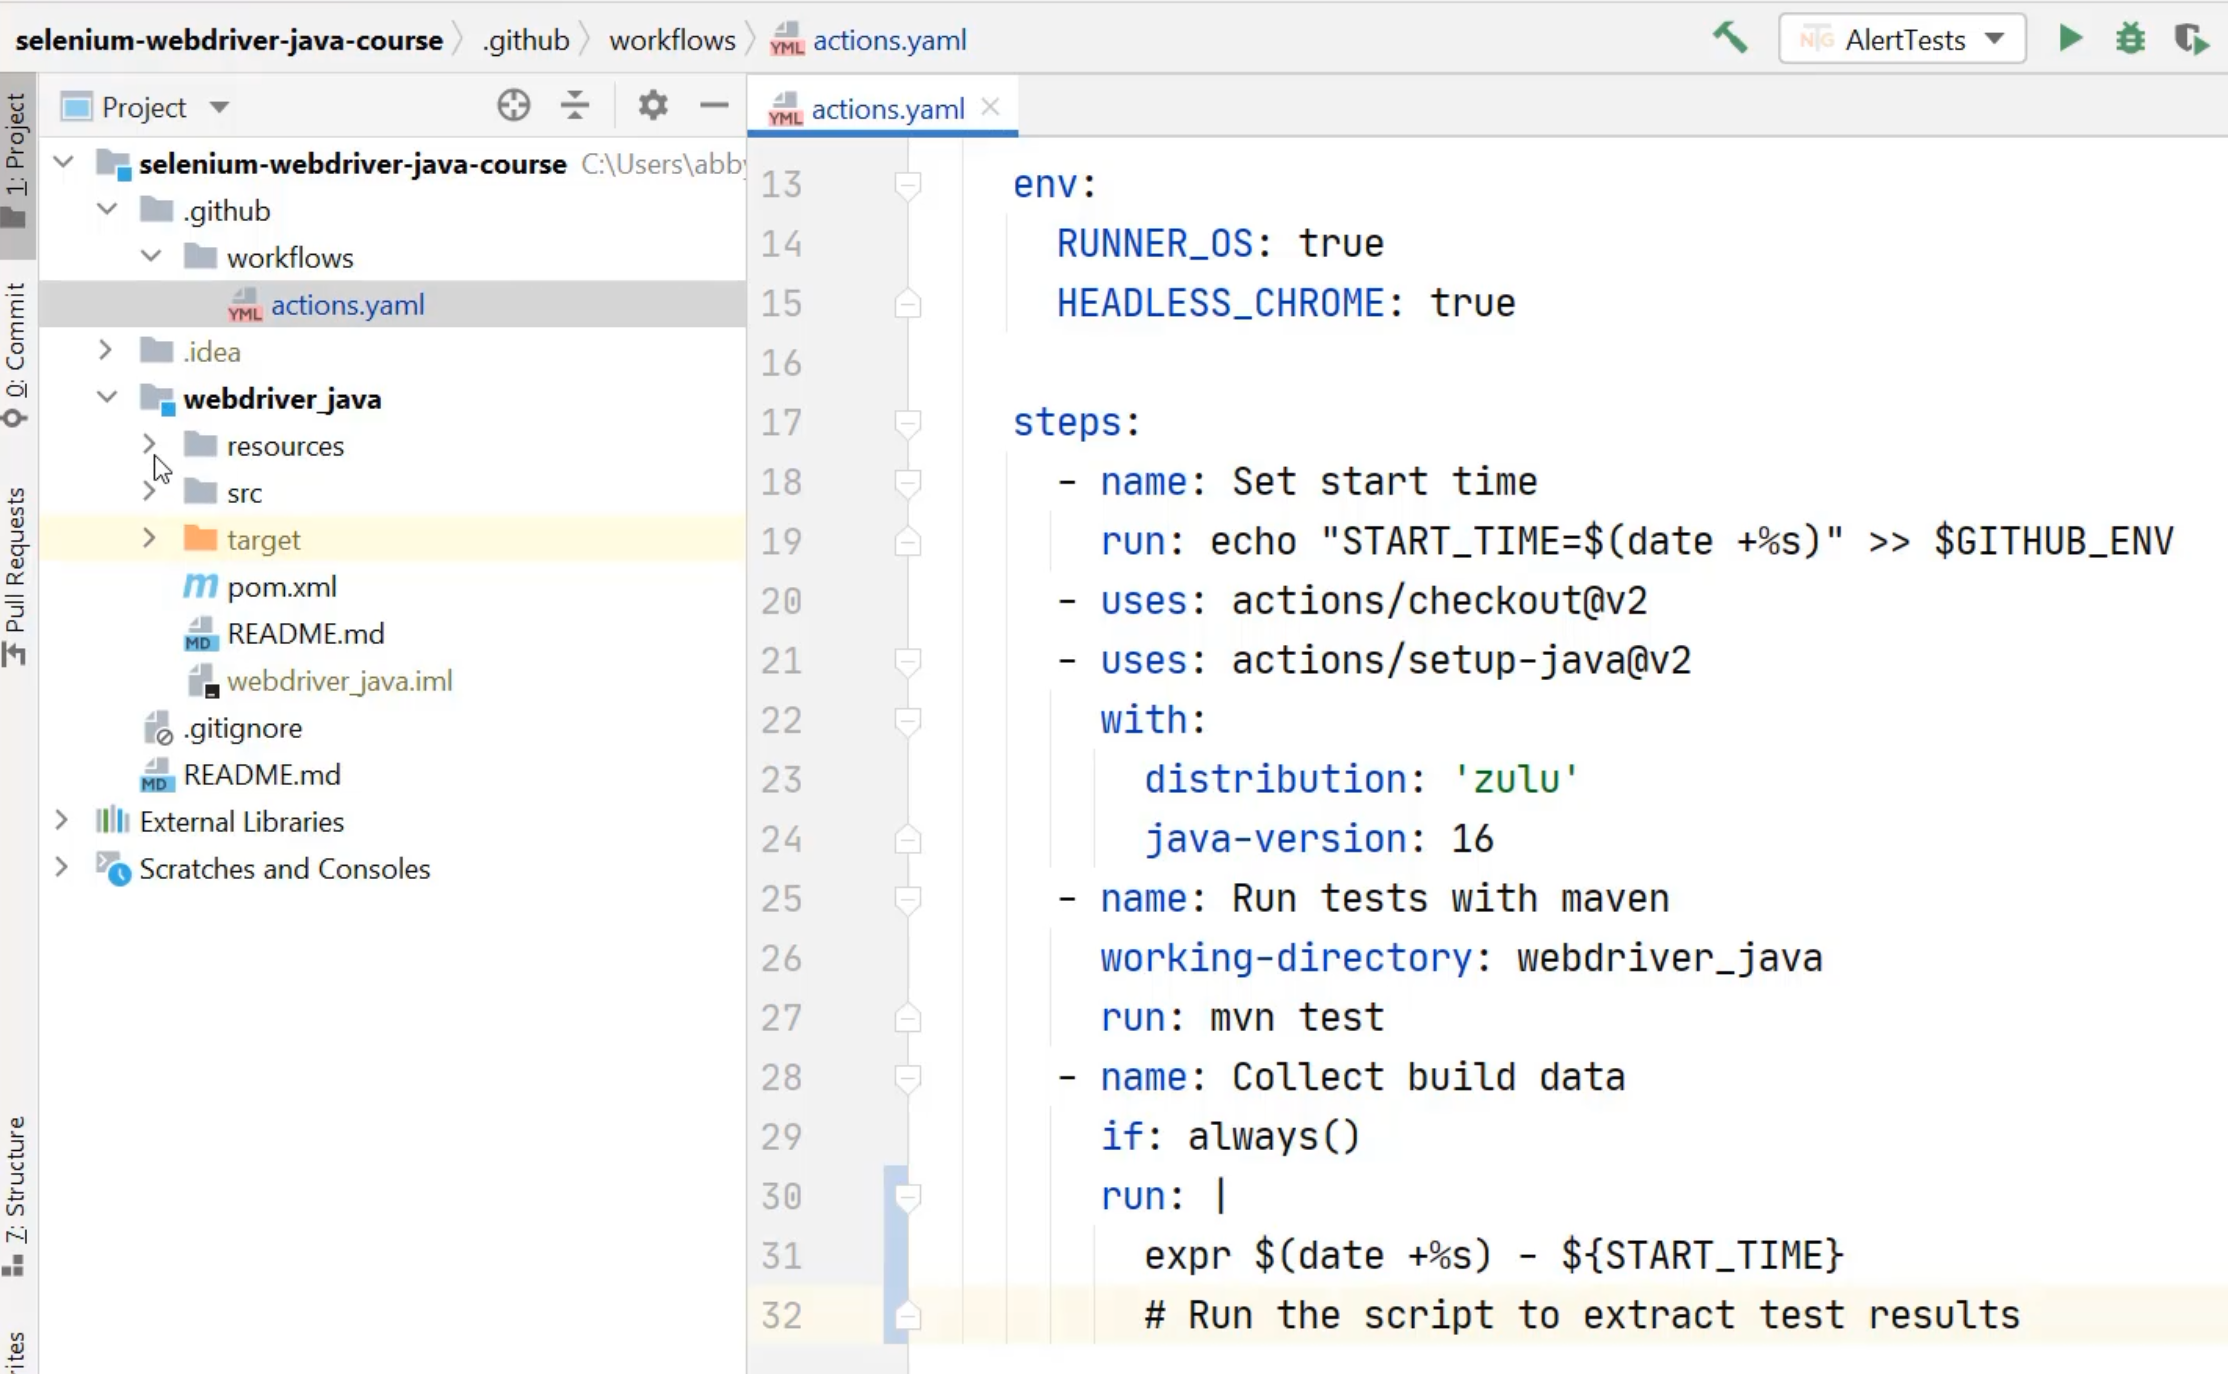
What I really want to do is add to this "Collect build data" step, but I already have a run command that is being run, so how do I add a second one?
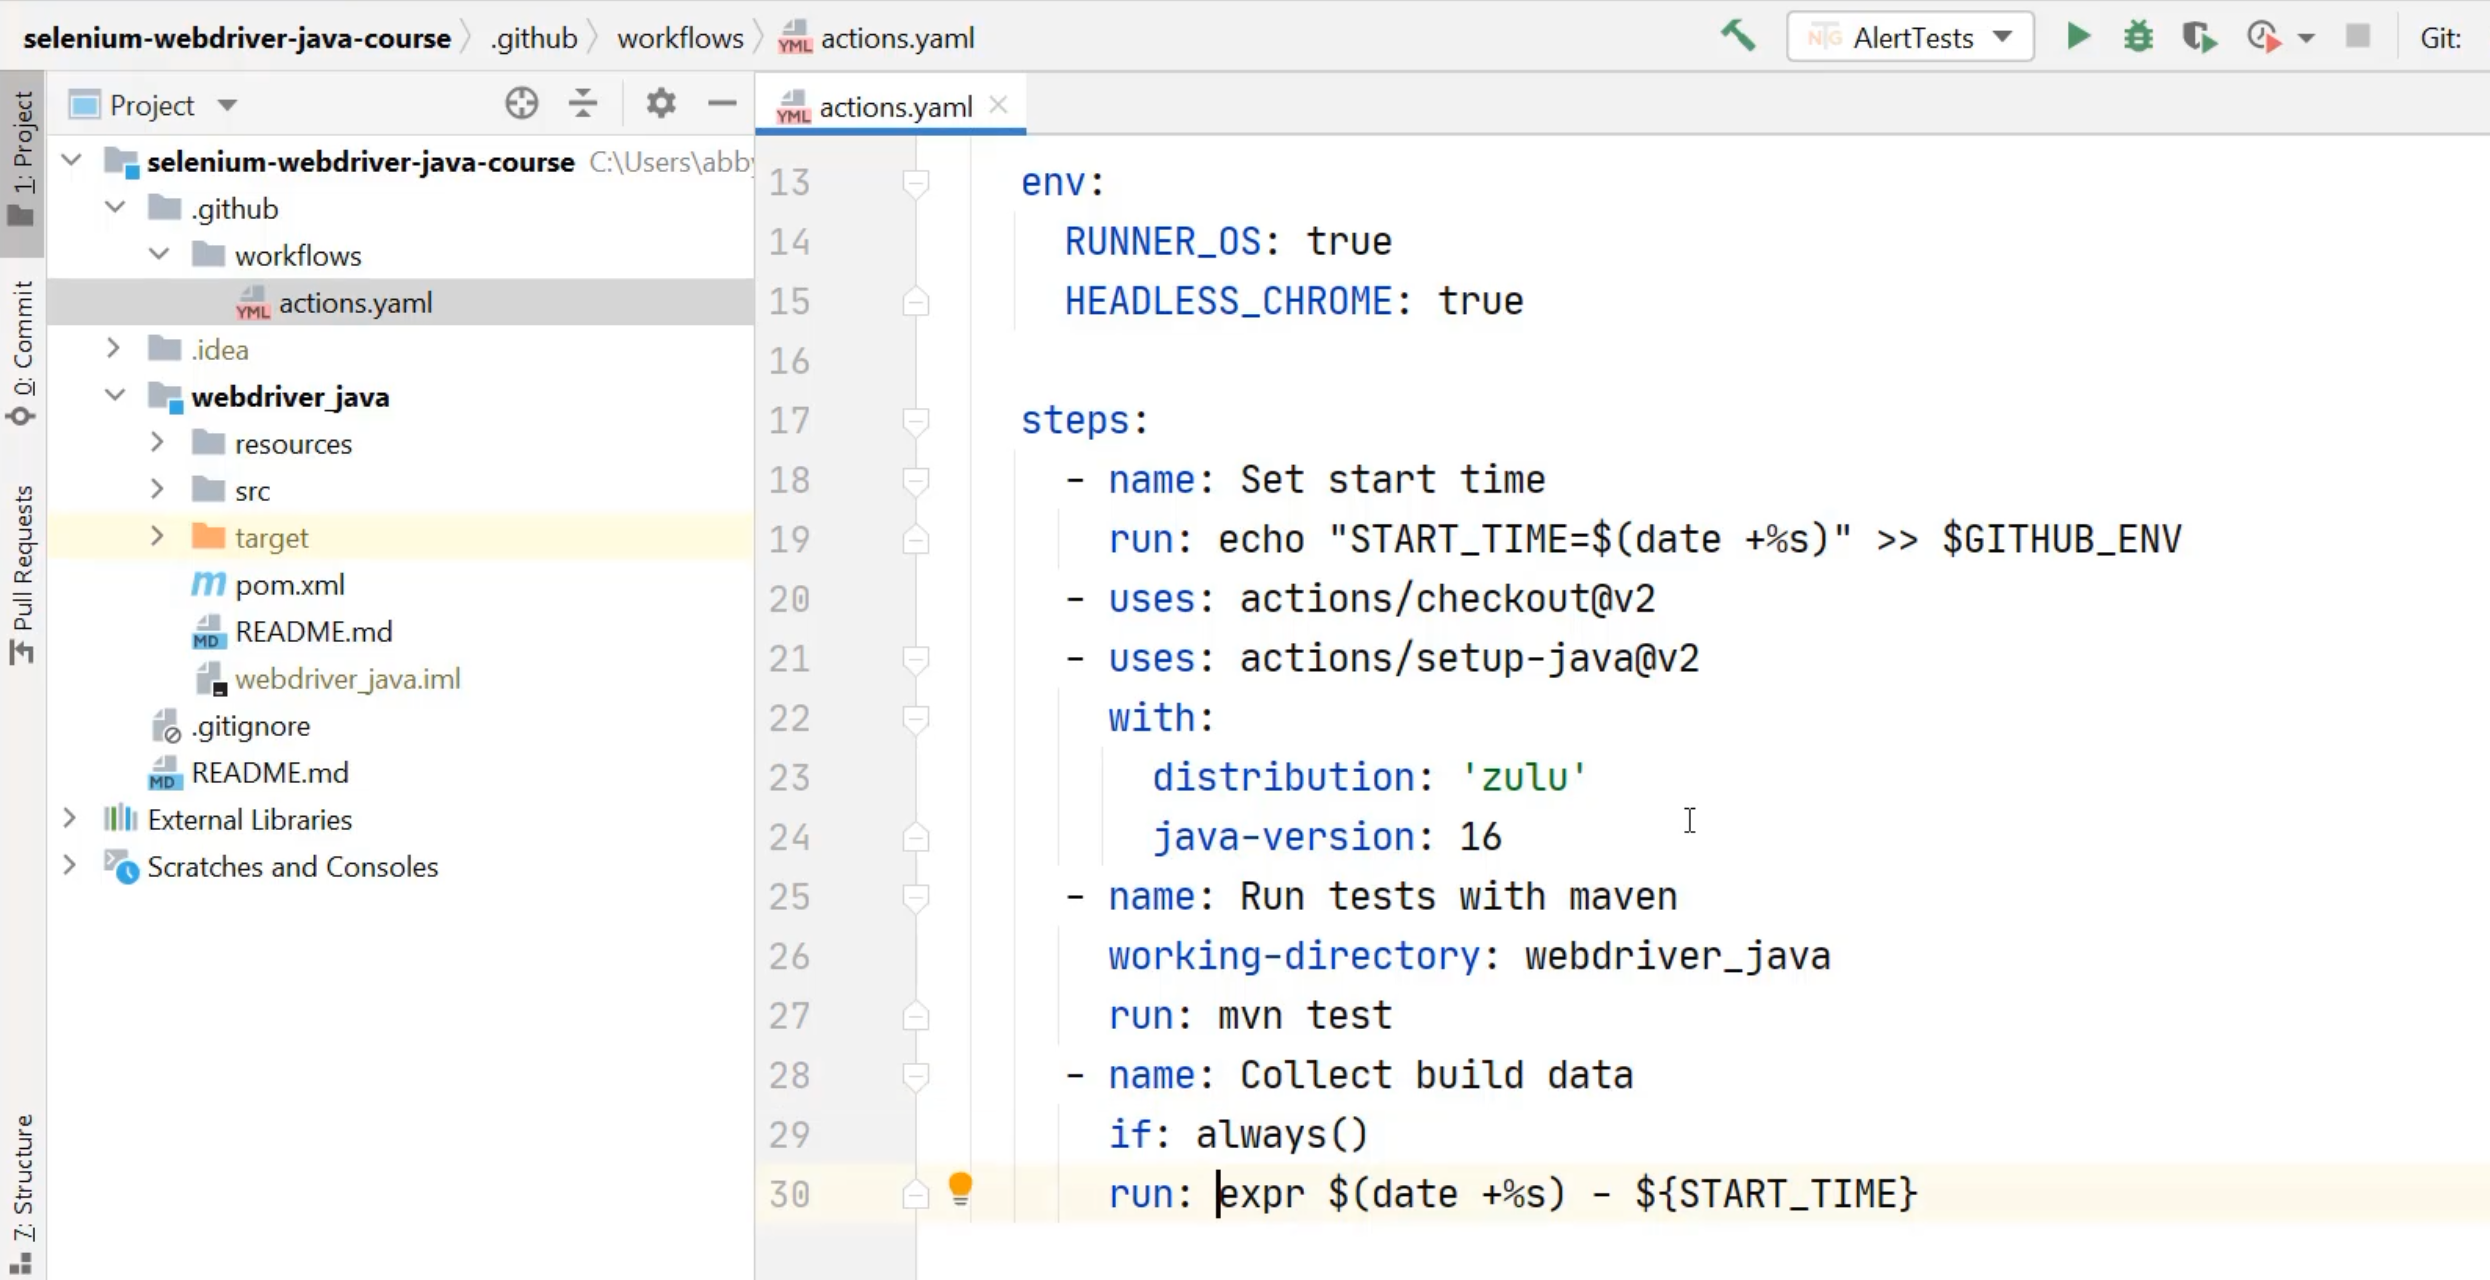
Well, actually what I can do is turn this into a multi line run command, by using the pipe | once again.
By using the pipe | in YAML, it tells YAML that the rest of the lines that are indented by two spaces below are actually all a part of the same command.
What I can do is now add my comment to say, "Run the script to extract test results" - that's what I want to achieve here.
First, I need to go and create that script in my codebase.
To do that, I'm going to go into the resources directory under webdriver_java, and add a new file.
That file is going to be called test_result_script.sh just like it is in the gist.
You can choose to add that to Git now or we'll do it later.
From there, I now need to go and copy the script from GitHub.
In GitHub, I can actually open this up as a raw file, which will make it easier for me to copy.
I'm going to copy that, and return to IntelliJ, and paste that in.
Now I've got my script, it's been saved into my directory, and I now need to call it from the actions file.
How do I call a script from inside of here?
What I need to do is I need to run the shell command in a specific location.
I once again need to make sure that this step is running from a known location, just like I did with the Maven test step.
I can take that working-directory and I can add it to the "Collect build data" step as well.
Now, when I'm looking to run the script, I know that the command thinks it's already in the webdriver_java directory.
All that I need to do is say, ./ to say run the script that's in resources/test_result_script.sh.
That'll get printed to the screen.
Now to make things a bit nicer, because we're going to be printing a few things, I might add a bit here to this expression to make it match the others.
So, I can say echo "TOTAL_DURATION=$(expr $(date +%s) - ${START_TIME})" and now it will print out similar to the ones that are in the test_result_script.
At this point, I'm ready to commit these in and see it run on GitHub Actions.
I can go to "Commit" and I can select the actions.yaml changes and the new script, and I can use my commit message that I've already created here about adding the results script to GitHub Actions.
I can commit this, but I don't want to push it just yet, because we've already learned about how to make a file executable by CI.
So, before I push this, I'm going to need to go to my command line and make sure that this file test_result_script.sh is going to be executable by the CI.
Here I am in my command line, and I can use that update index command again.
git update-index --chmod=+x webdriver_java/resources/test_result_script.sh
Now I can check the status and I can see that's ready to be committed.
I can add the commit message "make test_result_script.sh executable", and I can push.
With that pushed, I can go back to the browser and check on my actions that are running.
Here I am with it running, and I can click through and have a look.
Our tests are running with Maven and so I'll speed this up to make it easier to watch the video.
There our tests have run, and we can check on the "Collect build data" section to see that not only do we have our total duration printed with a nice label now, but we also have how many tests were run, how many passed, and how many failed.
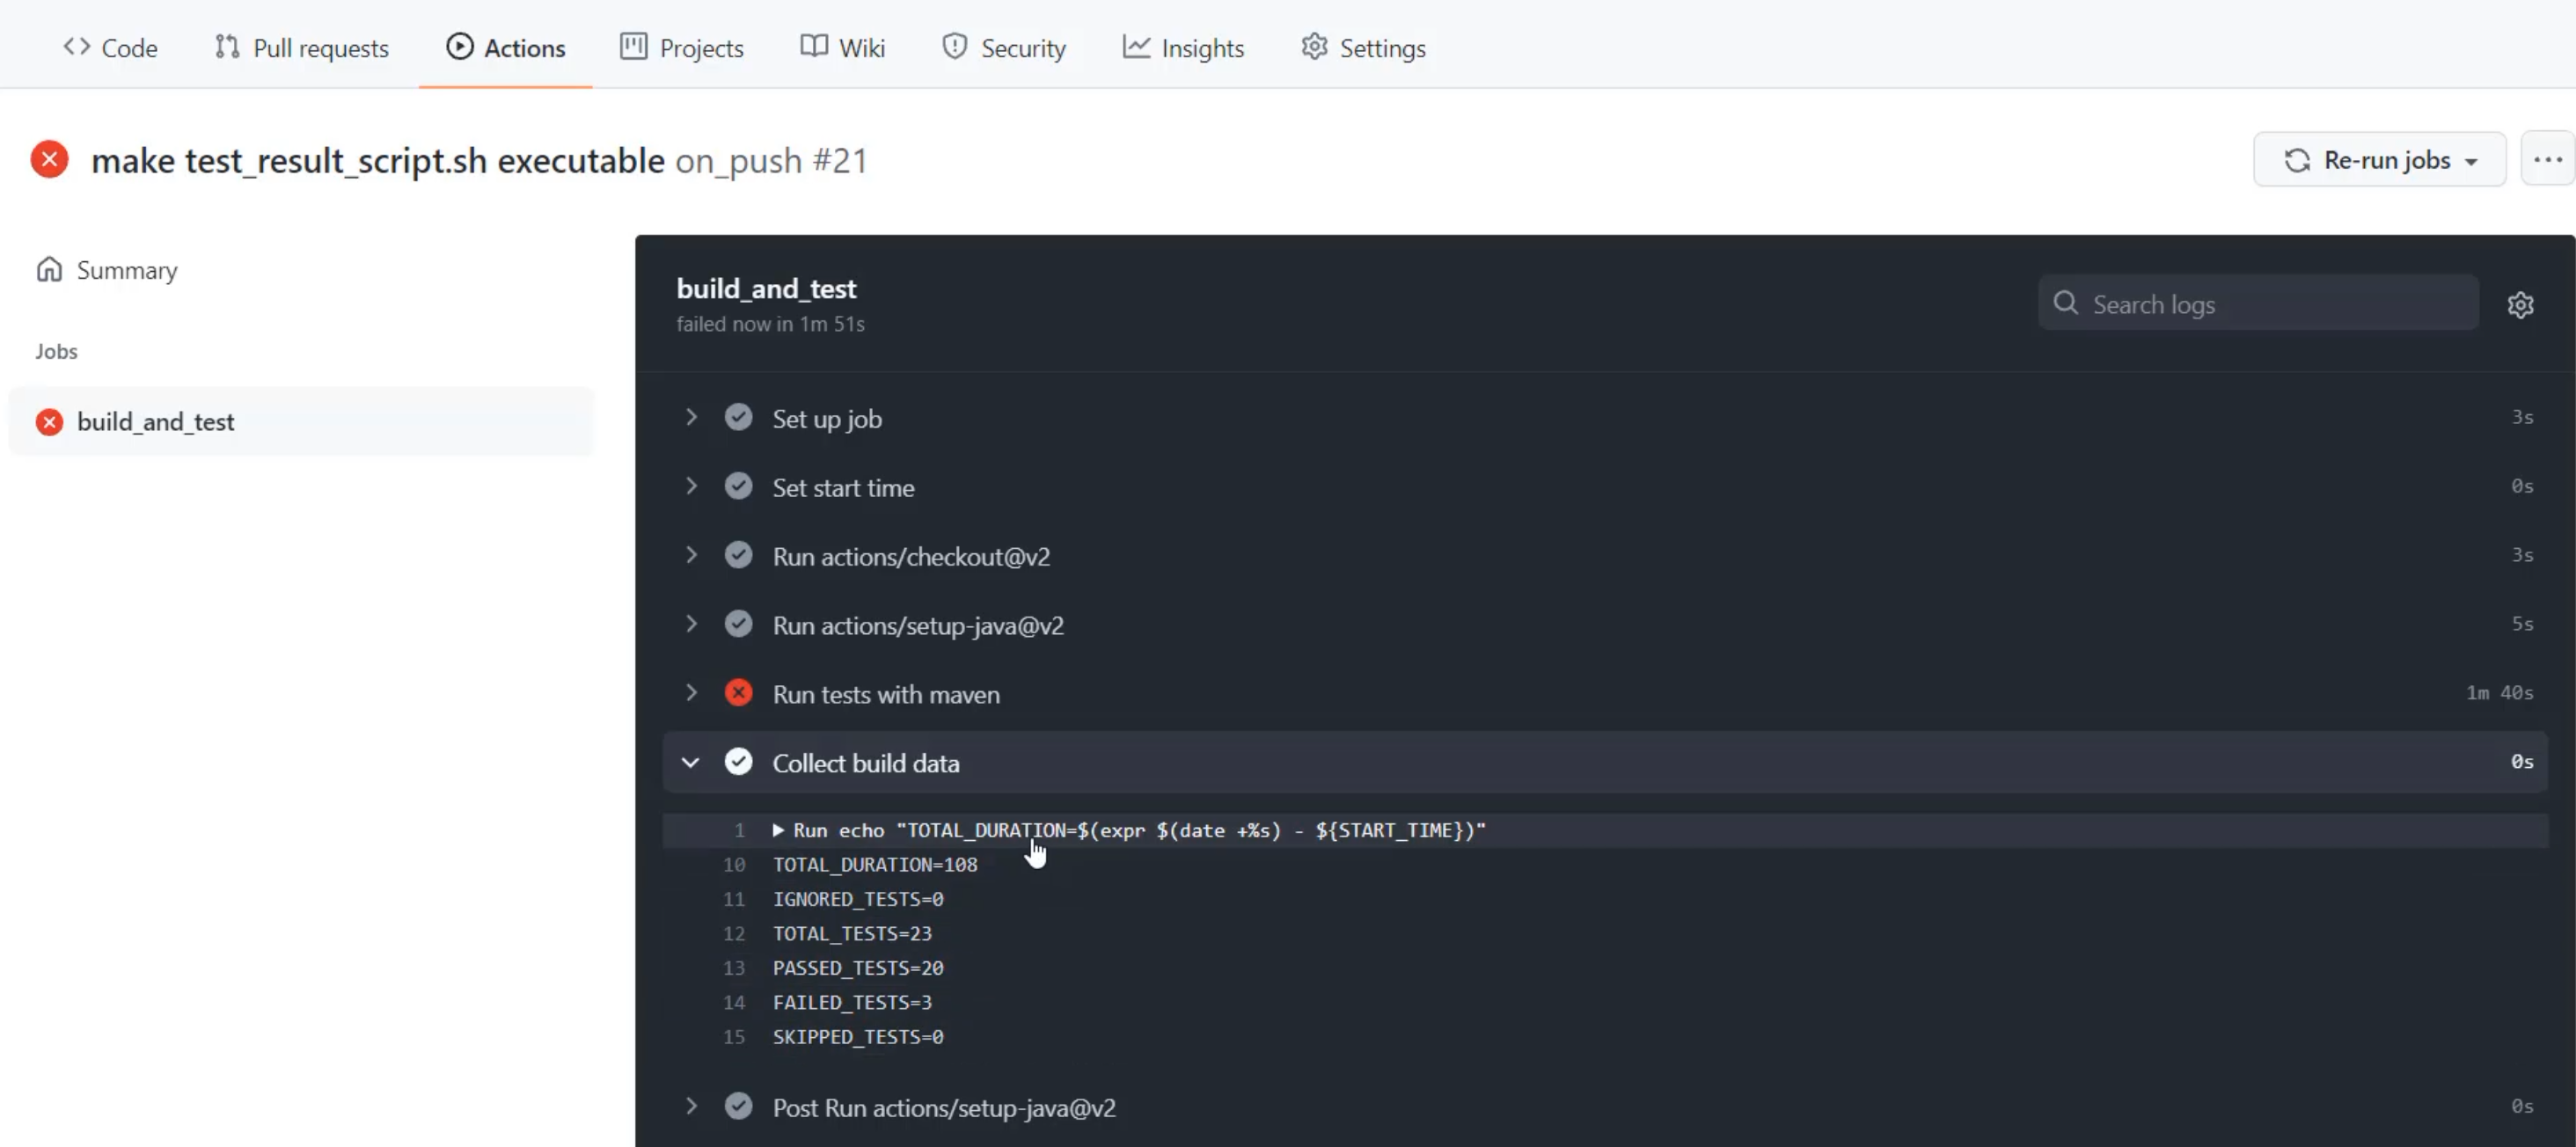
Now, I can see that actually a third test failed, unlike the previous runs, before I even have to click into that really long "Run tests with maven" section.
I'm not going to click in there now, because I'm not going to do debugging of the tests, but what this is starting to show me, is that I can get information about the quality of those test runs without having to dig into the details right away.
There we have it, we've got some metrics that we want to collect ready to go, but now we need somewhere to put them.
So, we need to start talking about what does a metrics collection piece of software look like?
We're going to talk about running Prometheus.
