

Transcripted Summary
As of the last few chapters, we've been able to generate our metrics in the build pipeline in GitHub Actions.
We've been able to then translate that into the format that we need to be able to store those data points as metrics.
Finally, we were able to send those metrics to a piece of software called Prometheus, which could store and allow us to query those metrics.
But when we just left off, we were only able to send a single metric.
Let's recap what metrics we're collecting.
We have test duration now being sent all the way through to the Prometheus Pushgateway, and then queryable from Prometheus server.
We have the count of tests passed, failed, ran and skipped - all already identified and extracted, but not yet in Prometheus.
We still want to understand the duration for specific steps and all this other information in logs that might be interesting.
In this video, we're going to look at ways to make sending metrics a bit easier in bulk, as well as how to introduce new and helpful labels, so that we can use the metrics more effectively.
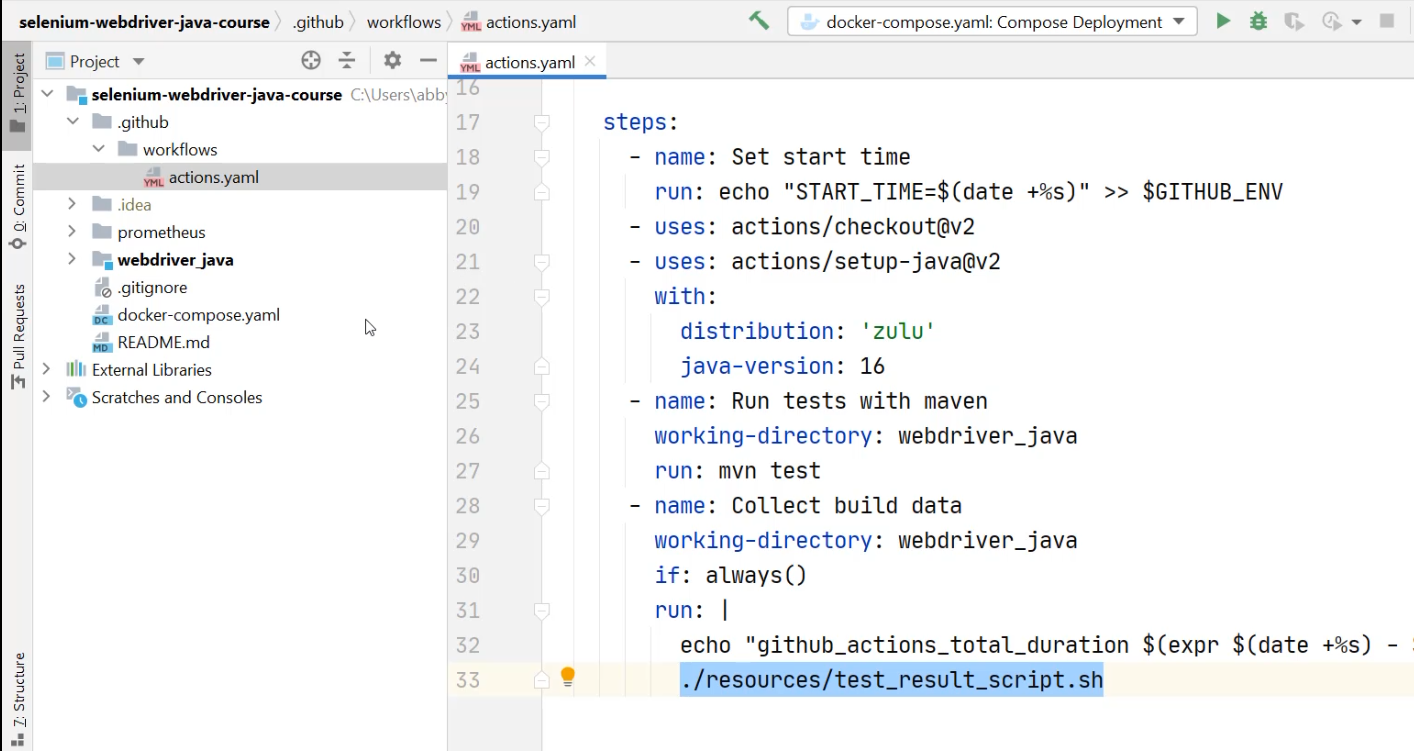
Here we are in the codebase and I'm going to go to my GitHub actions.yaml file under .github/workflows.
I'm already sending the github_actions_total_duration metric correctly, but inside of this script, all I'm doing is printing to the screen the test results.
I'm now going to go into that directory.
That's in the webdriver_java, under resources and test_result_script.sh.
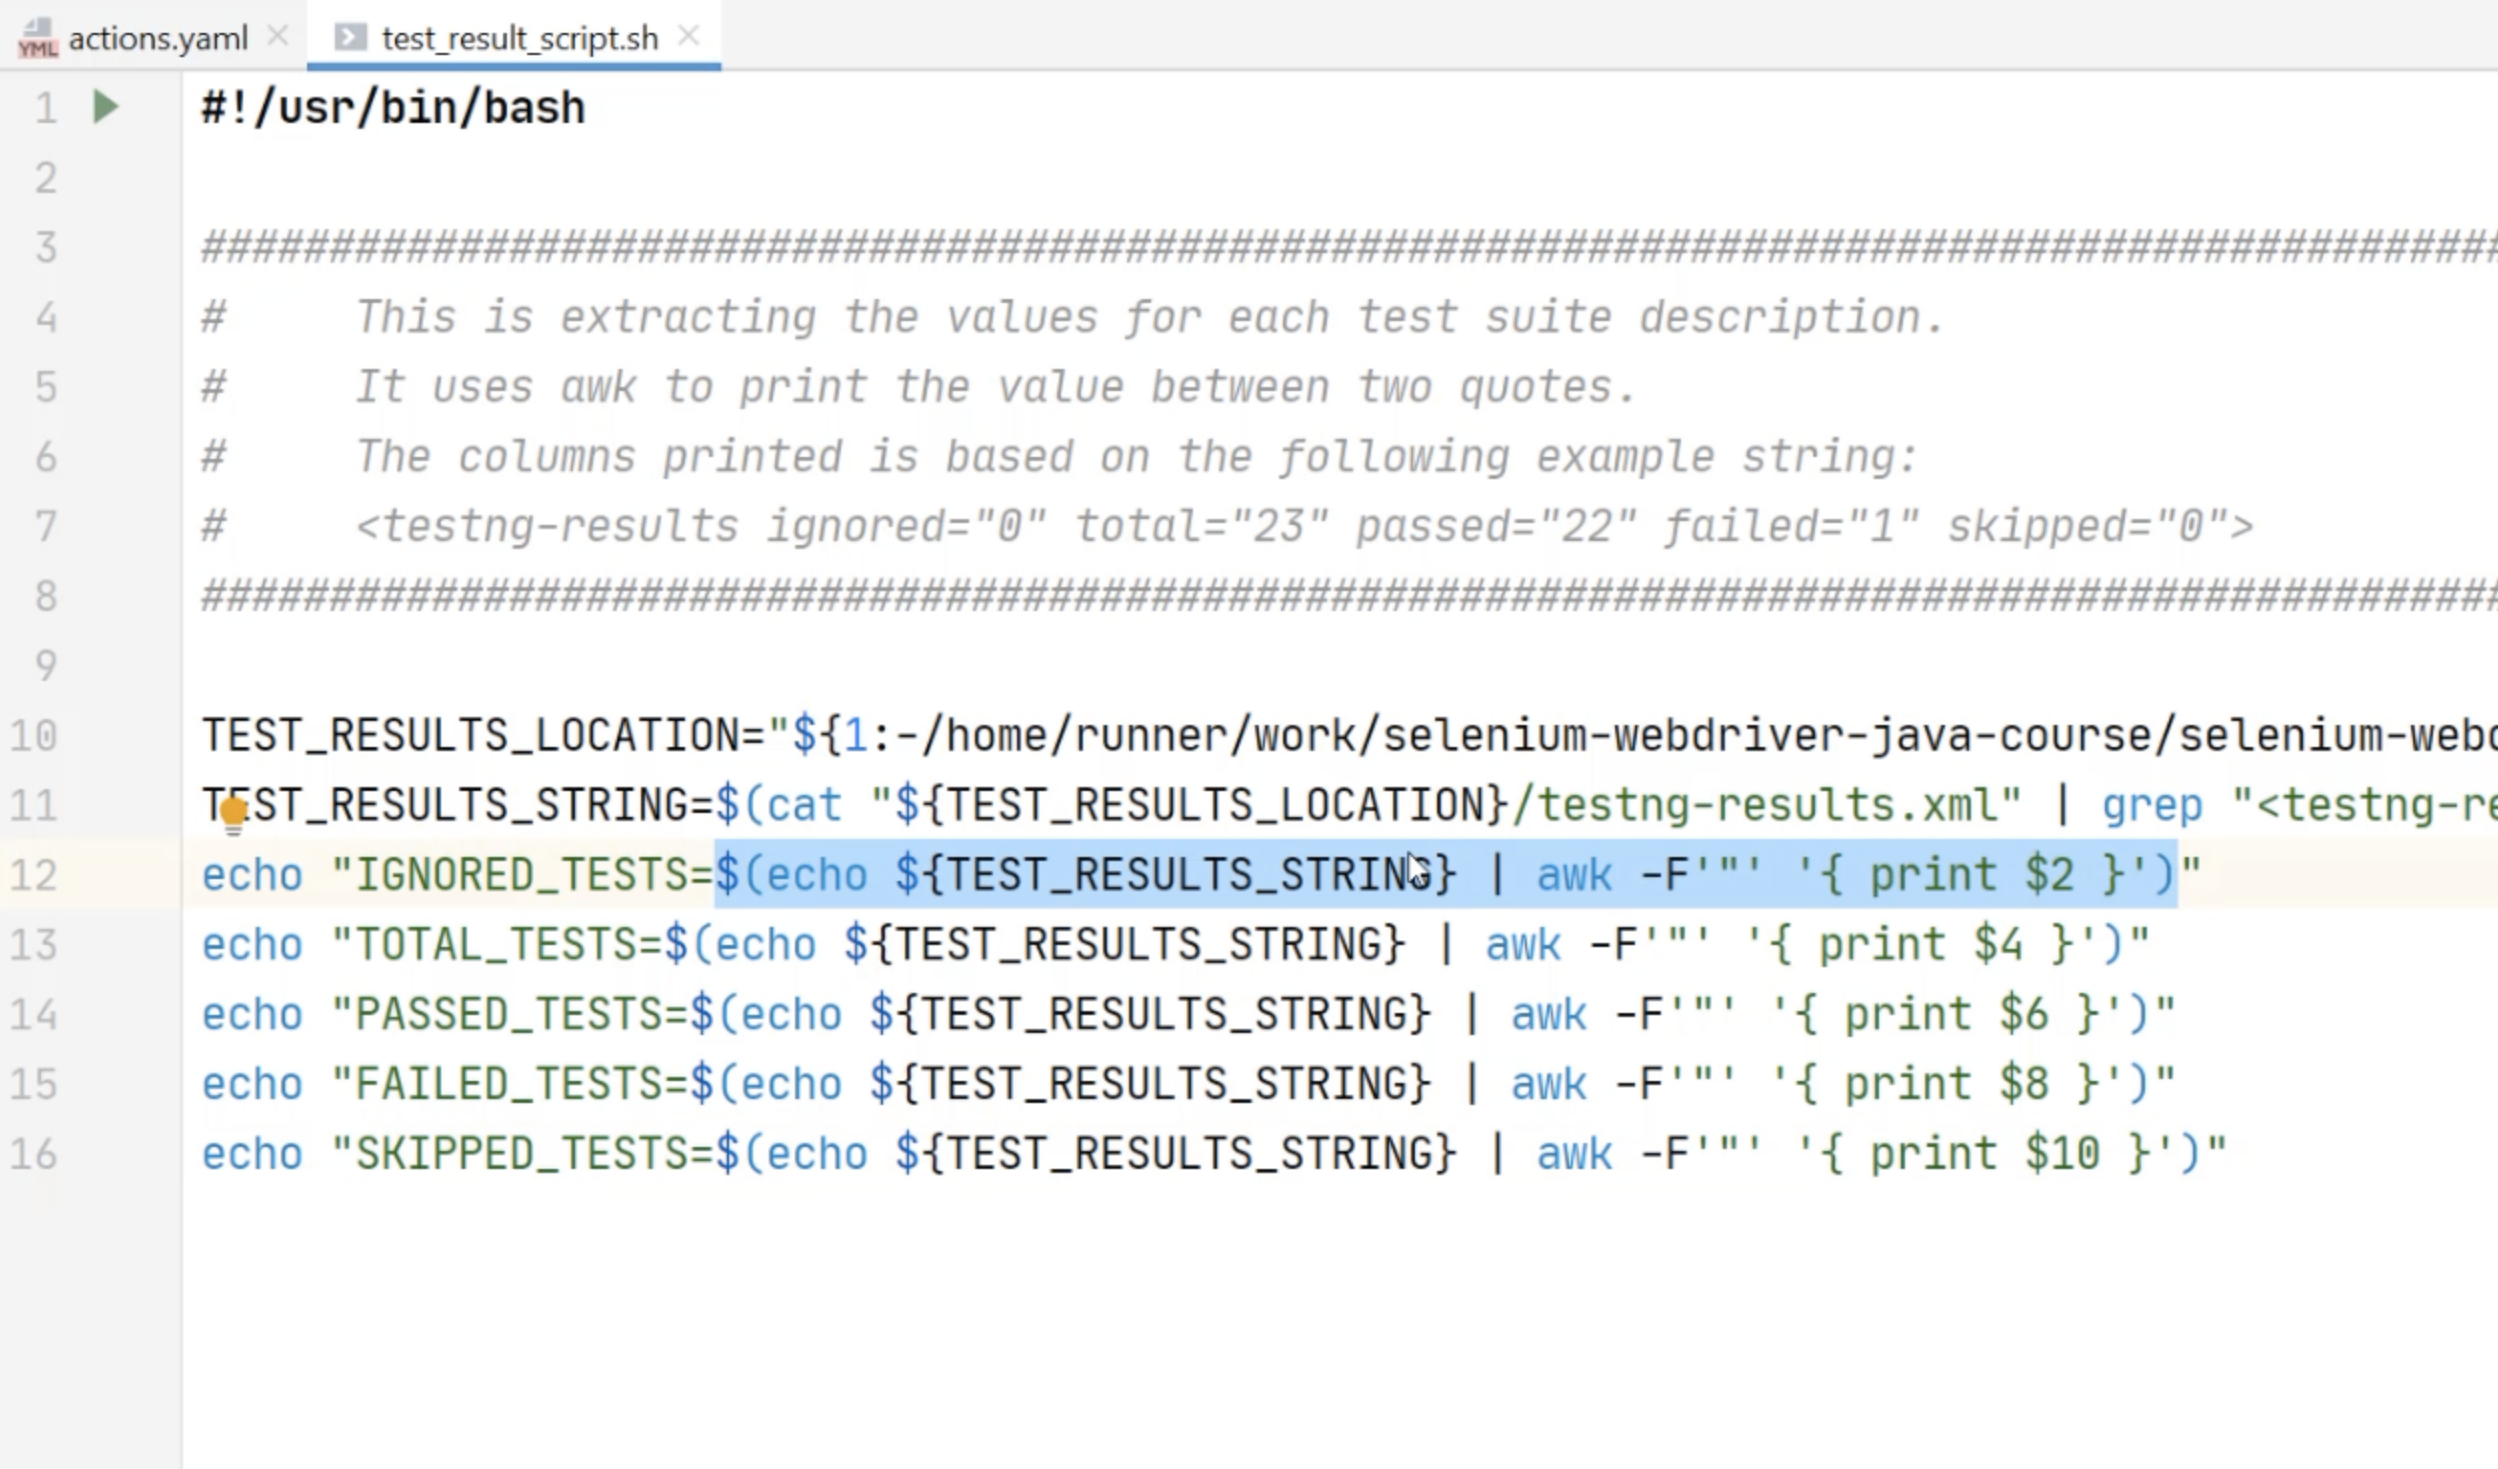
I can close down the project now for a bit more screen real estate, and I can inspect this file one more time. \
In this file, I have generated the value of a metric and printed it to the screen along with what that value represents.
Now, what I want to do is send that to the Prometheus Pushgateway server, and I can do that in the exact same way that I did with the duration.
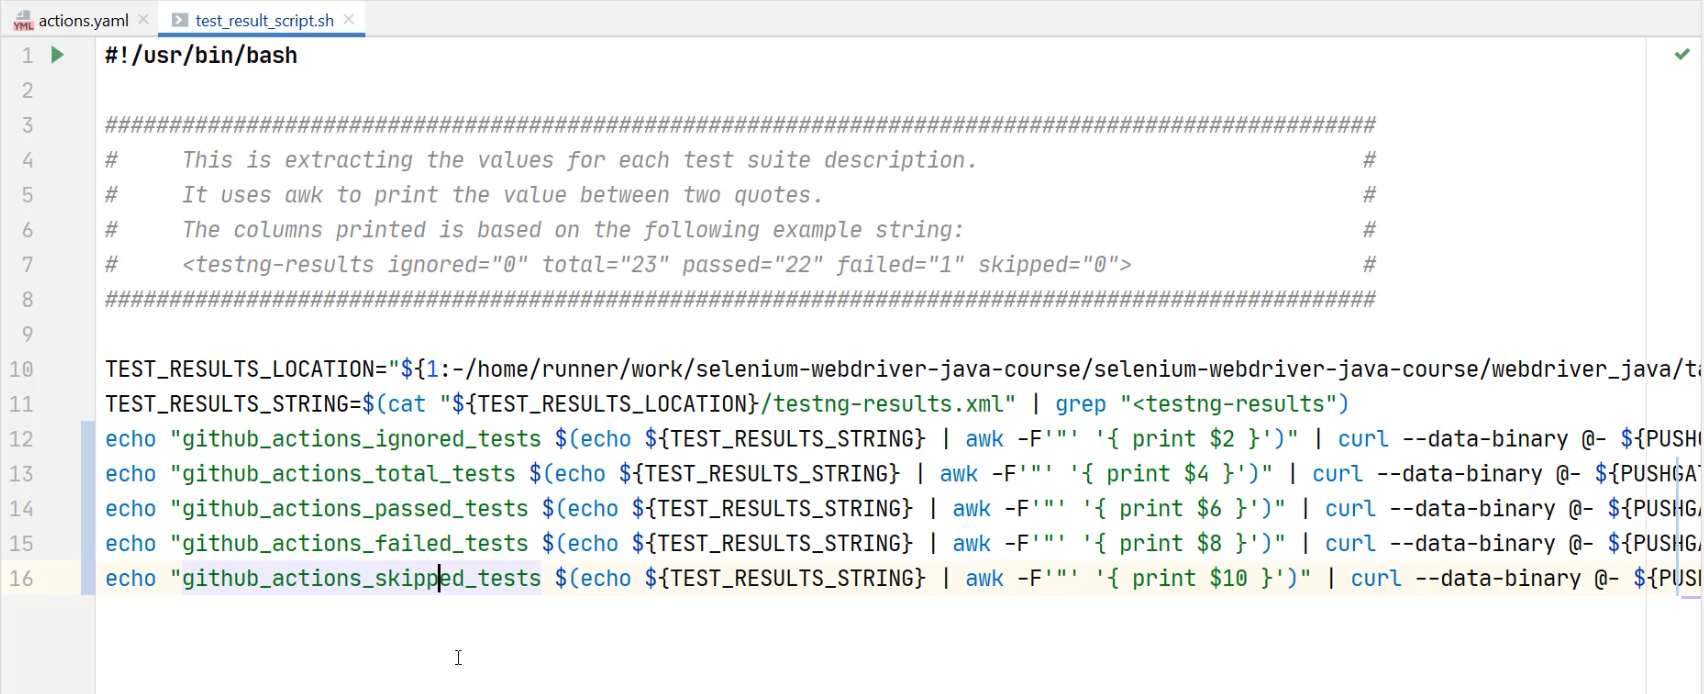
I can change this echo to - instead of just printing out a label - print out a full metric - github_actions_ignored_tests.
Then, I can take that and I can send it to a curl request - curl --data-binary @-.
When putting in the URL, I'm going to use an environment variable for the ${PUSHGATEWAY_URL}/metrics/job/github_actions.
We can see this will get quite repetitive, because what I'll need to do is take this and paste it at the back of each of these values.
Then, I need to make each of these be metric friendly names.
You can see this is getting a little bit tedious across all of these metrics.
We have fairly high confidence this will work because we've seen it work before, but we may want to be able to do this in a little bit of a cleaner way with this many metrics.
So, to do that, I'm going to change how I make this curl request.
In particular, I'm going to change how I send data to this curl request.
In order to show this, I'm not going to remove the existing lines.
I'm just going to add a new line to the end of the file, and that new line is going to use the cat, or concatenate command, which allows me to send in a full file of data.
It's going to use this EOF syntax - that stands for end of file.
Then, what I need to do is send this file to the pipe command |, which will go to the server.
cat <<EOF | curl --data-binary @- {$PUSHGATEWAY_URL}/metrics/job/github_actions
Now every line I do after this until the marker EOF is seen again, is going to be considered part of the data that I'm going to be sending.
So what I can do is I can take this value and I can paste it inside of this file, or what would be a file.
Then I can do that for all of the others.
cat <<EOF | curl --data-binary @- ${PUSHGATEWAY_URL}/metrics/job/github_actions
github_actions_ignored_tests $(echo ${TEST_RESULTS_STRING} | awk -F'"' '{ print $2 }')
github_actions_total_tests $(echo ${TEST_RESULTS_STRING} | awk -F'"' '{ print $4 }')
github_actions_passed_tests $(echo ${TEST_RESULTS_STRING} | awk -F'"' '{ print $6 }')
github_actions_failed_tests $(echo ${TEST_RESULTS_STRING} | awk -F'"' '{ print $8 }')
github_actions_skipped_tests $(echo ${TEST_RESULTS_STRING} | awk -F'"' '{ print $10 }')
EOF
With that, I'm now going to be sending the exact same data, but doing so with a single curl request.
Therefore, I'm going to remove each of the individual echo lines, and I'm going to get ready to push this to GitHub and see it work.
One thing I still need to do here though, is that I've got this PUSHGATEWAY_URL environment variable that I need to make sure I have access to.
If I return back to my GitHub actions.yaml file, I can see that I referenced this previously as a secret, but the script will not have access to that secret in quite the same way.
In order to have access to that secret, I need to introduce an environment variable that the script will also be able to see and set it to this secret value.
        env:
          PUSHGATEWAY_URL: ${{ secrets.PUSHGATEWAY_URL }}
The reason I'm cutting this out is because I now can start to use this PUSHGATEWAY_URL environment variable everywhere, so I can reference it in the more traditional way of single curly braces with the dollar sign ${PUSHGATEWAY_URL}.
Now we can push this to GitHub Actions and see all of our additional metrics be sent through.
I'm going to go to "Commit" - I already have a commit message ready - I need to add the script changes and the actions and I can "Commit and Push".
With that successfully pushed, I'll return to the browser and see that running.
With the Actions tab open, I can see that the "Add additional test result metrics" commit is running.
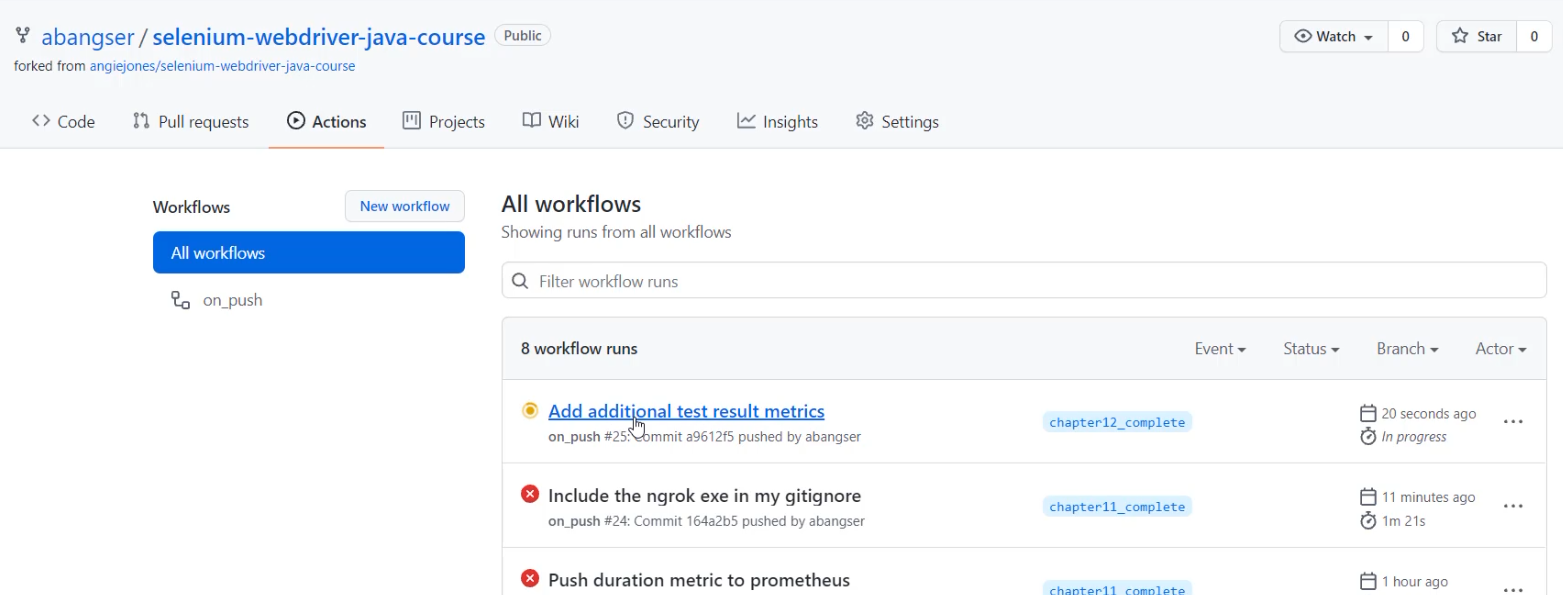
I can open that up and I'll speed up these results for ease of viewing.
With this done, I can open up the "Collect build data", and I can see that two different curl requests were sent.
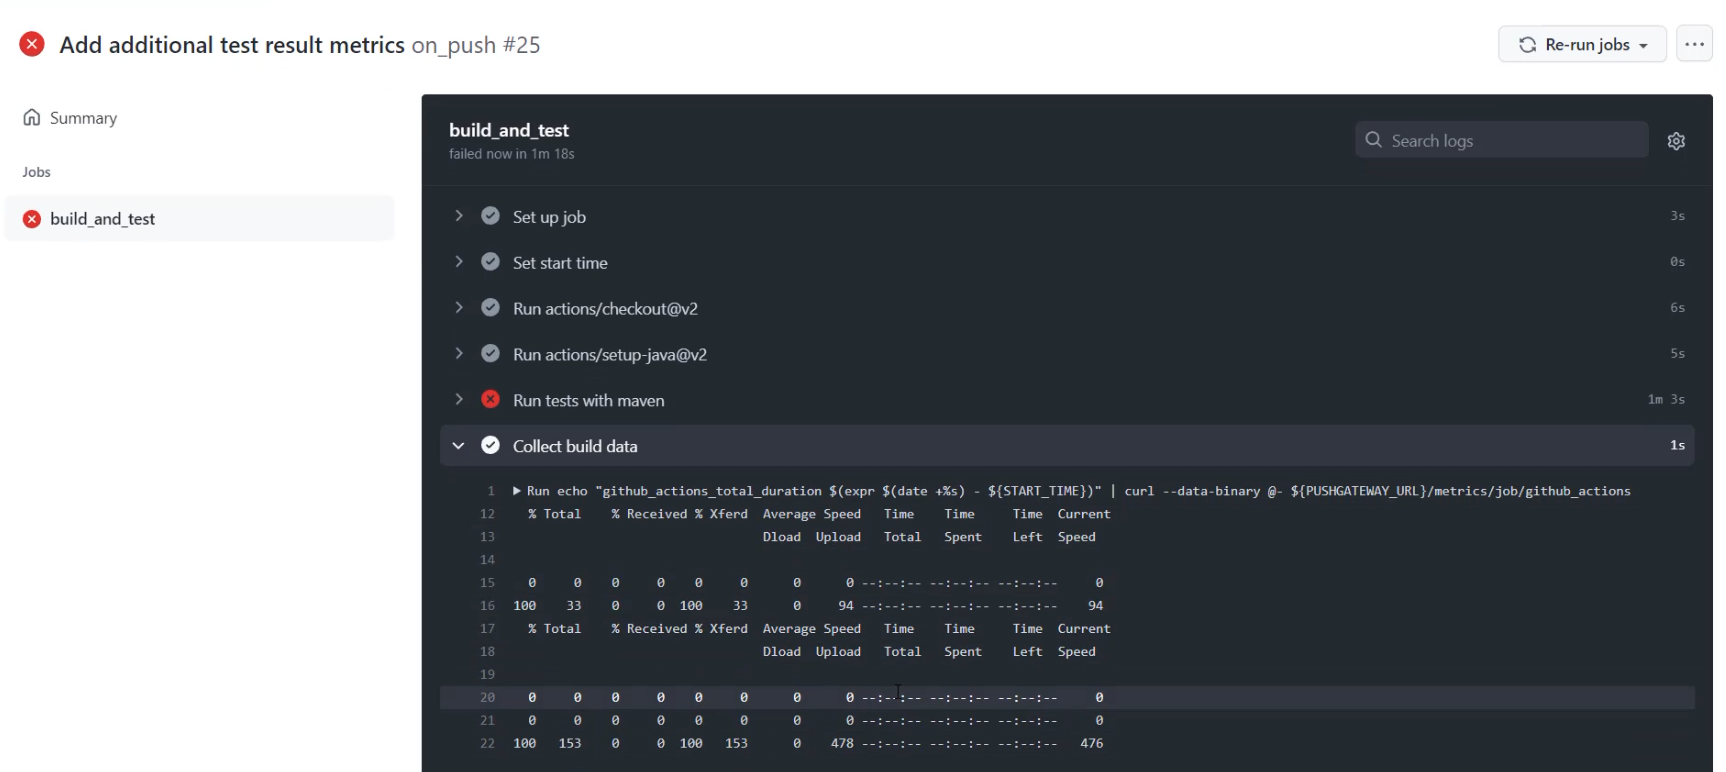
As long as I have the Prometheus Pushgateway running - here I am at the Pushgateway.
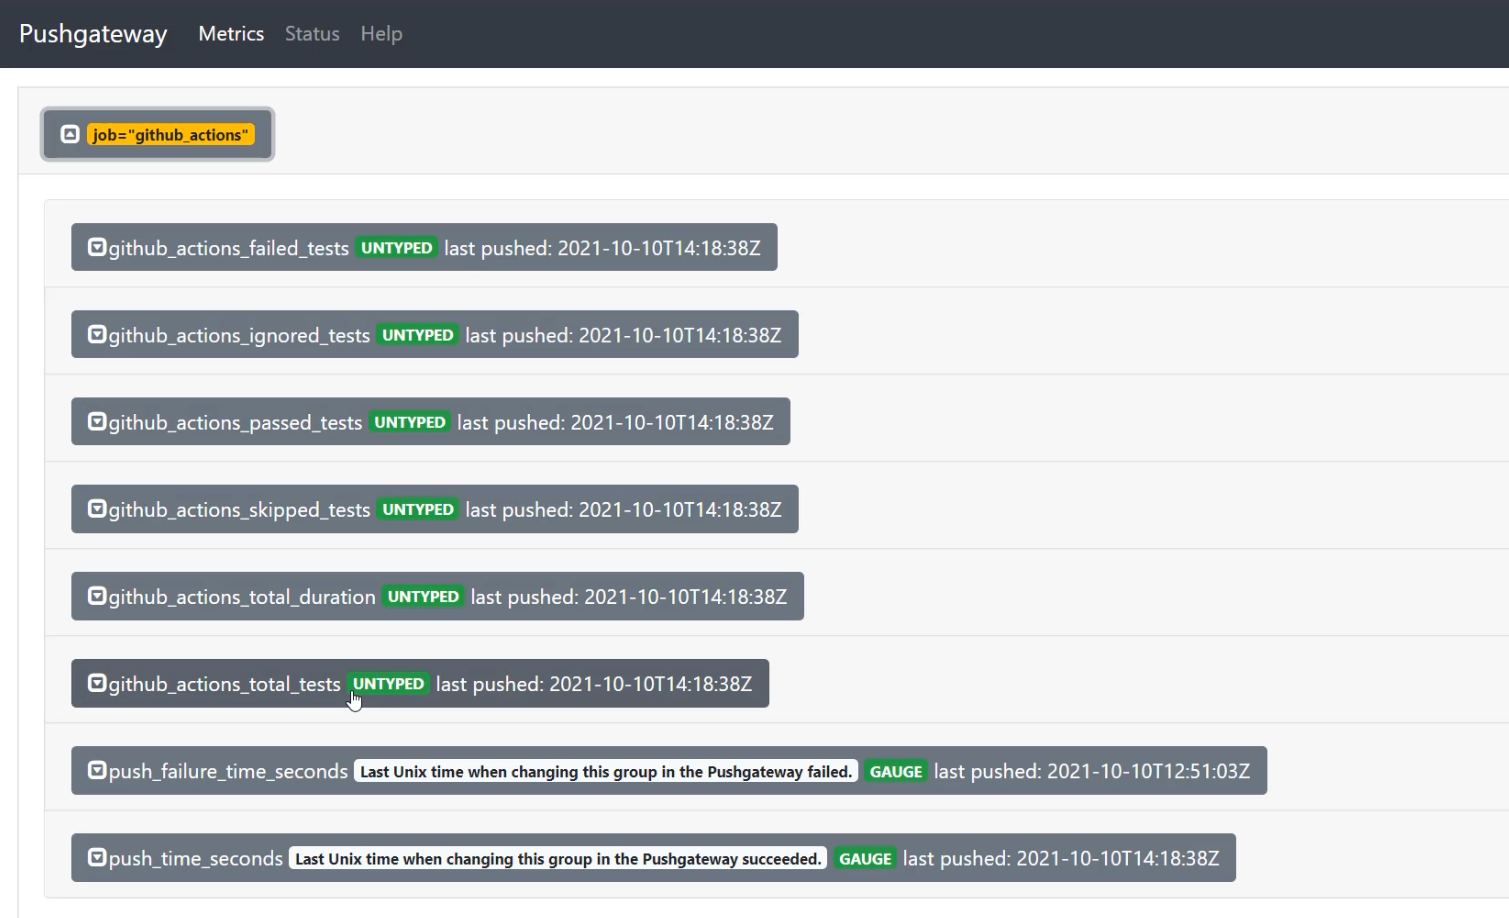
If I open up the "github_actions", I now not only have the total_duration metric which I've had now since the last chapter, I also have failed, ignored, passed, skipped and total_tests.
This is allowing me to collect this data every single time that we run this build pipeline.
In order to start generating some data to make the graphs more interesting, the next thing I'm going to do is put this job on a timer.
When we look at the action and we scroll all the way to the top, we can see that it is triggered right now on a push to a branch.
Given that this is most likely only a single person's repository, and it is something that we're doing for fun and not every day with tons of commits, there's not going to be too much data collected.
What we can do is we can actually introduce a second trigger and we can call this trigger a schedule trigger.
This will allow for us to tell the pipeline to run even if no one's working on the repository.
To do that, I need to introduce a cron notation.
cron notation is a way of indicating how frequently something should run.
I like to use a website called crontab.guru to help calculate what this should look like.
Here on crontab.guru, I can see that it helps me understand when the cron will be running.
cron notation has six possible inputs.
The first input indicates the minute, then the hour, then the day, then the month, then the day of the week.
Each of these can have a star to indicate all or can have a specific input.
This combined notation of 5 4 * * * means that we want to run every day of the week, every month of the year, and every day of the month at 4 o'clock meaning 4:00 AM on the fifth minute, or, in English, at 4:05.
This also helps by letting us know when the next time is that it will run.
If I were to change all these in for stars * * * * *, I would be running this every single minute.
That feels a bit harsh to do for a side project and to set GitHub Actions to run that frequently.
What I want to do is run it every 10th minute or so - */10 * * * *
This will mean that it will run at the 10, 20, 30, 40, 50, and 0 minute of every hour.
So the next time it will run is 3:30, because currently it is after 3:20.
With that calculated, I can give that a copy and return to my code.
I'll need to paste this inside of quotes because of the way that yaml will read this.
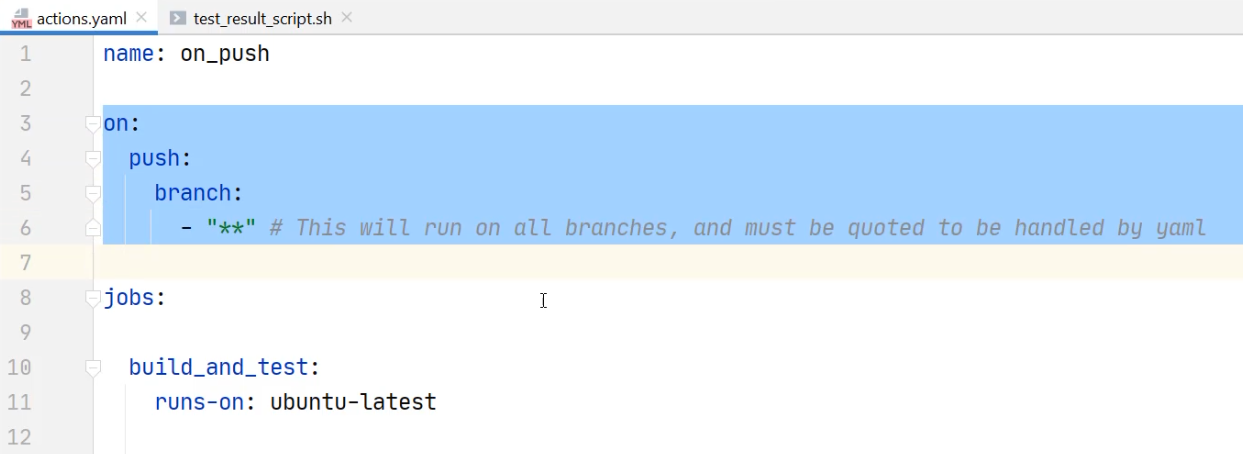
Given it's a bit complex to understand what I'm doing here, I'm going to add a comment for explanation - I'm even going to add the crontab.guru link for easy viewing.
on:
  push:
    branch:
      - "**" # This will run on all branches, and must be quoted to be handled by yaml
  schedule:
    - cron: '*/10 * * * *' # This will run every 10th minute. Calculated with: https://crontab.guru/#*/10_*_*_*_*
Now I can "Commit and Push" this so that I can start to collect more quantity of data.
Note that when I go to commit this, there is a catch.
The scheduled cron job will only work as a trigger if it is committed to the main default branch.
I'm working on branches in order to support saving my progress for you to follow along during this course.
I would suggest that you work on the main branch by default.
But in my case, I need to take all of my changes and put them on the main branch to allow for this cron to run, so I've done that and it is now running the cron job.
I'm going to open up this workflow, open up this job, and I'm going to fast forward through this, like before, to make it easier to watch.
With that build complete, I can look at the collected build data and I can see it successfully pushed to this Pushgateway.
Now, I'm going to return to the Actions tab, and I'm going to speed up watching this tab to allow you to see how this runs every 10 minutes.
Now, as my second scheduled job starts, let's talk through what's happening.
All the previous jobs that we've seen have had an "on_push" here and specifically pointed at a commit hash and a developer, being me.
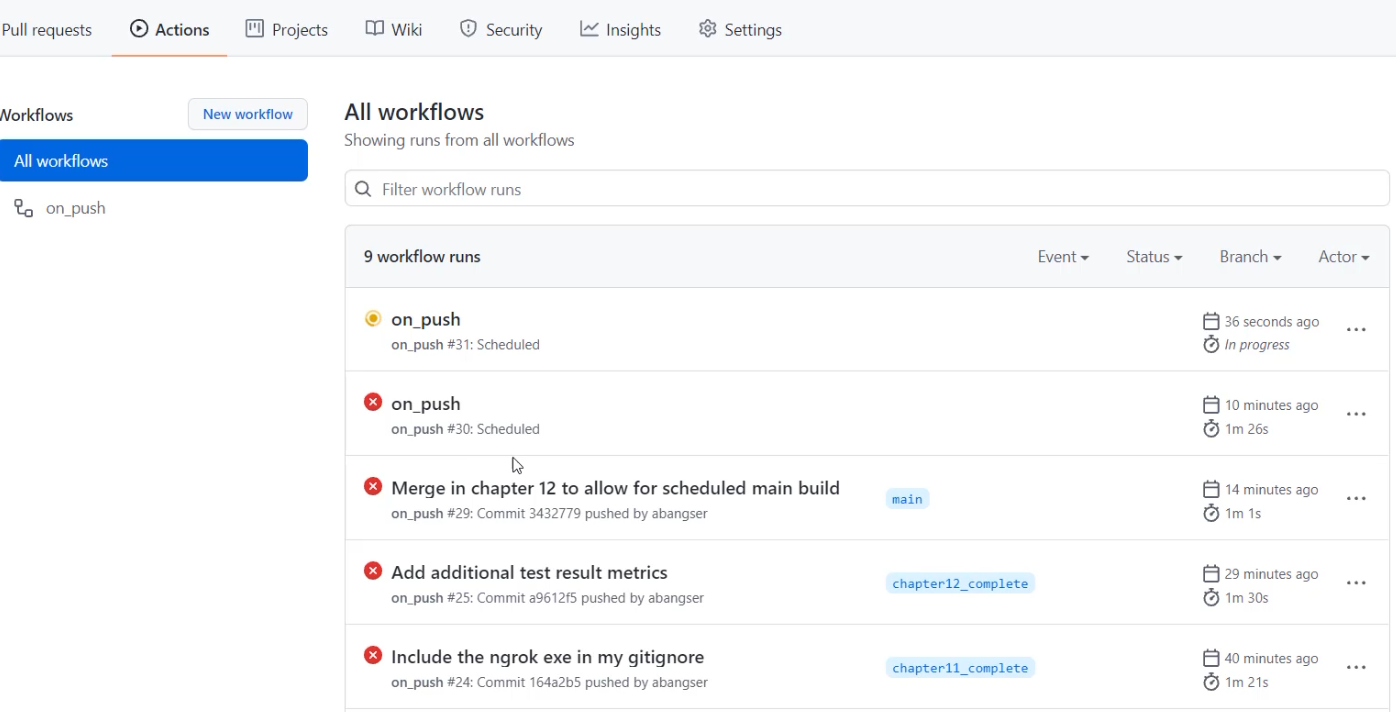
In addition, they've had a branch name mentioned.
What's different about these last two is that they're still the "on_push" action - I haven't renamed it - but they have been done by a scheduled job, not by a commit.
They also are running on that schedule, so they're running every 10 minutes.
One thing to note here is that GitHub Actions has the best intentions when scheduling these jobs.
While it tries to schedule them on the time that you suggest, we have seen anecdotally that this can be delayed up to 10, 20, even 30 minutes or more.
If you are relying on this to schedule something very precise, it might be a problem.
In our case, we just want to be generating test data, so this is a great way to do it.
We're going to leave this chapter here and come back to look at extending and adding to these metrics and what labels might look like.
