Transcripted Summary
In talking about observability, we can talk about data types, like logs, metrics, and traces.
But we can't really go any further without introducing another type of data structure, called the event.
You may find some information around the Three Pillars online, and this is actually a bit of a falsehood.
What the Three Pillars says is that you have this idea of the metrics, which allow you to track data over time, logs, which can give you those details about execution, and traces, which can tell you where time was spent within the system, and that these are your three pillars of observability.
However, what this falls under is requiring three different data stores, you have to have one for your metrics, one for your logs, and one for your traces.
There are some tools that allow for data stores to be combined - maybe between logs and traces - but in general, you're looking at three separate ones.
There's also tools out there that try and mask these separate data stores by having the same user interface, but when you go and make queries between these different structures of data, you can tell a difference when you're making them.
Fundamentally, these three types of data - these three pillars - have historically been treated as three separate data stores.
But they don't really have to be three separate data stores, right?
Because it's not really about metrics, logs, and traces.
What it's actually about is wanting long term trends over your data, wanting to understand the execution details of what's happening, and wanting to understand the systemwide context of a request.
Now, this all seems quite sensible, and it can be clear why these three pillars have been so popular.
But what if, we could have these three outcomes - the long term trends, execution details, and systemwide context - but from a single data store, which would allow us to dive in and out of each of these benefits in a more seamless way, rather than needing to go between different user interfaces, different tools, and different data stores?
To do that, we need to introduce a different type of data, called an event.
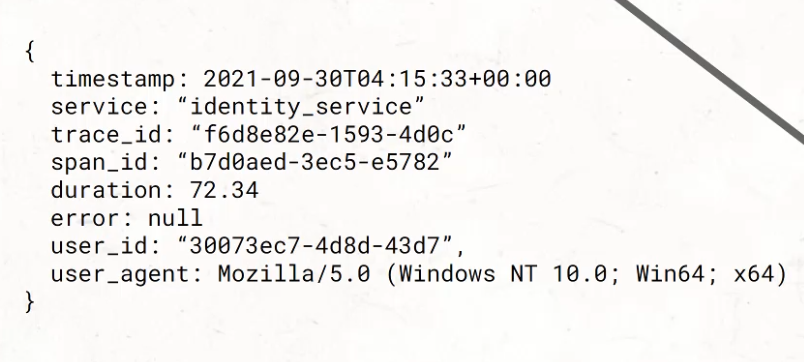
And if this event is stored in the database, it would look a bit like this.

It'd be a JSON blob, which means that it would have a number of key-value pairs, and those key-value pairs would highly likely contain these and more items.
Why do I say that?
Well, because in order to do long term trends, we need information like the duration that something took, and whether or not there was an error, because that's what we want to take trends over.
In order to do execution details, we need things like the user_id and the user_agent, to understand the details behind what is going on with this request.
And, in order to have outcomes around systemwide context being shared, we need things like, what is the service that's being called, and how does it connect to other services in the system?
So, things like trace_id and span_id can give that connection to all the different services that work together to give a response.
If we go a little bit deeper on what an event is, there are a few characteristics that can maintain this.
One being that it is JSON - it is structured.
That key-value aspect to it is so important because it allows us to be able to add data without breaking previous contracts.
When you have just a sentence statement, you have to think about regex breaking down that sentence or that string.
With key-value pairs, adding more keys in with more values doesn't break the system at all.
In addition, it needs to contain duration, and what that really means is that an event is collecting data over a period of time.
Unlike a log, which is a moment in time and can send information it knows, an event is more like a grocery bag containing information during your entire shop of that grocery store, or your entire time in that service during a response.
And finally, it needs to be able to be correlated with other events around the system - whether that be through something like trace_ids or other correlation_ids, that idea of its connection with things around it and with other events adds so much benefit to this data structure.
Let's look at an example based on what we've been working on recently.
For example, when we look at GitHub Actions, we can see this breakdown of what occurred during the action.
We set up a job, we ran checkout, we set up the JDK, etc.
If this were to be put up into a trace, it might look a bit like this.

You'd have the long CI pipeline for total duration, and then each individual piece.
When we're talking about events, what we would have is a single event per block on this screen.
So you'd have an event for the setup job, you'd have an event for the checking out of code, for the setting of the JDK, the recording of start time, the run tests, etc.
In each instance, you would have a duration, as well as a relationship to its peers.
The fact that this existed in the same CI pipeline as the other jobs is important.
The fact that they happened when they started so you can tell the order of operations is also important.
There's a lot more we can go into here, but I think it'll be a lot easier when we get experience building and looking at these from a working pipeline.
Stick with us, and next we're going to be looking at exporting build events from our pipeline.
Resources
- Article about the risk of the 3 pillars view
- Observability vocabulary including events
- A breakdown of events vs logs
