

Transcripted Summary
We have different useful ways to debug our test cases with TestCafe.
The first one is the Debug Mode.
So we can add --debug on the command line and after that, when we run our test, our test will be started in debug mode. And then after that, we can step by step check what happened during our test.
Also, we can Take Screenshots, maybe on failure or during our tests, just to ensure that everything is working fine. You can take a screenshot with the entire page or with the element.
Also, one additional important feature with TestCafe is that we can **Record Videos **without any external APIs or any external modules.
# The Debug Mode with TestCafe
In this mode, test execution is paused before the first action or assertion so that you can invoke the developer tools and the debug.
When the test execution reaches t.debug that we added already in our test, it pauses so that you can open the browser's developer tools and check the page state, DOM elements, location, their CSS, and more.
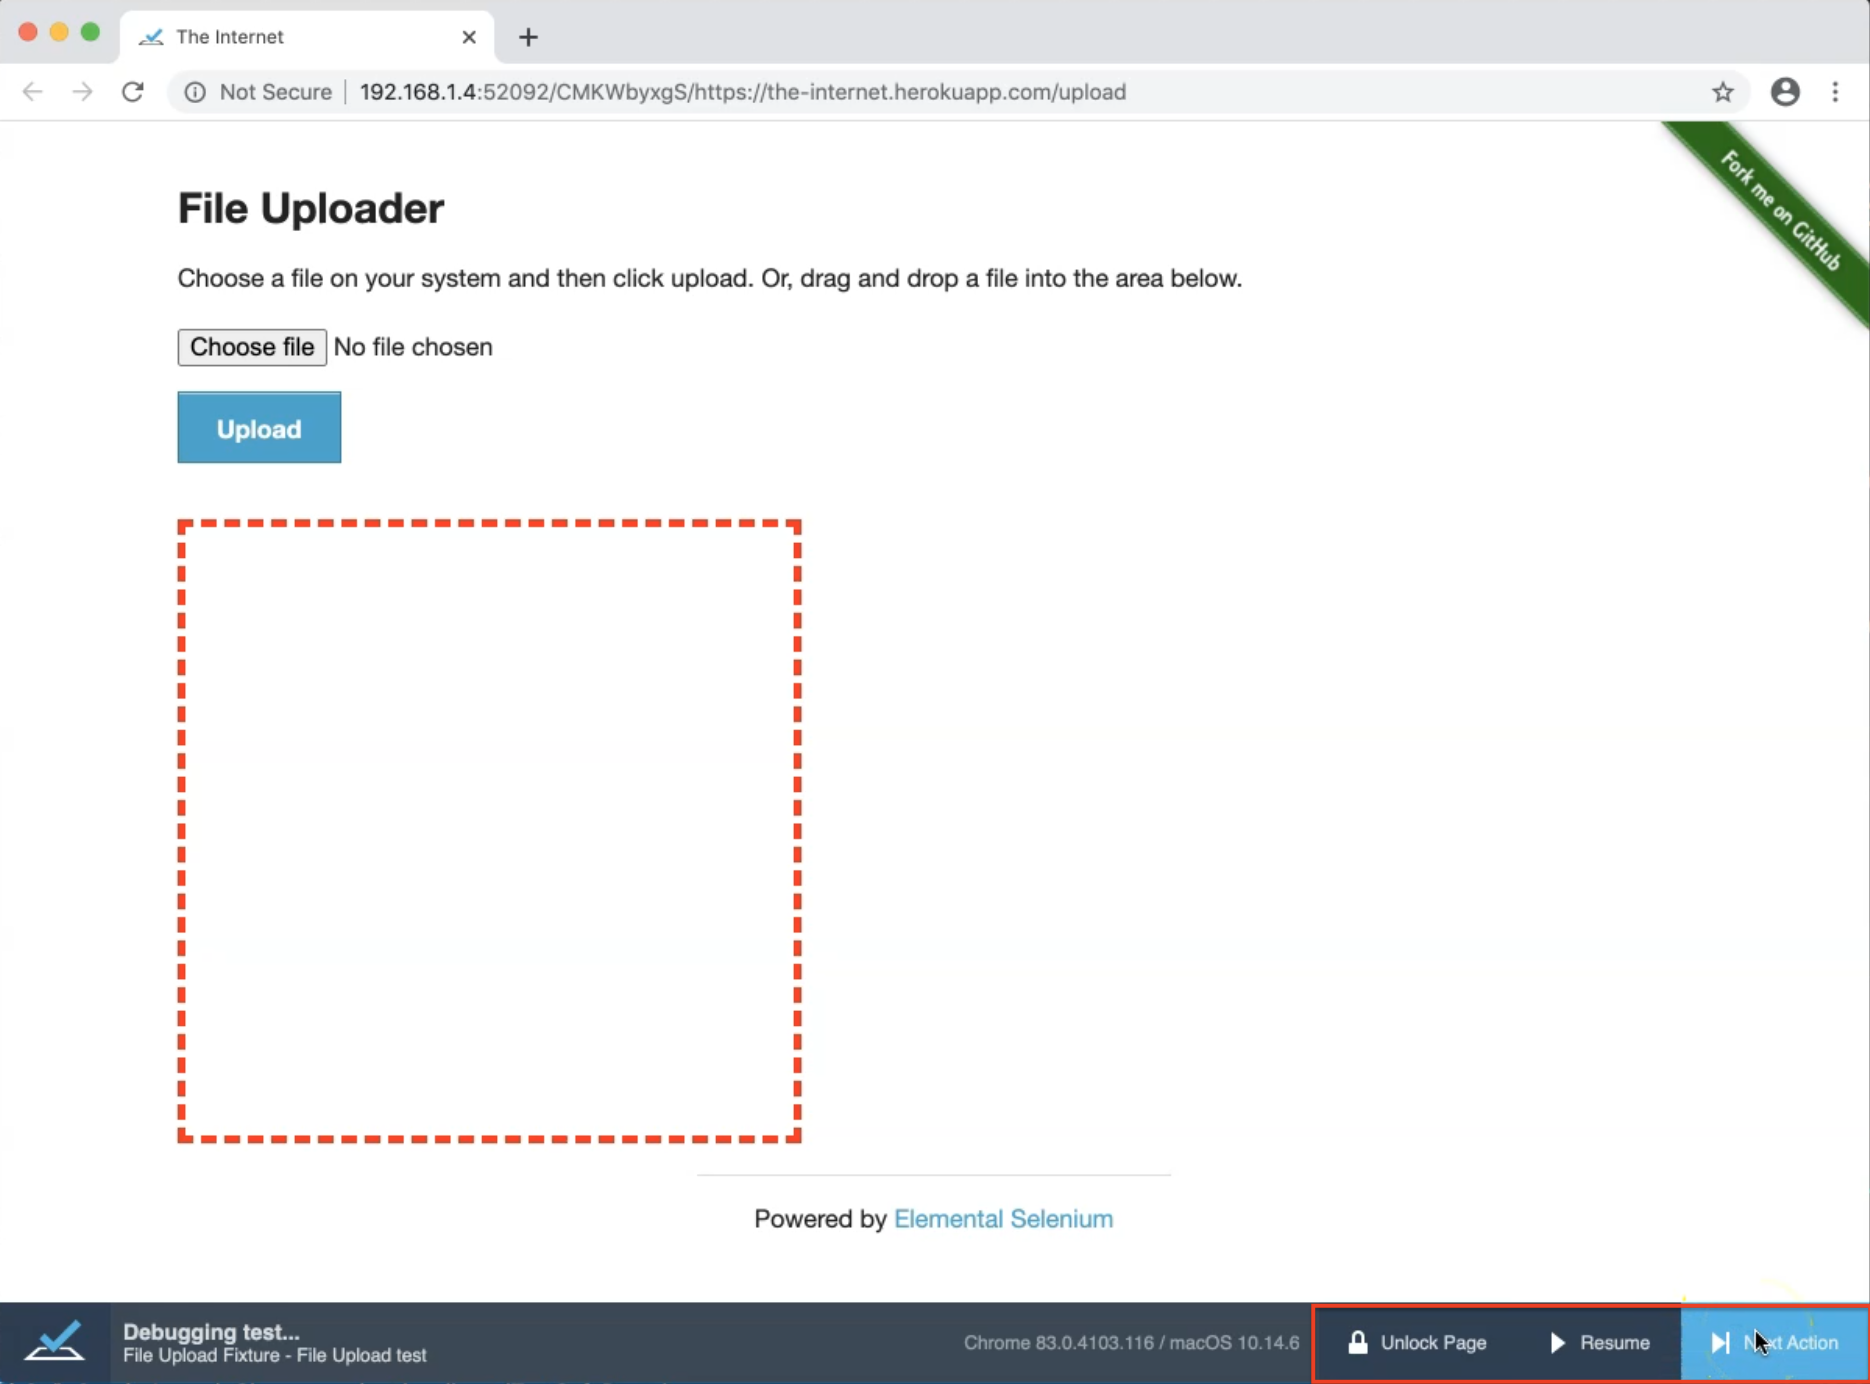
The footer displays a status report in which you can resume as test execution or skip to the next action or assertion.
For example, here we can click Resume to continue the test, Next Step, and Unlock Page.

You can also use the Unlock page switch in the footer to unlock the tested page and interact with its elements.
# Debug Mode on Fail
We can specify to automatically enter the debug mode when a test fails with this command line parameter --debug-on-fail.
For example:
testcafe chrome tests/sample-fixture.js --debug-on-fail
The command line will be testcafe with the browser name, for example, chrome and passing the test file then --debug-on-fail.
It will be started in debug mode if the test fails, and after that, we can investigate the reason for the failure.
If this option is enabled, TestCafe pauses the test when it fails - this allows you to view the test pages and determine the cause of failure.
When you are done, click the Finish button in the footer to end the test execution.
# Debug Mode with TestCafe Demo
In this demo, we will learn how to use debug mode with TestCafe while we are running our test cases.
How can we add debug mode in our test cases while we are executing or running our test?
So we will open our existing example with UploadFile.js.
In this example, we set the file to upload and add the path of the file to this function, then we clear that upload file and set it again, and after that click on the upload button.
Maybe before we click on the upload button, we need, for example, to debug or to check that the file upload already takes a file in the control or the element.
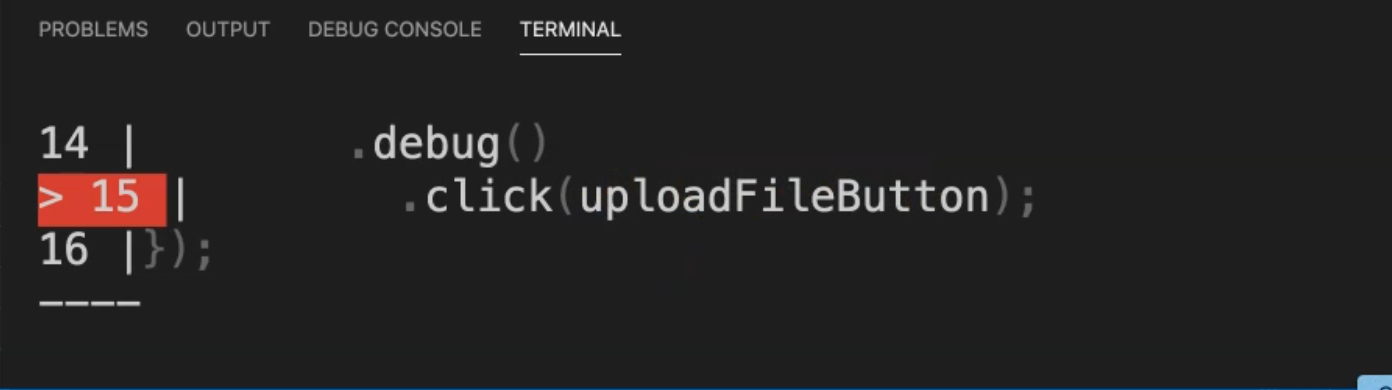
So for example, here, we can add one additional step with debug.
What's the meaning of debugging or what's the description of debugging?
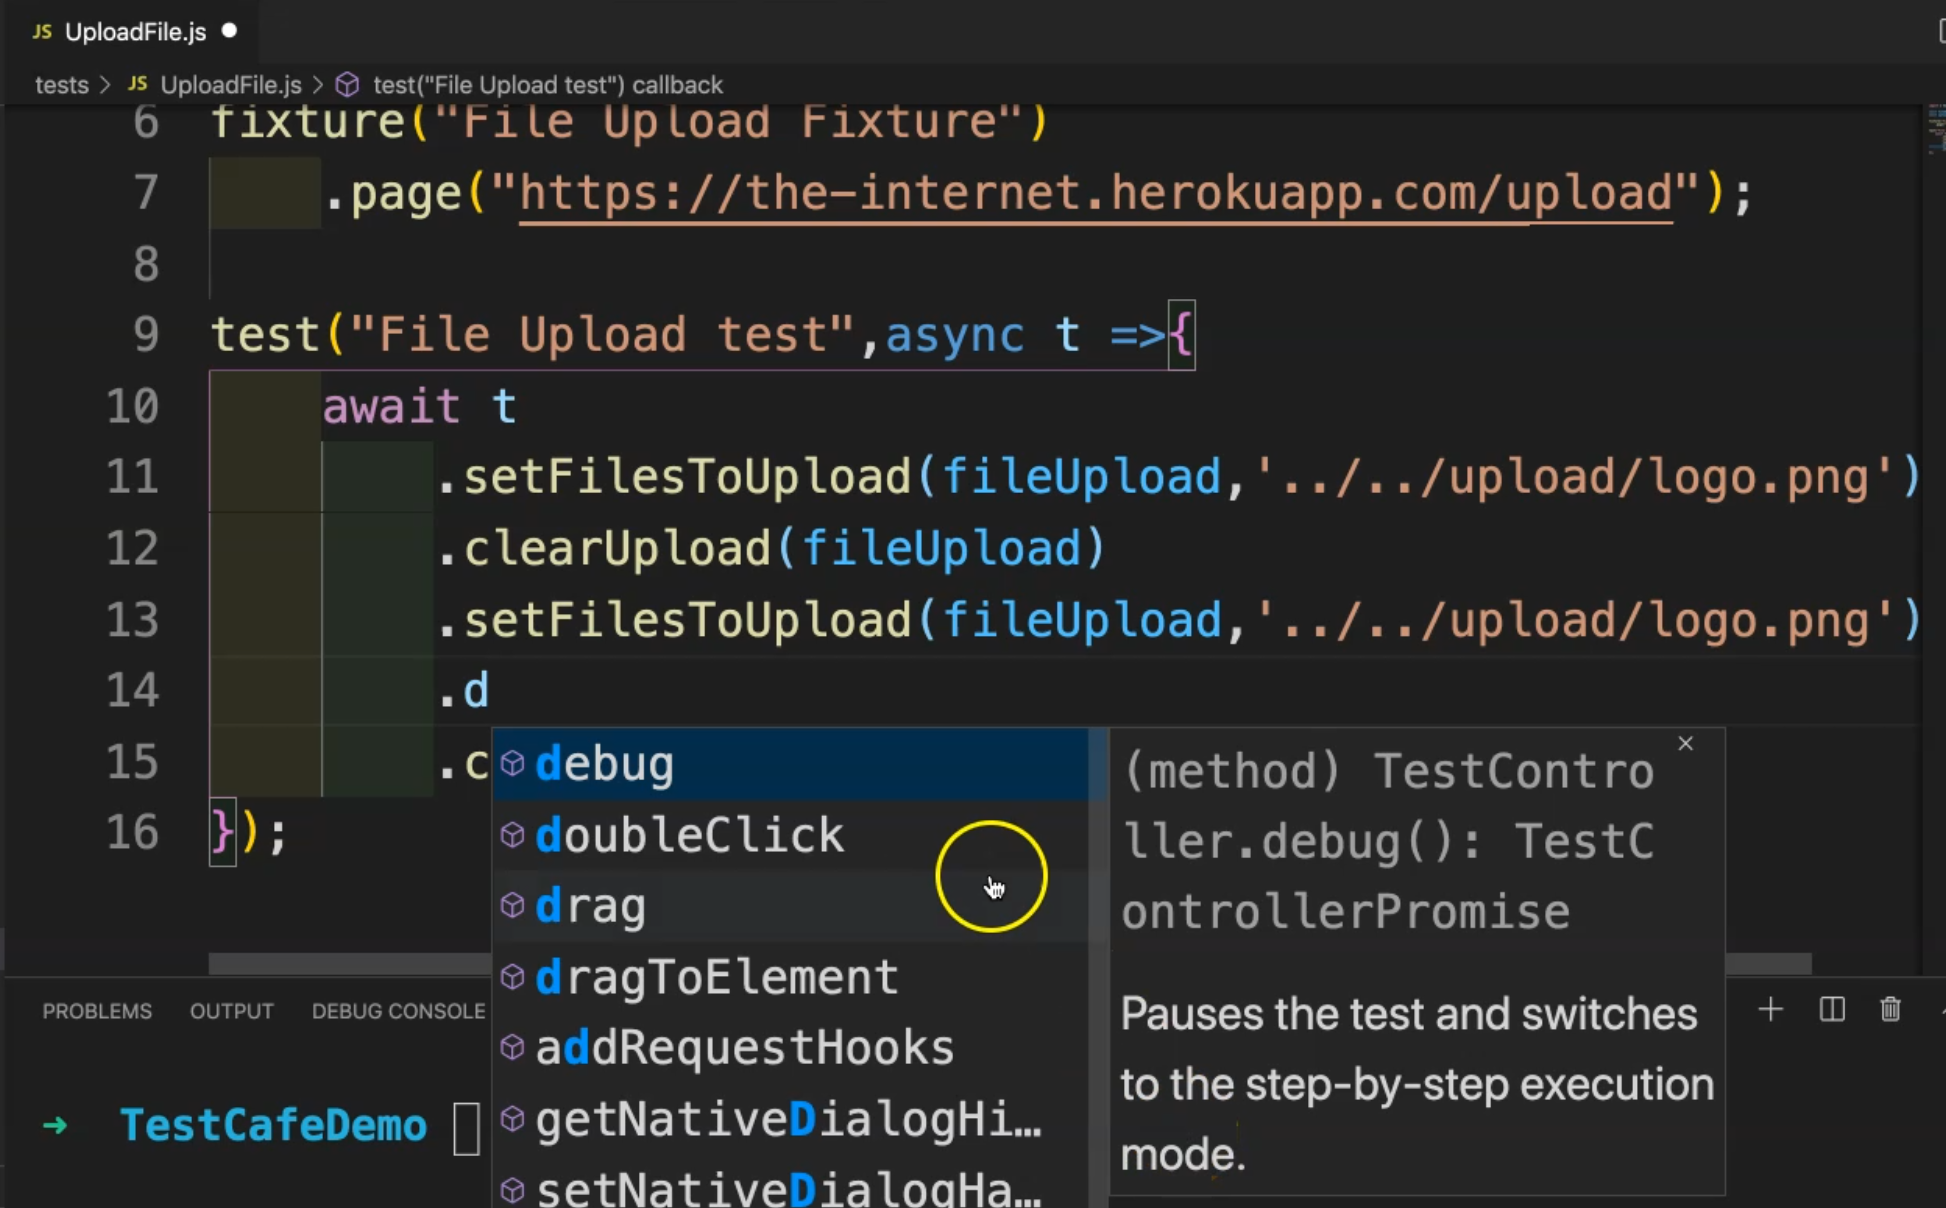
debug() pauses the test and switches to the step-by-step execution mode.
So here we are getting into our debug mode with TestCafe.
We will select debug and then we will add parentheses because this is a function.
import { Selector } from 'testcafe';
const fileUpload = Selector('input#file-upload');
const uploadFileButton = Selector('input#file-submit.button');
fixture("File Upload Fixture")
.page("https://the-internet.herokuapp.com/upload");
test("File Upload test",async t =>{
await t
.setFilesToUpload(fileUpload,'../../upload/logo.png')
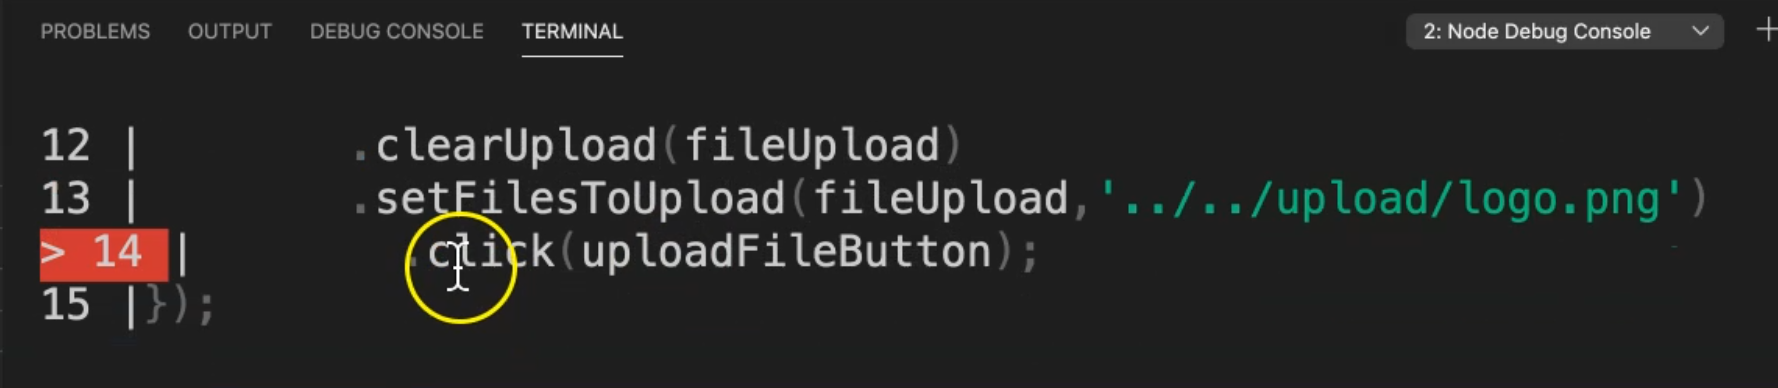
.clearUpload(fileUpload)
.setFilesToUpload(fileUpload,'../../upload/logo.png')
.debug()
.click(uploadFileButton);
});
After that, we start running our tests normally.
So we are saving our file and then we can say:
testcafe chrome tests/UploadFile.js
Without any parameter or anything, we will run our test case.
So TestCafe we will start the server and we will see what happens during our test.
Here we are redirected to the website, then here we go.
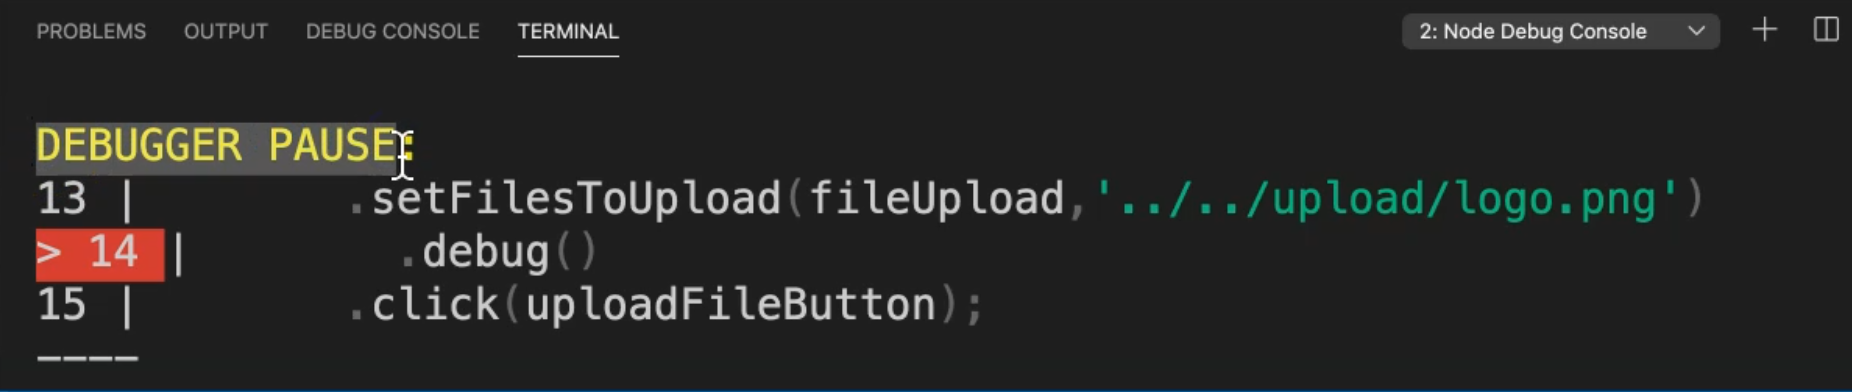
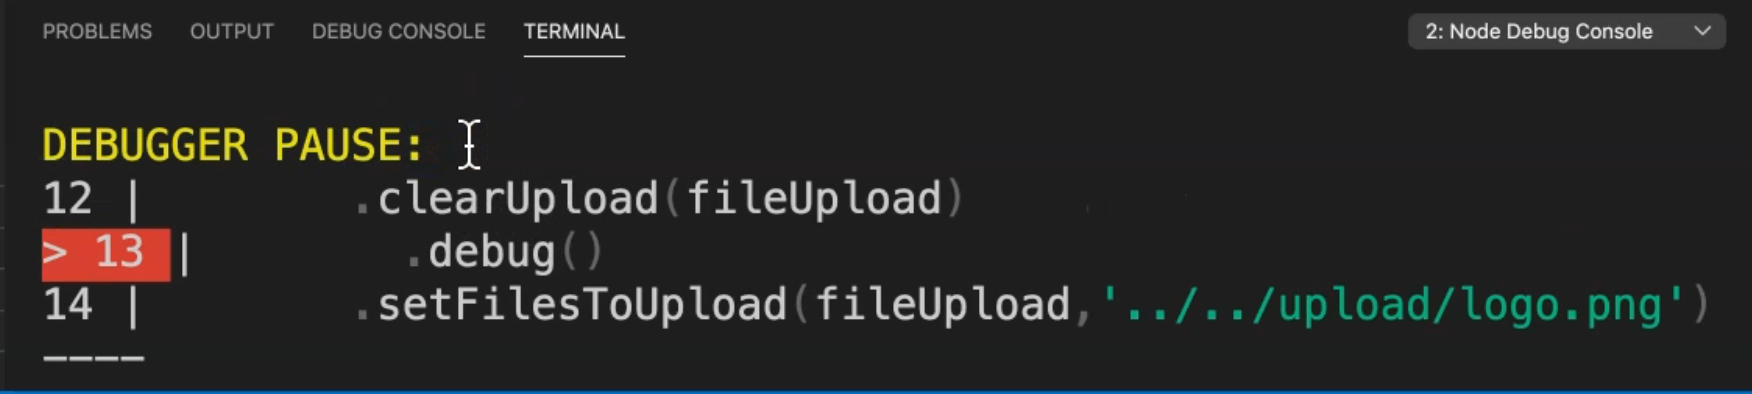
So here, we have this "DEBUGGER PAUSE" and we are now entered into debug mode.
After we set the file upload, then we have the debug here.
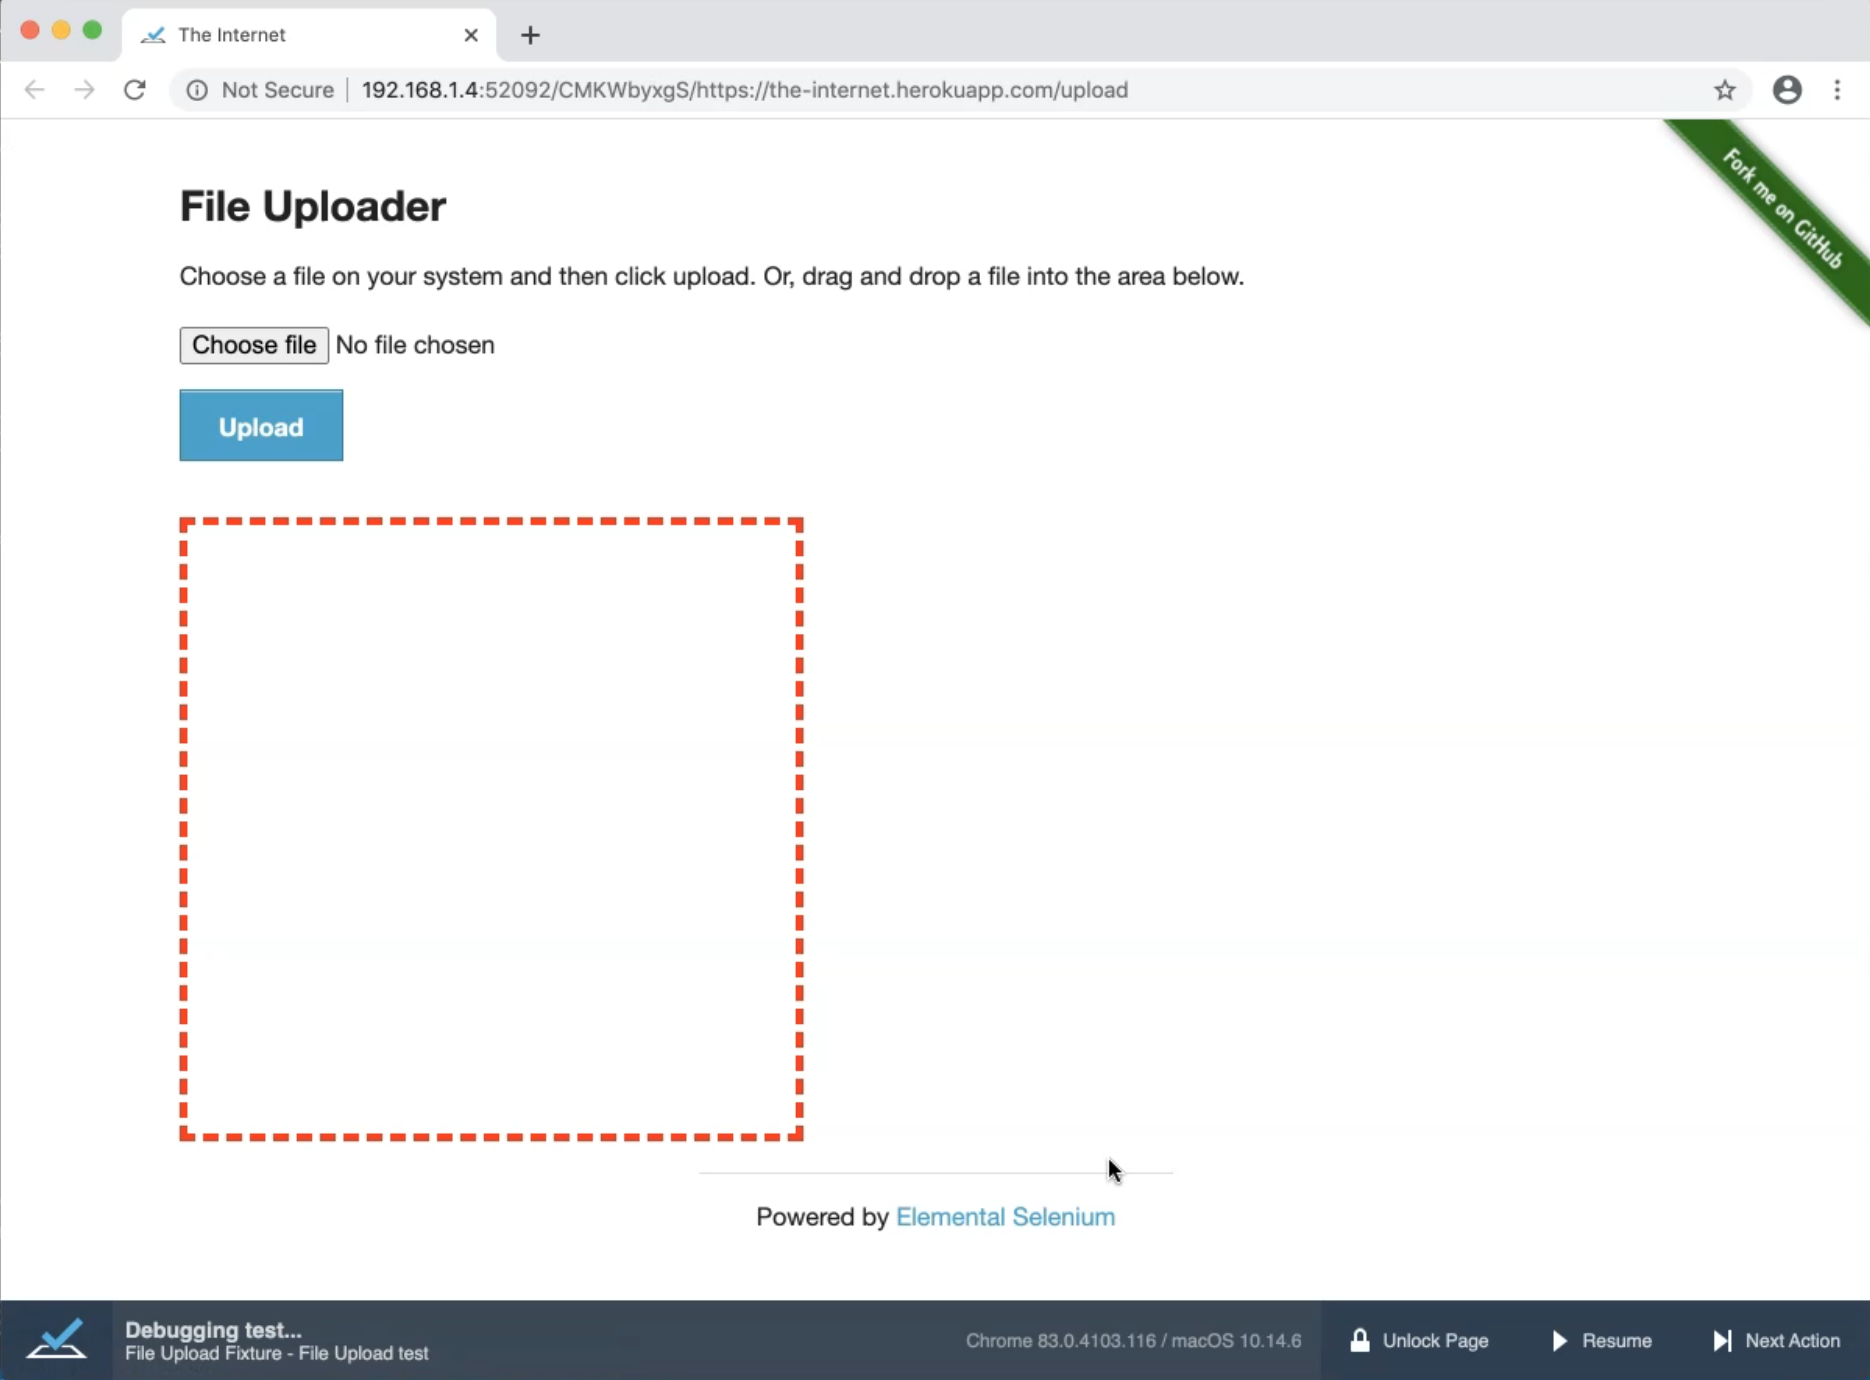
So if we opened the browser again, and we will check here that the application or our test is paused, then we have different options.
We can select "Next Action" - for example - the next action is to click the file upload button, or we can "Resume" to continue all the steps.
This is like step by step, this is always the "Next Action", or we'll "Resume" all the steps if we have different steps after this one, or we can also "Unlock Page" and start inspecting or check anything on the page URL.
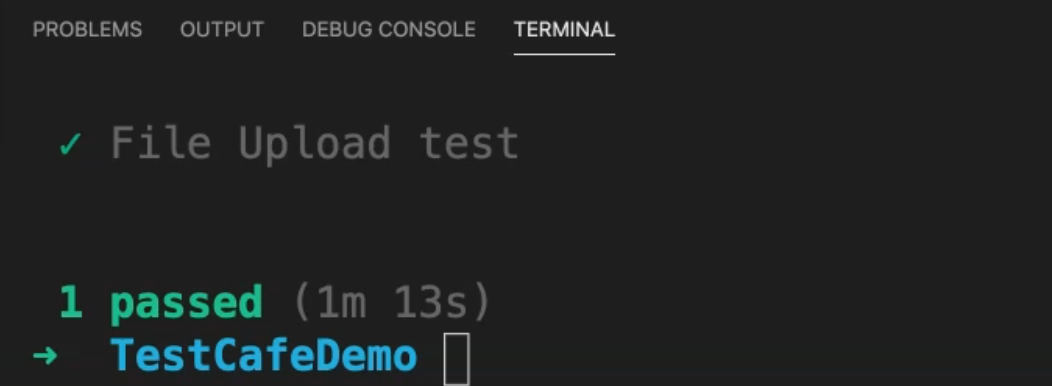
For example, if I click "Next Action", I'm now in click(uploadFileButton).
Then, I will click "Next Action" so I clicked "Upload" and our test case passed.
So what if, for example, I removed this debug and put it here before the second setFilesToUpload().
import { Selector } from 'testcafe';

const fileUpload = Selector('input#file-upload');
const uploadFileButton = Selector('input#file-submit.button');

fixture("File Upload Fixture")
    .page("https://the-internet.herokuapp.com/upload");

test("File Upload test",async t =>{
    await t
        .setFilesToUpload(fileUpload,'../../upload/logo.png')
        .clearUpload(fileUpload)
        .debug()
        .setFilesToUpload(fileUpload,'../../upload/logo.png')
        .click(uploadFileButton);
});
So let's run our tests again and check what happened.
TestCafe opens the server and redirected it to our URL.
So here we have this system debug.
So now we are clearing or we cleared the upload and you have the debug mode.
Then for example, if I click "Resume", so it will continue with all the steps with our step by step mode.
So let's run it again and in this step, we will check the "Unlock Page".
So here again, we are in the debug mode.
For example, I can unlock the page and I can work with anything on the page. F
For example, I can Inspect this element, open the DevTools, I can open the console and I check anything related to my browser.
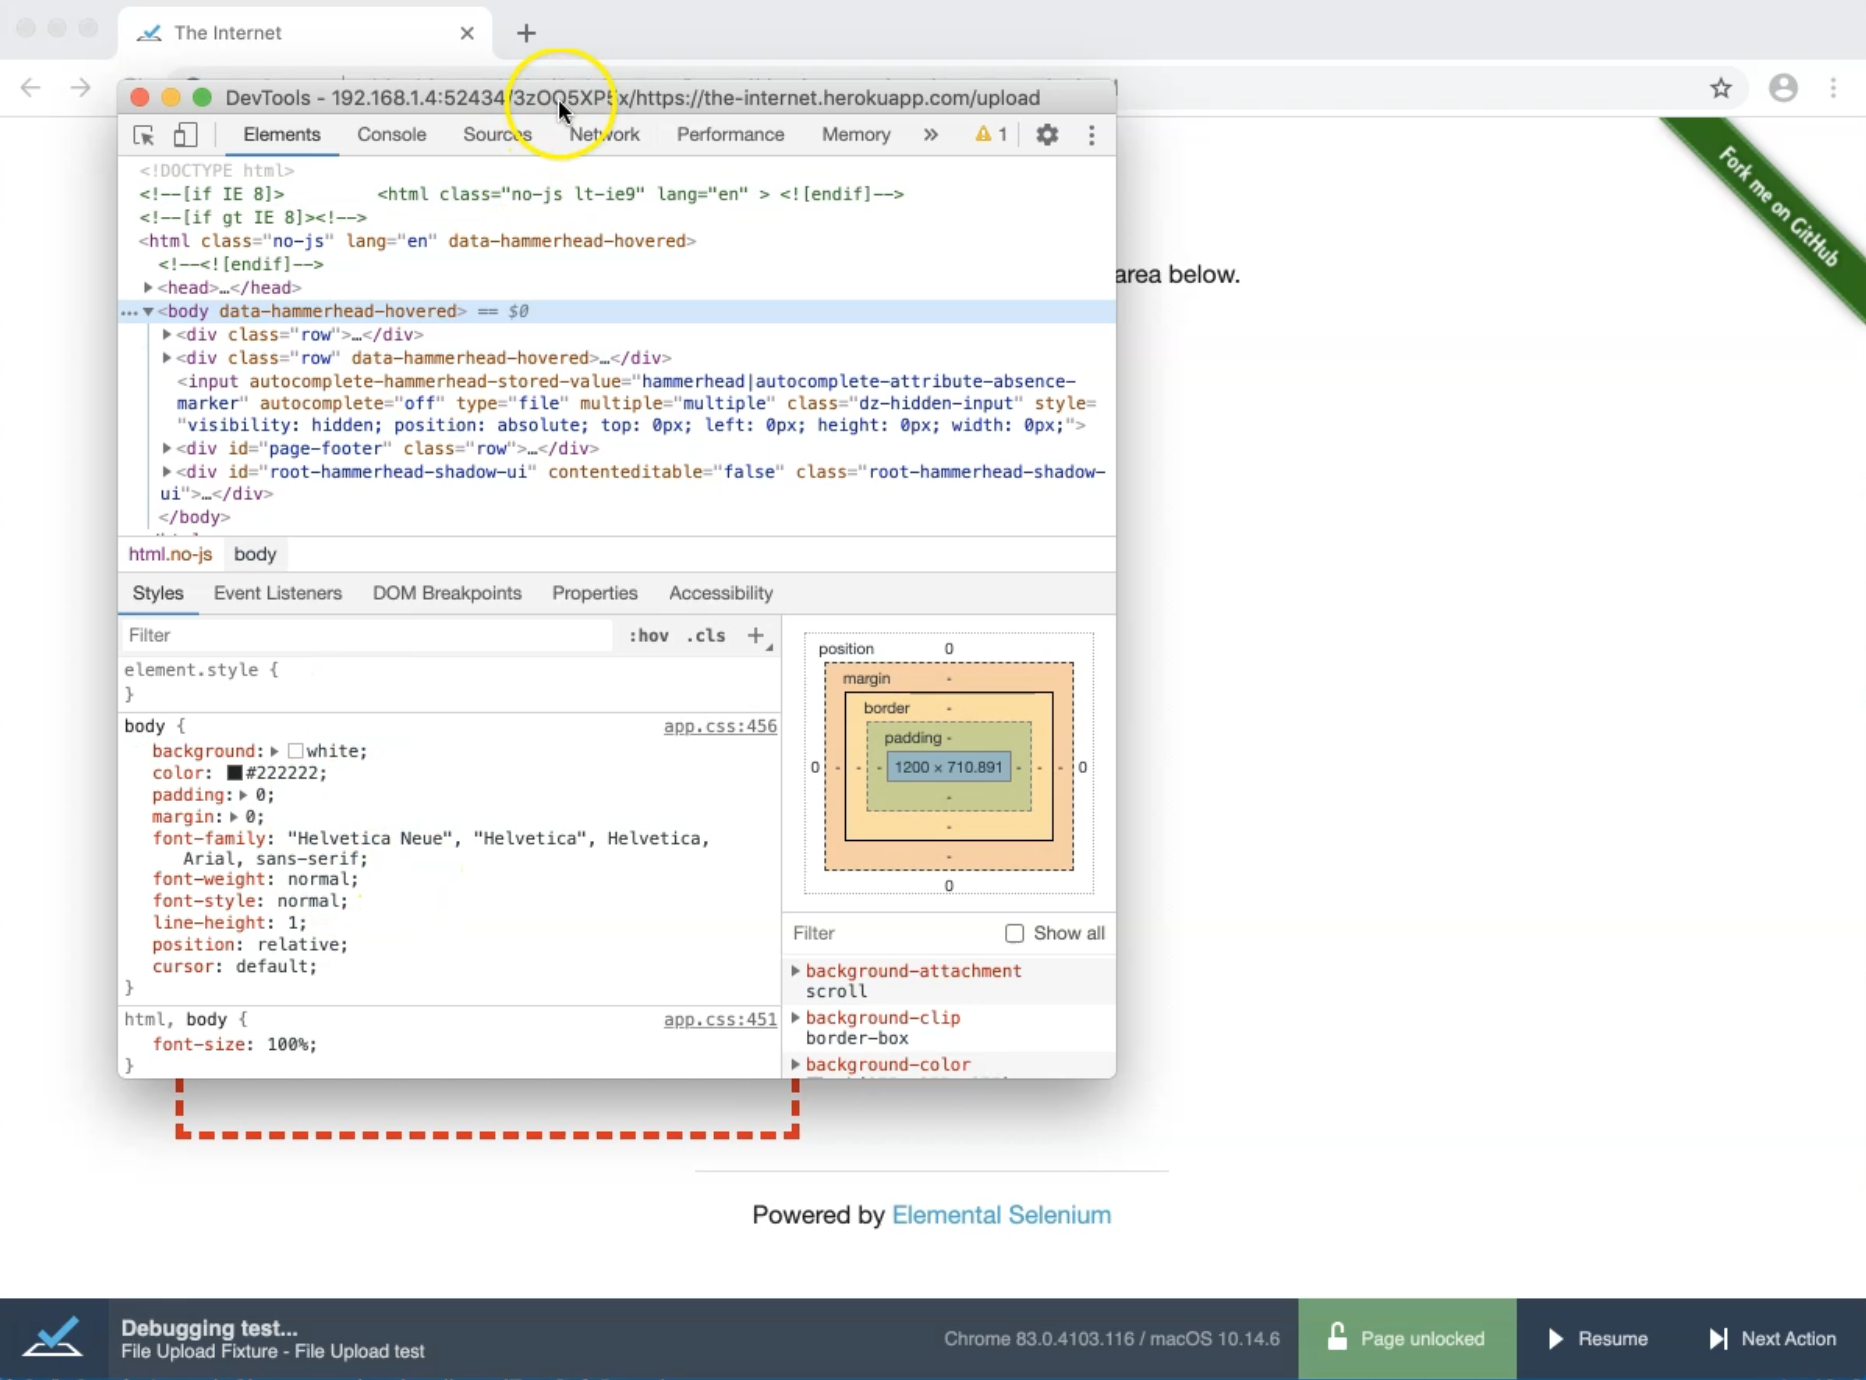
For example, if there is any JavaScript error, for example, I can check it during our test.
So I'm now in the debug mode.
If I finish everything, so I lock it or I can resume it again, then my test will pass.
What if I want to enter debug mode or switch to debug mode if my test case is failing, or if I have any failure in a test case?
So in this case, I will remove debug() because I don't add a specific debug and in this specific step.
And with my TestCafe command, I can add --debug-on-fail.
testcafe chrome tests/UploadFile.js --debug-on-fail
This means that we will switch to the debug mode once we have a failure in our test.
So let's run our test because here we don't have any problems with the test. So let's see what happened in the first run.
After that, maybe we can change anything in our test to fail and after that, we can check the reason.
So here we open the TestCafe redirect to the page. Our code is working fine and without anything and we didn't switch it to debug mode.
Then what if - for example - here we can change anything in the selector. For example, in the submitButton, we can add any value here and after that, we can repeat our command again.
The browser will open and we will check what happened.
Here we uploaded the file, and then we are waiting for the element to appear. Here, we don't have any problems.
And then, the test failed, but the browser is still open.
We need to check, or we need to click on "Finish" if you wanted to finish it, or we can also unlock the page.
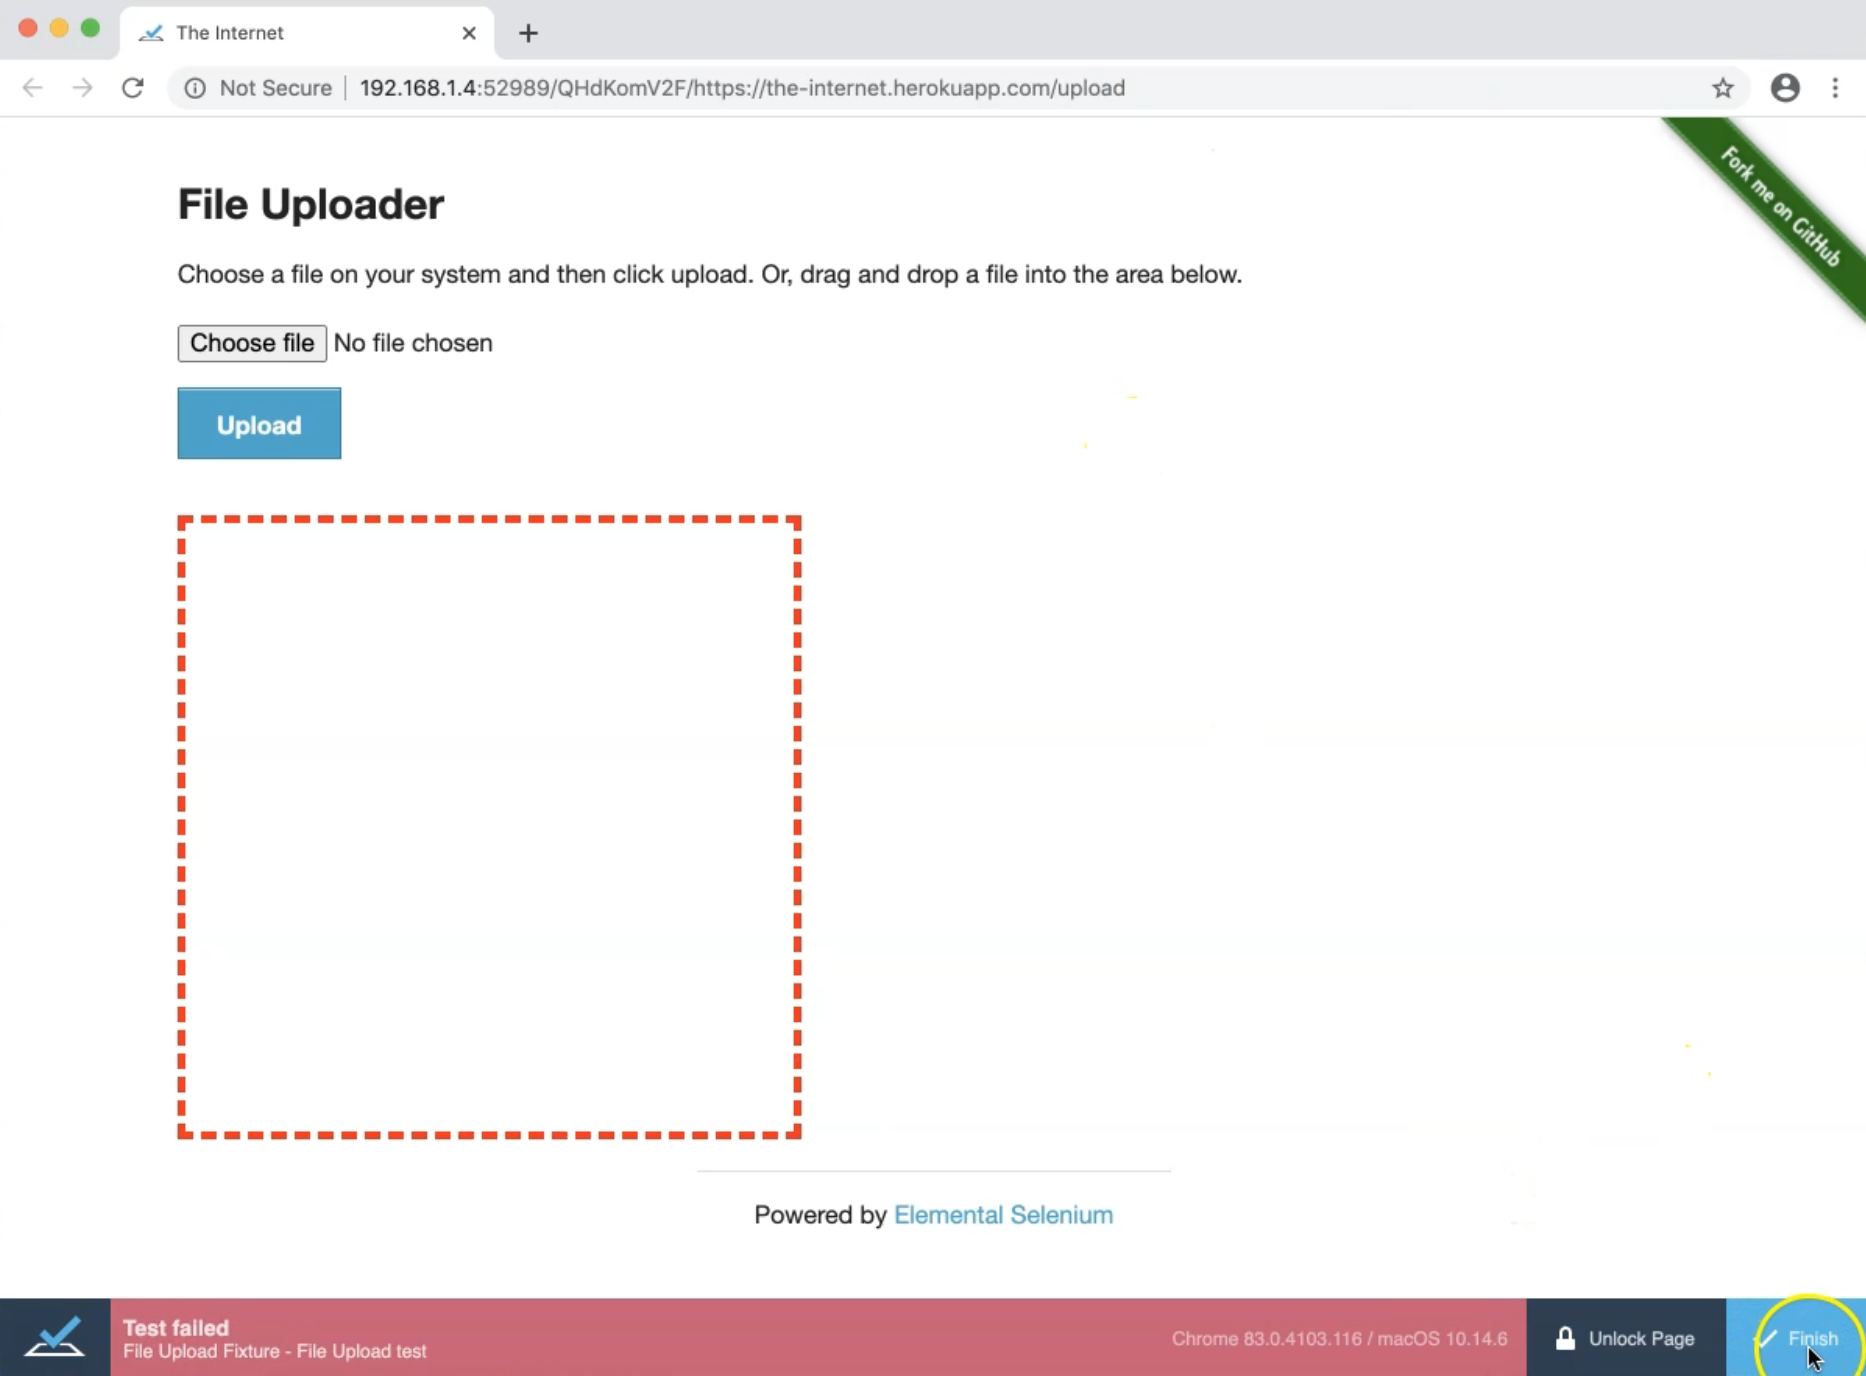
If you switch back to the command line, we can find this is the error - click(uploadFileButton) because we changed the element of the file upload - we changed the selector to be incorrect.
So we entered or switched directly to debug mode, with the line that included this error.
Also, we're still running our tests.
To check what happened during our test or to unlock the page and check anything related to JavaScript error or anything, we can open developer tools and check what happened during our test.
Then if you want to finish it, we can finish it, and here we know where the error is in our test case.
So we can use debug mode on failure, or we can use debug - even if we wanted to add any debug step in our test case.
Resources
Quiz
The quiz for this chapter can be found in 6.5
